
Cities are complex systems where accessibility to essential services—such as healthcare—can directly affect quality of life and emergency response outcomes. Traditional urban maps often show where services are located, but they rarely communicate how accessible these services are in real, everyday conditions. The
This project explores how computational design tools can be used to analyze and visualize urban accessibility in a more dynamic and data-driven way. Using Grasshopper as the main environment, we combined OpenStreetMap (OSM) data (roads, buildings, amenities) with an external dataset of bus stops to visualize healthcare connectivity in the urban context.
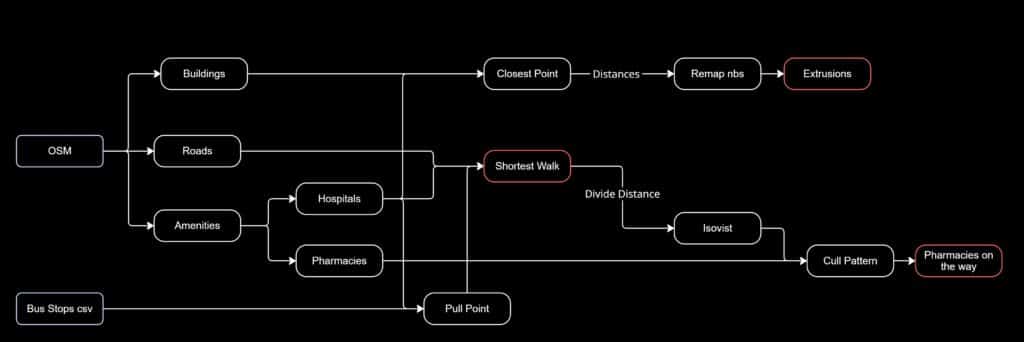
|Pseudocode
|Shortest Path to the Nearest Hospital
The first visualization depicts the shortest path on the road network from your current position to the nearest hospital, but the path cost is biased using values derived from how close roads are to bus stops. Also, the pharmacies are shown along the way.
|Buildings Connectivity to Hospitals
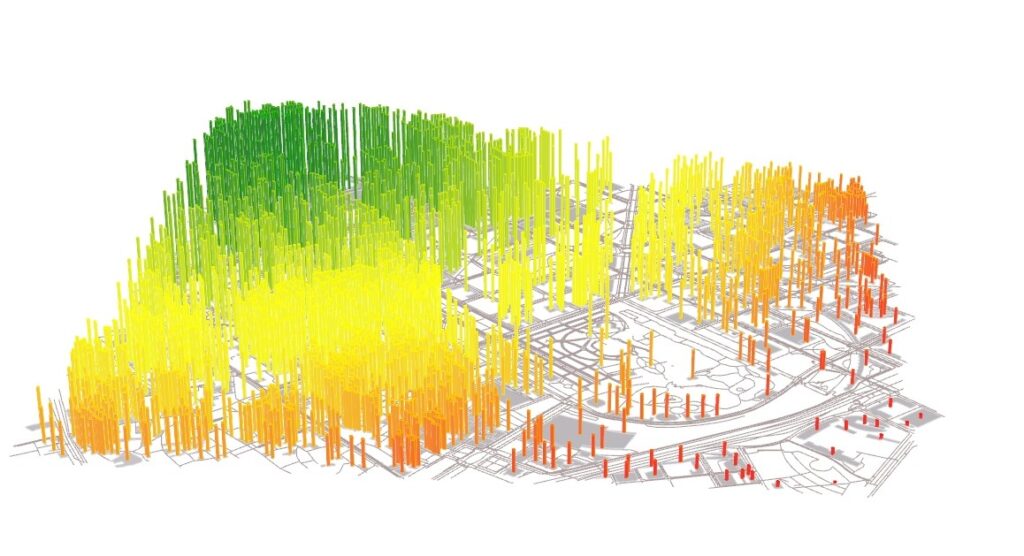
The second visualization illustrates the proximity of buildings to available hospitals. The greener the area, the better the connectivity.
