
ABSTRACT
Derived from the 2020 pandemic sanitary measures for Covid-19, Google created the Community Mobility Reports, which provide valuable insights of how people’s mobility changed as a result of the established health policies. The objective of this analysis was to understand how United States residents’ mobility behavior changed over time due to the COVID-19 pandemic.
We observed that there was a decrease of mobility activity in April of 2020, the beginning of the lockdown. When comparing the activity of 2022 (defined as after COVID) we observe a change of pattern activities regarding the patterns shown in 2020 and 2021, because in 2022 the majority of people preferred to spend their time in parks despite the season and temperature.
After this analysis we conclude that as professionals of the Built Environment field, analyzing people’s time-use data helps us to ensure that cities are designed according to the needs, habits, and well-being of their inhabitants.
Keywords: Time use, COVID-19, Mobility, Percent, Change, Baseline, Retail and Recreation, Grocery and Pharmacy, Parks, Transit stations, Workplaces, Residential, Behavior, States, Urban Planning.
INTRODUCTION
In 2020, when communities around the world began to implement COVID-19 response measures, health authorities collaborated with Google to leverage the same anonymized information used in products like Google Maps towards informing critical decisions related to the COVID-19 strategies. Thus, Google created the Community Mobility Reports, a database which provides valuable insights of how people’s mobility changed as a result of the pandemic and the policies established to combat COVID-19.
With data collected from February 15th 2020 until October 15th 2022, these reports show movement trends over time classified into six place categories:
- Retail and Recreation
- Grocery and Pharmacies
- Parks
- Transit stations
- Workplaces
- Residential areas
Objective of the analysis
Through the analysis of this data set, we have the intention of understanding how the human behavior changed through time for the population of the United States of America derived from the COVID-19 pandemic.
Community Mobility Reports
The COVID-19 Community Mobility Reports are a group of databases created by Google with aggregated, anonymized sets of data from their users who had turned on the Location History setting. The Reports show the movement trends across different categories of places, comparing the mobility with a baseline of people’s behavior before the policies to combat COVID-19.
The Baseline
The change in time use throughout the Community Mobility Reports database is referenced to a baseline taken from the median values of a 5-week period from January 3rd 2020 to February 6th 2020. These median values were assigned with the value “0”, meaning that the increase of mobility according to the baseline is represented in positive numbers, while the decrease is represented in negative numbers. Each day of the week has its own baseline value, so that each Wednesday is referencing the same Wednesday baseline and Saturday is referencing its own Saturday baseline.
Data Privacy
In order to keep safe the users identity and their information, the data underwent a process of anonymization named differential privacy, which involves an addition of noise to the data sets to prevent identification of the users. No personally identifiable information, like users’ precise location, contacts, or movement, was made available at any point.
ANALYSIS OF TIME USE
Nation-wide time use throughout 2020 to 2022
As a general overlook of the change in monthly time use in all the country during the three years (2020, 2021 and 2022) we can observe a raise in the Parks activity in the months of July, which likely corresponds to the summer season. At the same time, we can observe a decrease of activity in all the six categories in April of 2020 (2020-04), which can be explained due to the beginning of the lockdown.

We then took a deeper look at the change in by weekday. Because each day of the week is compared to it’s day of the week baseline (i.e. all Mondays show change in time use compared to the Monday baseline, all Tuesdays show change in time use compared to the Tuesday baseline, etc.), each day of the week is more easily compared to the same day of the week. The days of the week are referenced as follows:
Monday: Day 0
Tuesday: Day 1
Wednesday: Day 2
Thursday: Day 3
Friday: Day 4
Saturday: Day 5
Sunday: Day 6
We found interesting patterns in this data, particularly surrounding different holidays. For example, for the Mondays, we saw major increases in park usage and mirroring decreases in workplace activity for:
- Memorial Day (May 25, 2020; May 31, 2021; and May 30, 2022)
- Labor Day (September 7, 2020; September 6, 2021, September 5, 2022)
- Independence day (July 5, 2021 (the Monday was the off since July 4 fell on a Sunday this year); July 4, 2022)
Other interesting trends include spikes in time spent at home on Thanksgiving (and an accompanying decrease in all other activities), and spikes in grocery trips in the before Thanksgiving and the days before Christmas. Christmas was generally associated in a spike in residential activity and a decrease in all other activities. Saturdays and Sundays saw much higher increases in park activity from March to October of every year, and notably Easter Sunday had a decrease in time spent at retail and recreation places, workplaces, transit, and groceries and pharmacies.


To better understand the relationship between different time uses, we used a correlation heatmap to compare how each time use changes according to the other time uses. We found that residential time use correlated very negatively with the other time uses, indicating that when people in the US spend more time at home, this increase comes at the expense of other activities. In particular, this inverse relationship was strongest between increase in time spent in residential settings and time spent in transit stations. To understand how these impacted each other, we mapped just time in transit and time in residences over the course of the entire time period.


Monthly state analysis from February 2020 to October 2022
Next, we took a look at the trends by state by averaging time use change values for each month, and mapped them.
Here we see state by state changes in their time use for 2020, 2021, 2022.


From February to April of 2020 we see a decrease in the workplaces category, while the residential category gains importance. From July until October of 2020 we observe a change from residential to parks, with parks being the dominant category throughout the summer until it started to be replaced by increasing residential time use in November, which coincides with the decrease of temperatures and the beginning of the winter, likely encouraging people to spend more time at home than outside.
In 2021 the patterns are similar, residential time use increasing in the cold months of January and February, with park usage gently increasing in the spring and summer. Parks remain the dominant category until the end of the autumn in November.
Finally, in 2022 we see a different output, more specifically in the months of November and December. Compared with the past two years (2020 and 2021), in 2022 the majority of people preferred to spend their time in parks despite the season and temperature, making evident a change of pattern activities during and after the COVID-19 lockdown.
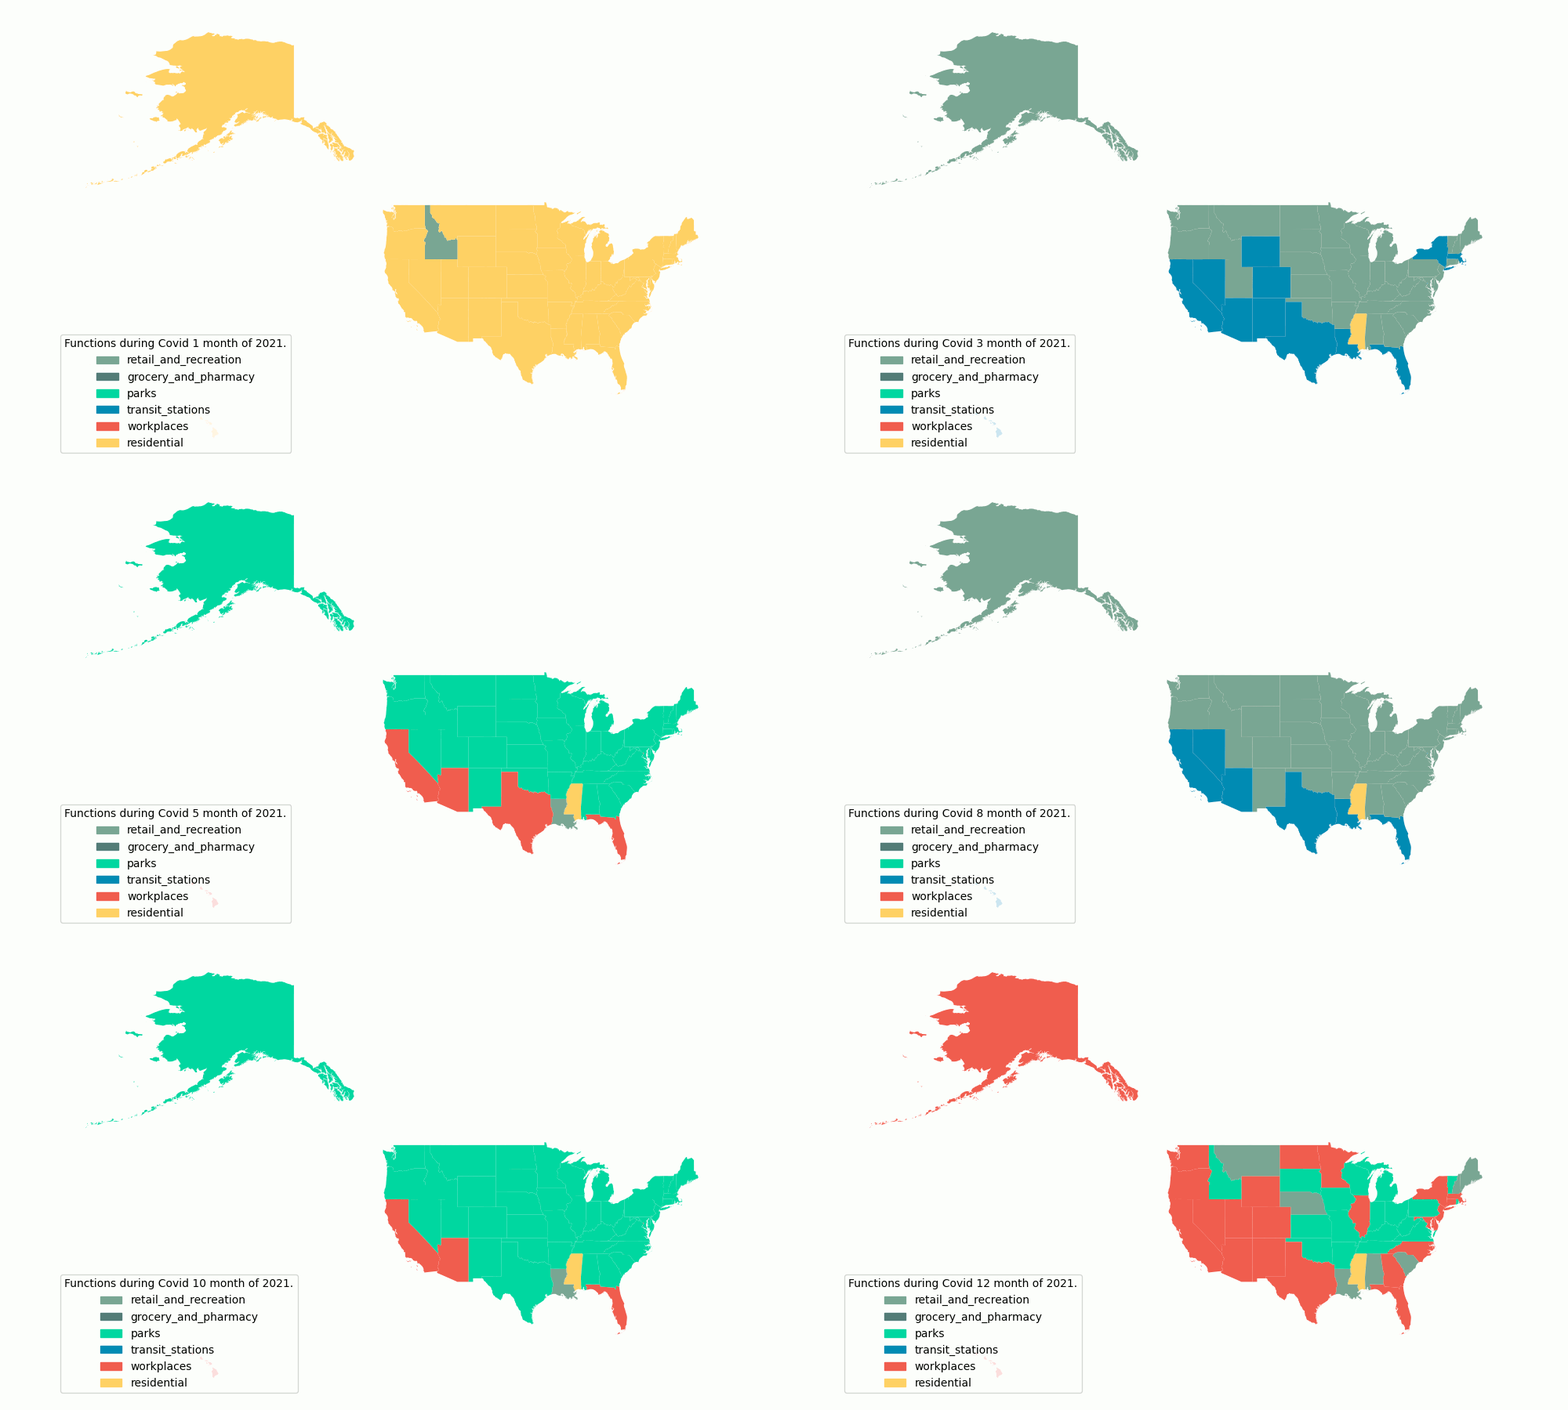
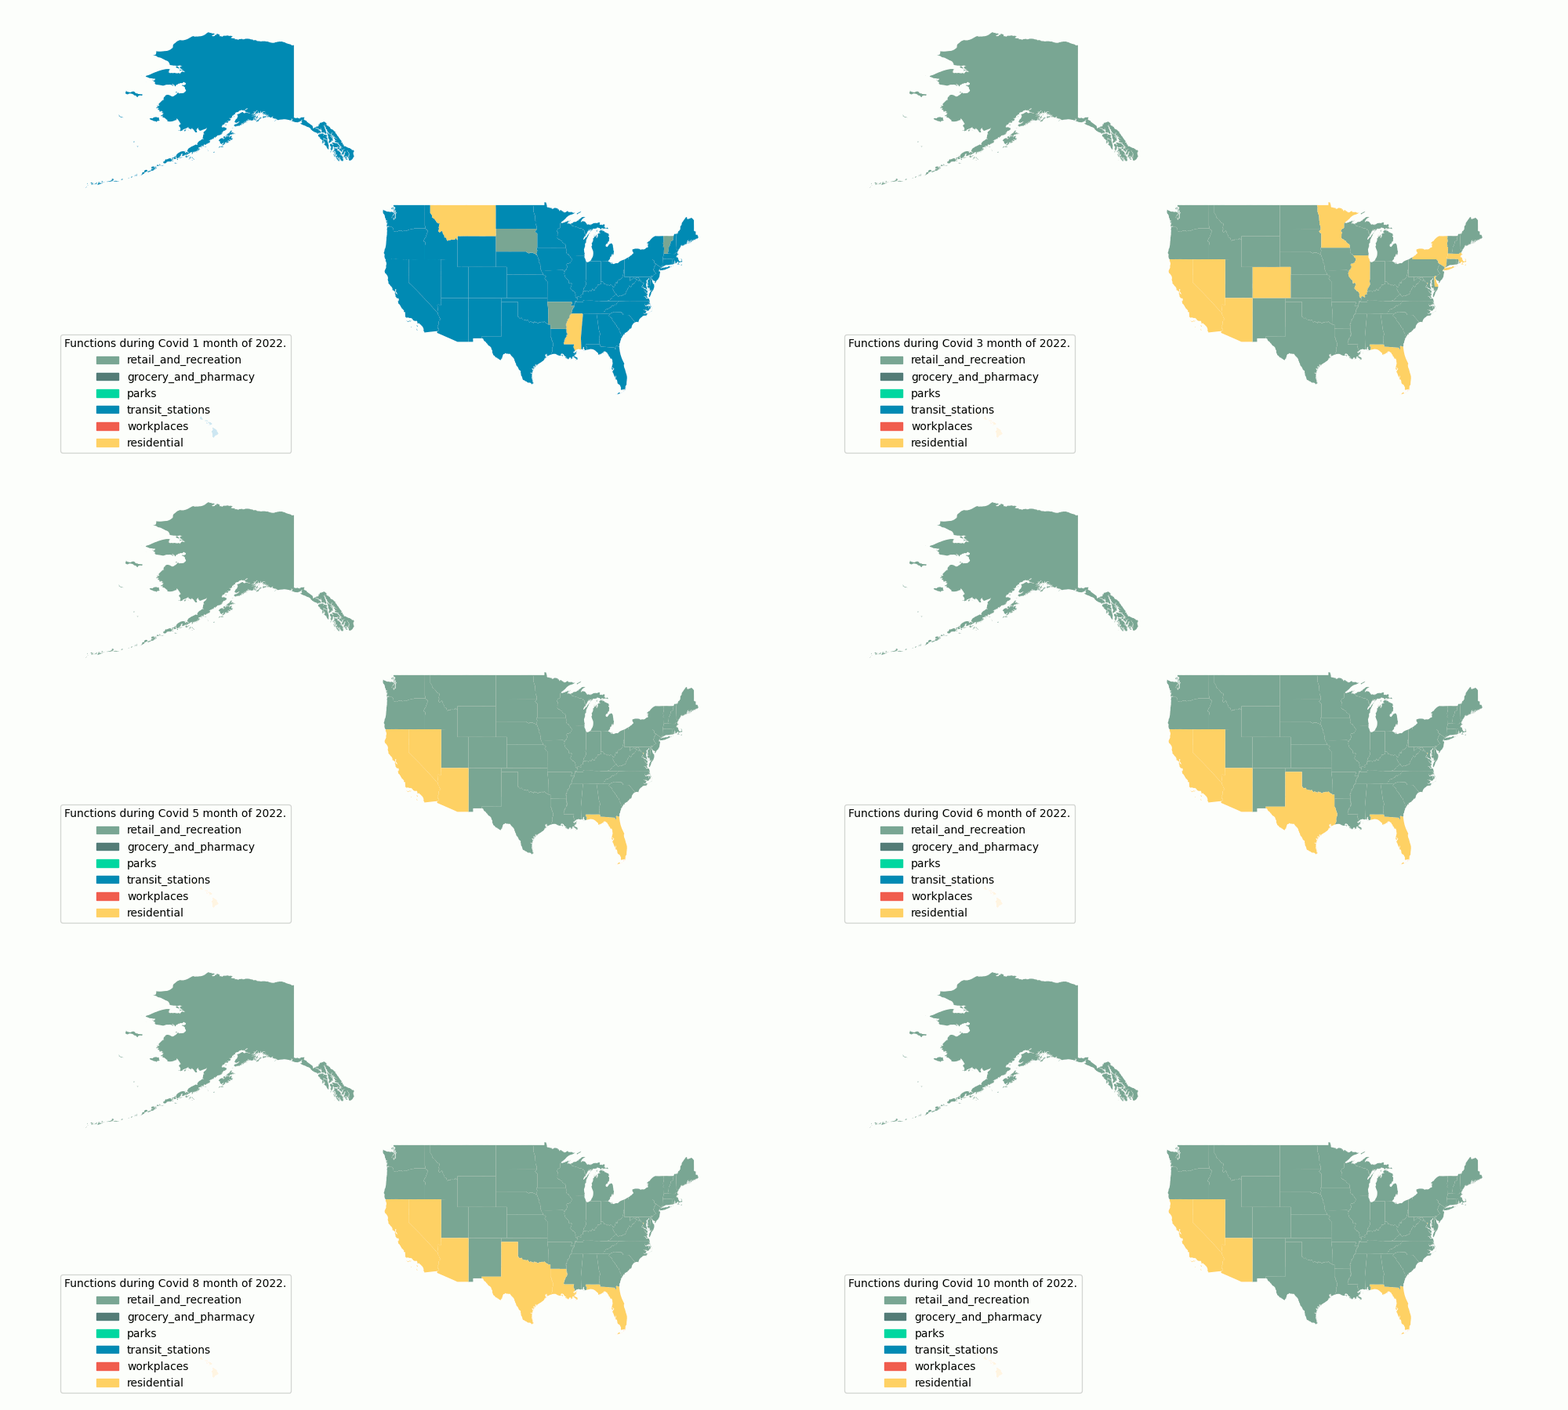
In the following series of maps for 2020, 2021, and 2022, we map the activity that had the highest time use change for the month. While most states follow the same pattern across the year, regional differences do arise.
In 2020, southern states tended to have residential activities as their highest time use change, while most states prioritized increasing their retail and recreation time during the warmer months. In the winter months, residential activities again prevail with the higher time use change.
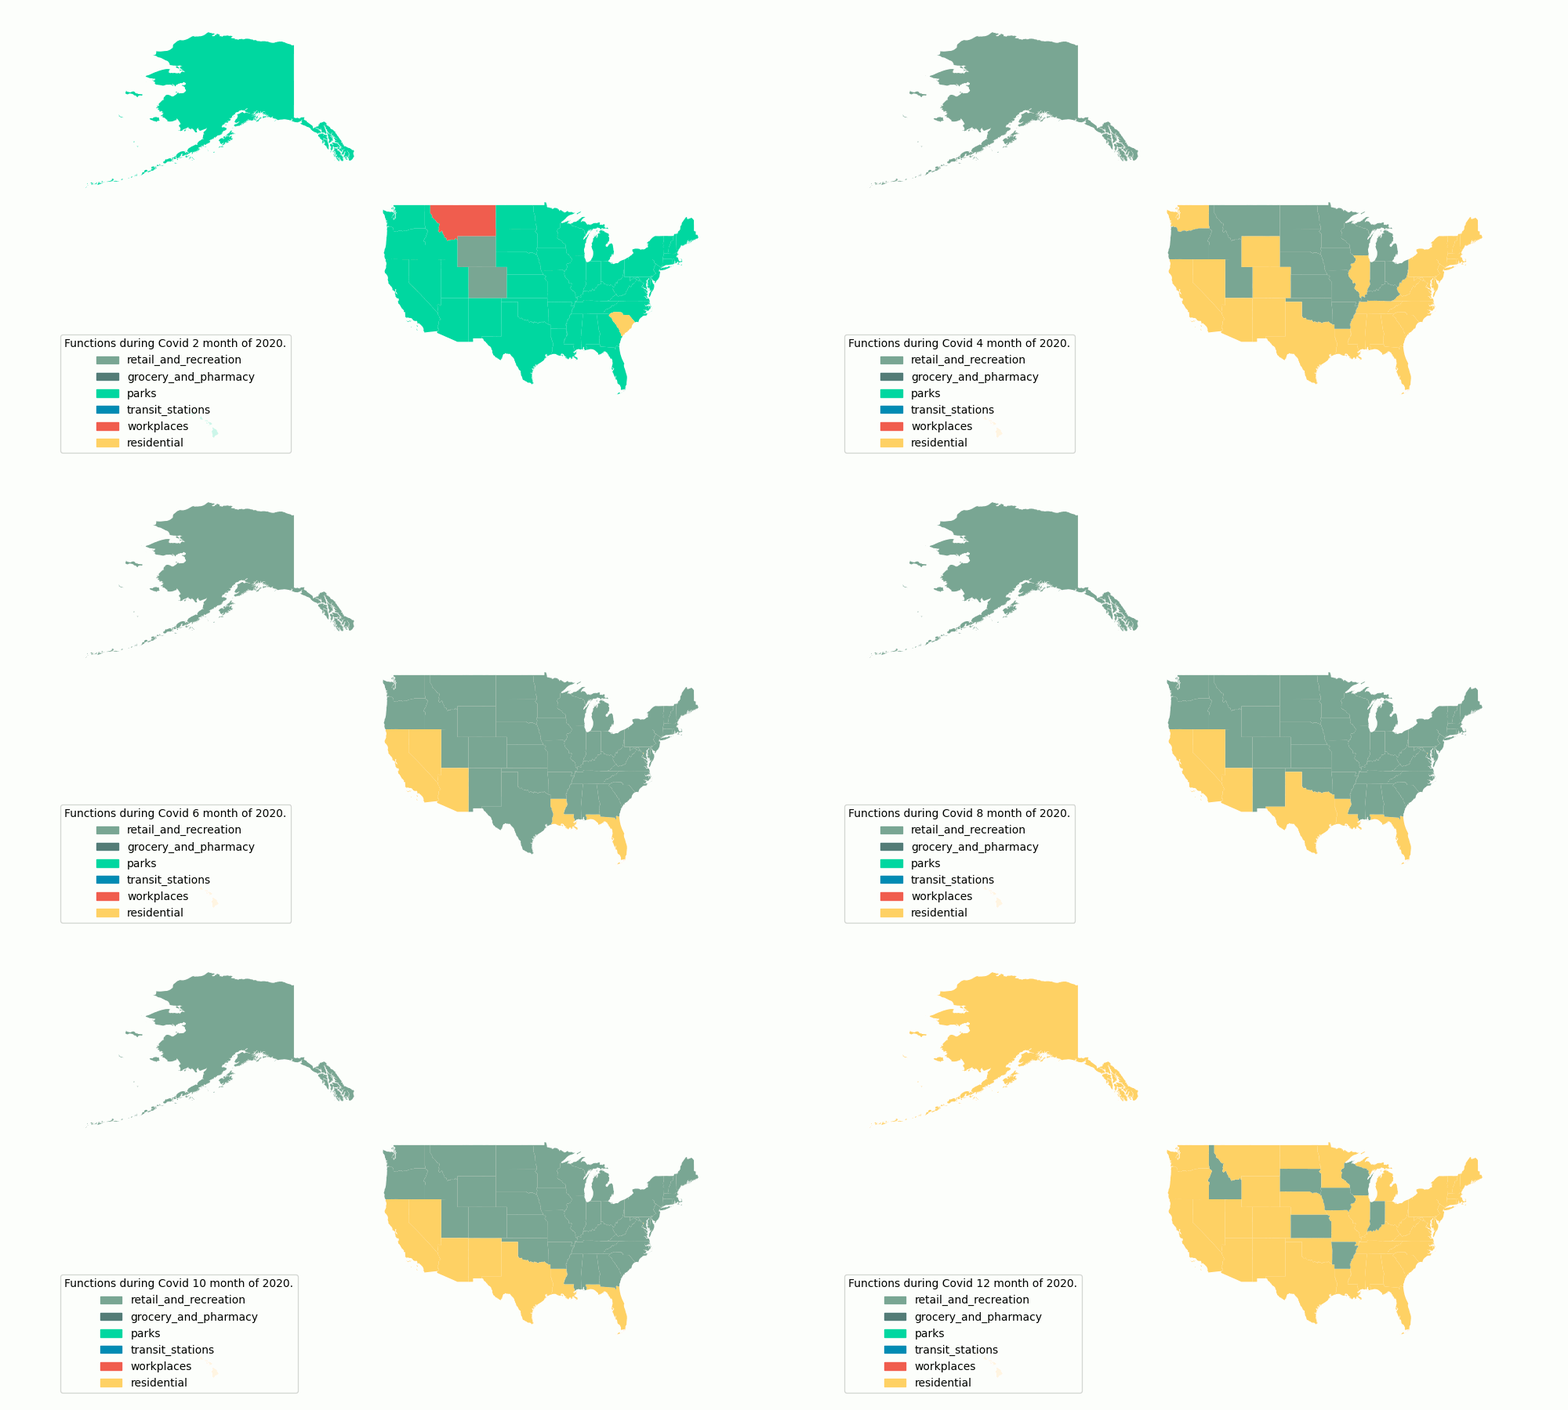
2021 continued with a highest change in the residential category, but then in March most states quickly changed to retail and recreation, with some southern states switching to transit as their highest change. In May, we see another switch with most states increasing their time at parks the most, while the southern states switch from transit being their highest to work. Most states switch between these values until December, when we see a mix of highest time use changes: parks in central states, workplaces in the western states and the east coast, some retail and recreation scattered throughout, and Louisiana increasing their time spent indoors.
In 2022, January started with a nationwide time use increase in transit stations, and the rest of the year mostly had the highest time use change take place in the retail and recreation category.
After analyzing the highest time use increase, we wanted to see which activities featured the greatest decreases in this same time frame. The following three graphics are interactive layer maps, with each layer corresponding to a month of the year in which the state experienced the greatest decrease in the highlighted category. These layers can be clicked on or off.
In 2020, February had two main greatest decreases across the states: residential and work. After the onset of the pandemic in the US, the main decreases for the rest of the year were workplace and transit.
In January 2021, there were a mix of greatest decrease categories, mostly work and transit and some park use. Then, for the rest of the year, the main greatest decrease was for work and sometimes transit.
2022 started like 2021 with the same mix of greatest decrease categories (transit, work, one state had parks and another had retail). The rest of the year was similar to 2021: mainly work and transit were the greatest decrease in time use.
Next, we wanted to analyze the time use change within one category across the different states. The following heat map shows how workplace time use changed throughout 2020. Dark blue means that the state had a greater decrease in workplace time use, whereas light blue means that it had a small decreases. Most states aligned throughout the year in decreasing time spent at the workplace.
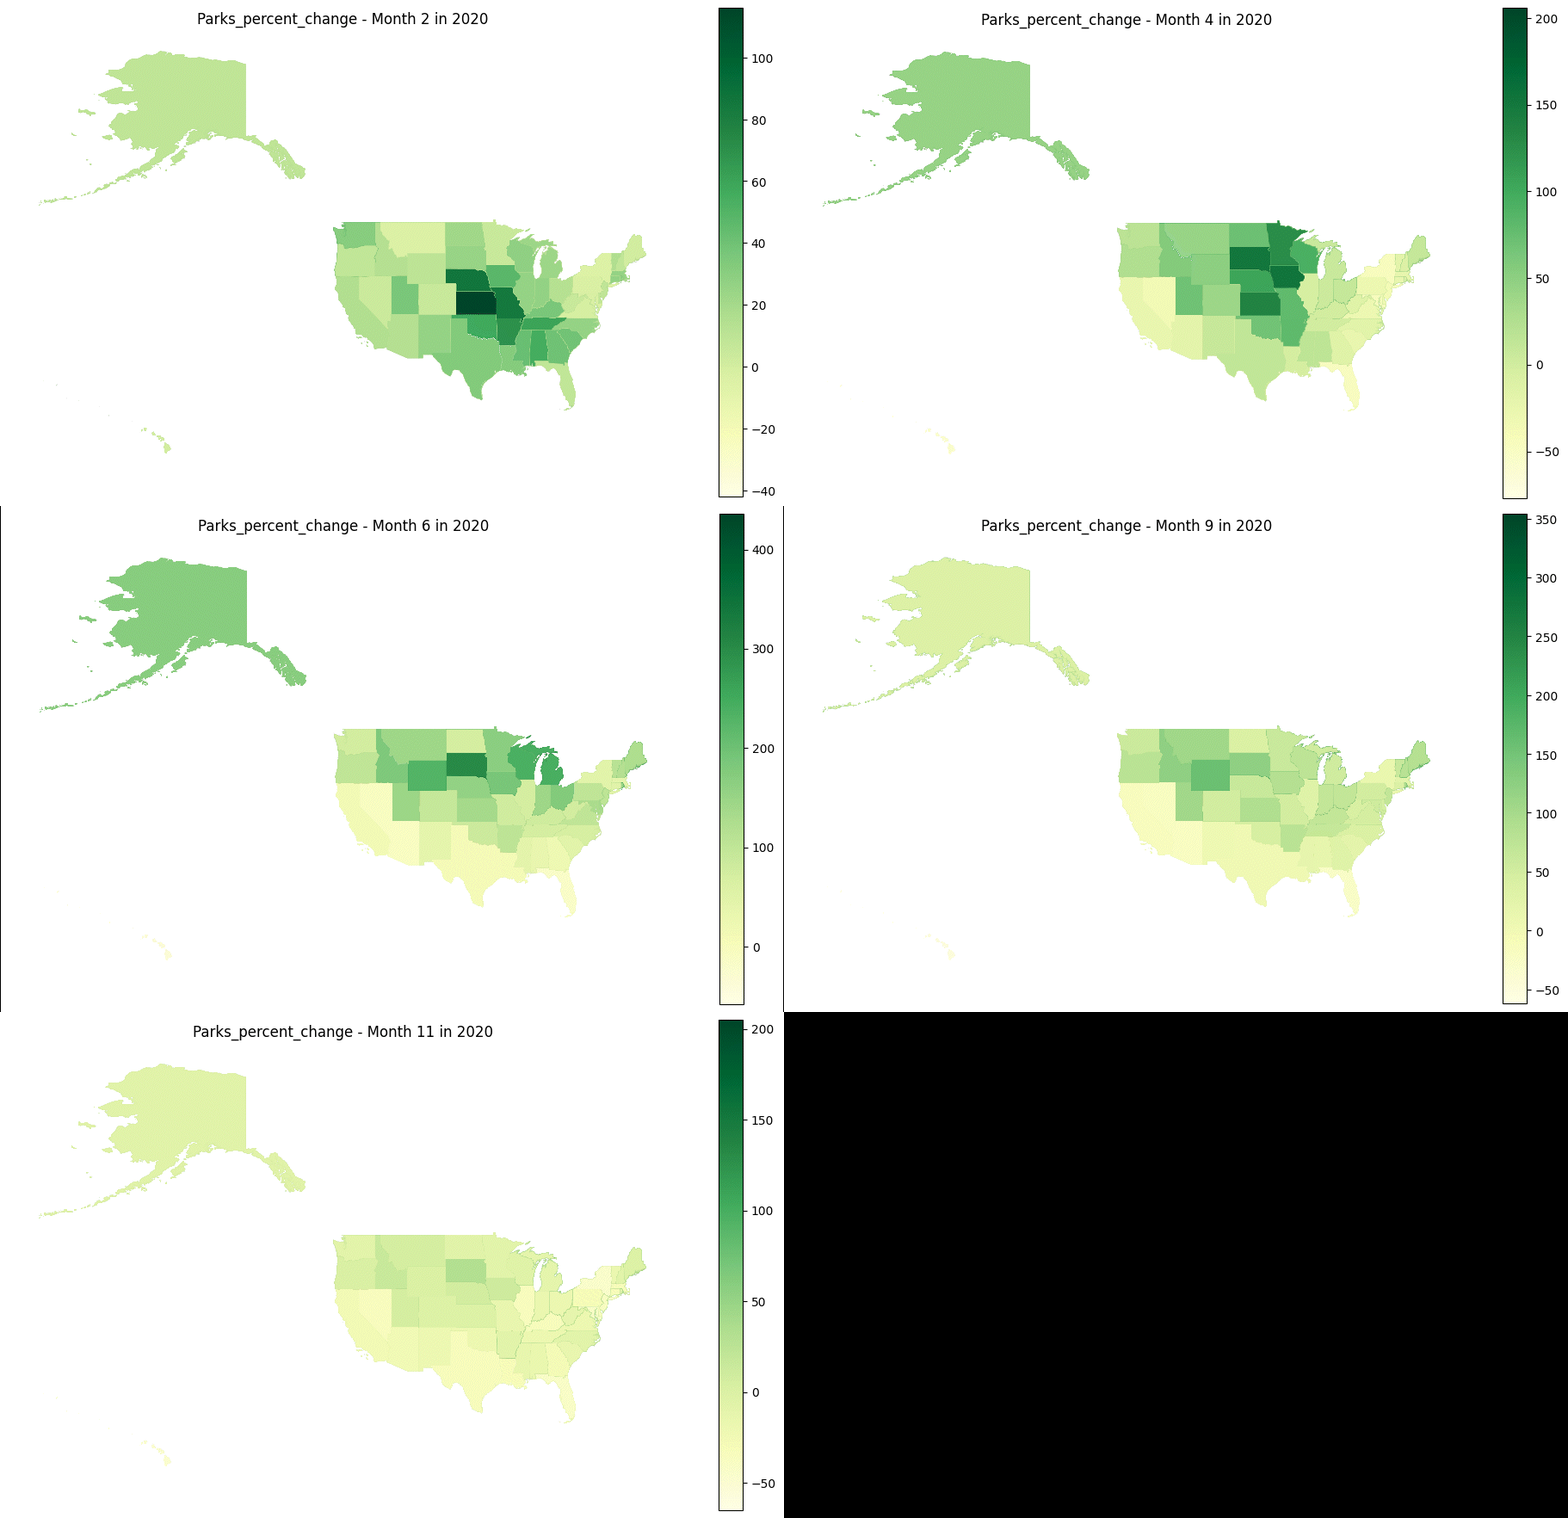
Continuing this analysis, we looked at the change in different categories across the years. First, we looked at change in park time use in 2020 by months. Here, we can see that park time use was mostly decreasing in the outer states with some slight to moderate increases in the central states. Interestingly, December seemed to have the greatest increase across the country.
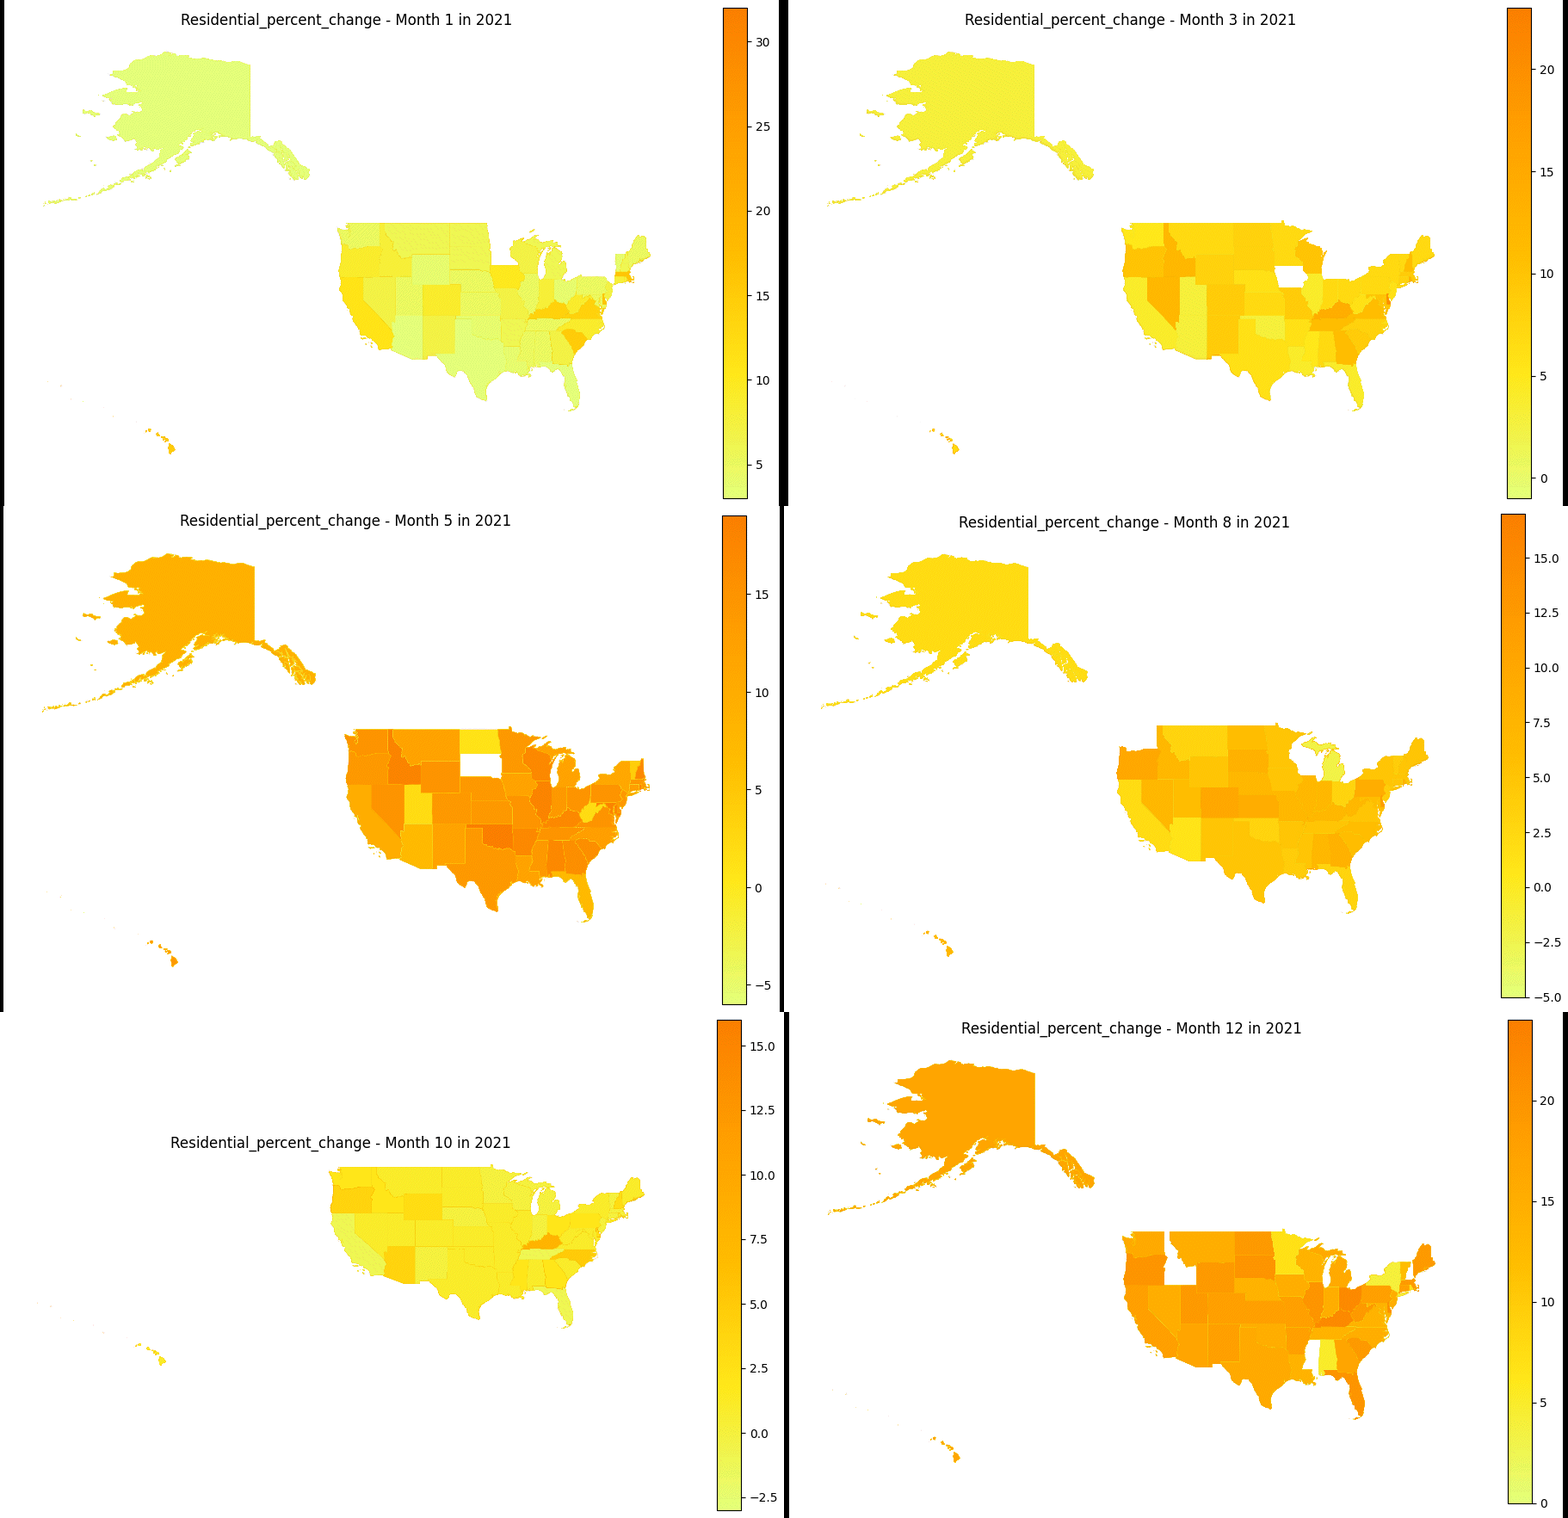
For 2021, we looked at change in residential time use. Throughout the year, we can see slight increases in residential time use throughout the country, ending in December with a moderate increase across most states.
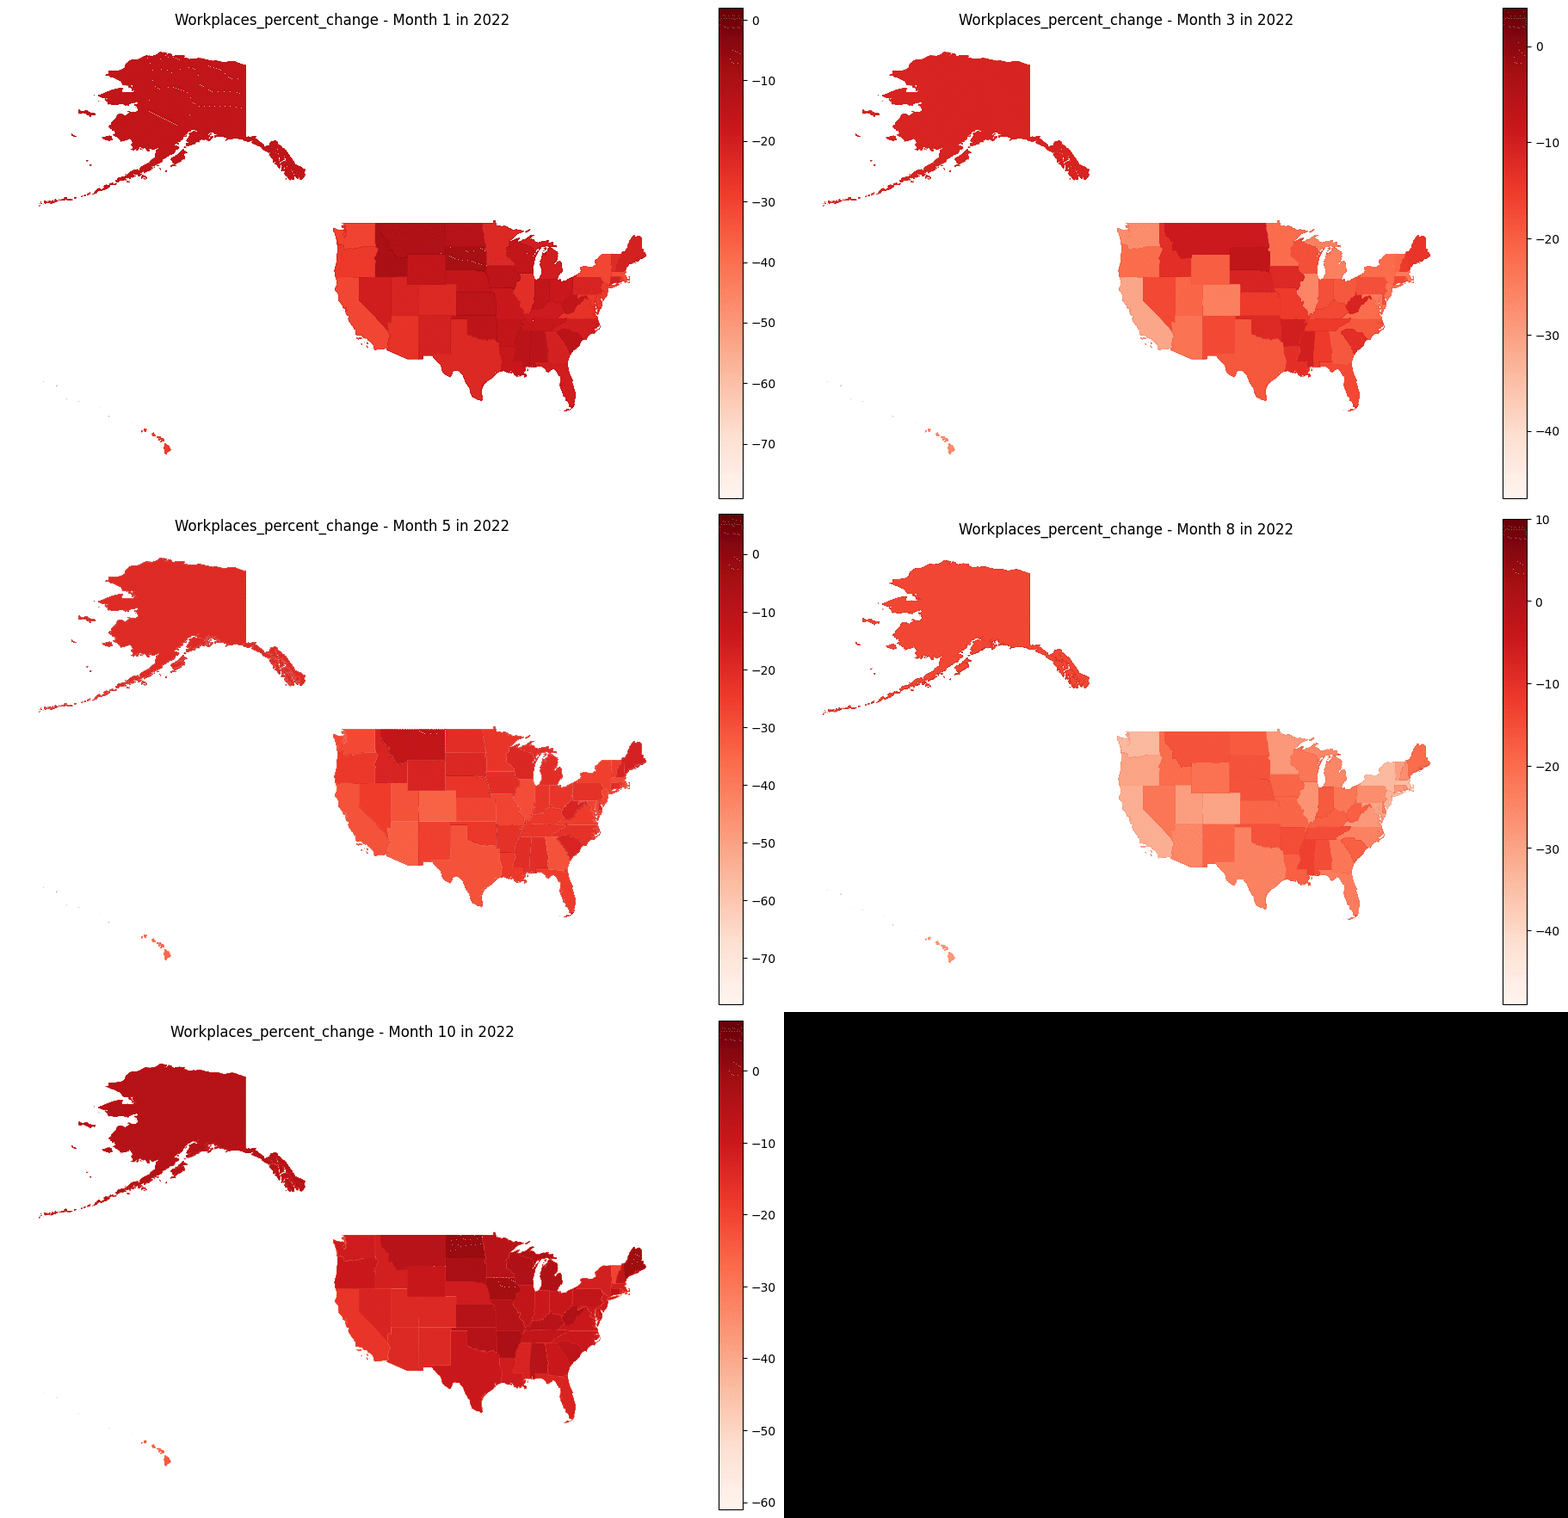
Finally, in 2022 we looked at change in workplace time use for each month. For most months, the decrease hovered at around -10% to -20%. Some notable exceptions were in April, when it was around to 0% to -10% change and in June and August, where it was closer to -20% to -30%. In general, we saw that time use in workplaces was mostly decreased from the February 2020 baseline, and only sometimes saw slight increases.
CONCLUSIONS
The study and analysis of population’s time use is a unique way to investigate patterns of social life, work-life balance, family, gender, and well-being, among other things. It allows us to understand how people employs their most valuable and finite resource: time.
After the analysis of the Community Mobility Reports, we can conclude that the US residents was impacted by the COVID-19 pandemic.
We can infer that after the 2020 confinement, the idea of spending more time outside became more attractive, so once the regulations were lifted, people decided to spend less time inside of their homes and more time in parks or doing recreational activities.
We also saw the relationship between certain activities, like changes in time use of most activities were inversely proportional to residential time use. We also saw how people spend their time during important holidays: often prioritizing spending time in parks or at home, and prioritizing shopping before holidays. Seasonal trends can help us understand how people like to spend their time depending on the weather. Finally, we saw that transit and workplace time use had the most decreases, sustaining them throughout 2022. This validates the idea that the pandemic impacted work for many Americans, perhaps by allowing them to work from home due to new workplace rules, or, for example, at times forcing them at home due to job loss or inability to go into work for health reasons.
Is because of these changes of behavior that the analysis of time use and mobility is important in the field of urbanism. Analyzing time-use data allows planners to create a connection between human behavior and urban functionality, helping us understand resident needs and habits. By leveraging this information, planners can ensure that cities are designed to serve the facilitate residents as they go about their days, and can even help predict where people spend their time in unprecedented, emergency situations, like a pandemic.
REFERENCES
CDC Museum COVID-19 timeline. (2023, March 15). Centers for Disease Control and Prevention. https://www.cdc.gov/museum/timeline/covid19.html
Google LLC. (n.d.-a). COVID-19 Community Mobility report. Google.com. https://www.google.com/covid19/mobility/
Google LLC. (n.d.-b). Overview. Community Mobility Reports Help. https://support.google.com/covid19-mobility/answer/9824897?hl=en&ref_topic=9822927
Google LLC. (n.d.-c). Understand the data. Community Mobility Reports Help. https://support.google.com/covid19-mobility/answer/9825414?hl=en&ref_topic=9822927

