
Project Aim
In this project we aim to predict the type of vehicle crash that can be foreseen in the city of New York based on the traffic volume, using Graph Neural Networks (GNNs).
To develop this machine learning model we use 3 different datasets.
- The traffic signals extracted from OpenSteetMaps which includes data for highway elements.
- Traffic volume from the New York State website within the Department of Transportation.
- Vehicle collisions/crash events from the NYC Open Data Website within the Serious Injury Response, Tracking & Analysis Program (SIRTA).
The model could hold potential if developed further, to be used by emergency service lines in order to foresee areas which have high or dangerous crash risks, and more precautionary strategies could be implemented in those areas, achieving a better city planning service due to the high density of New York City.
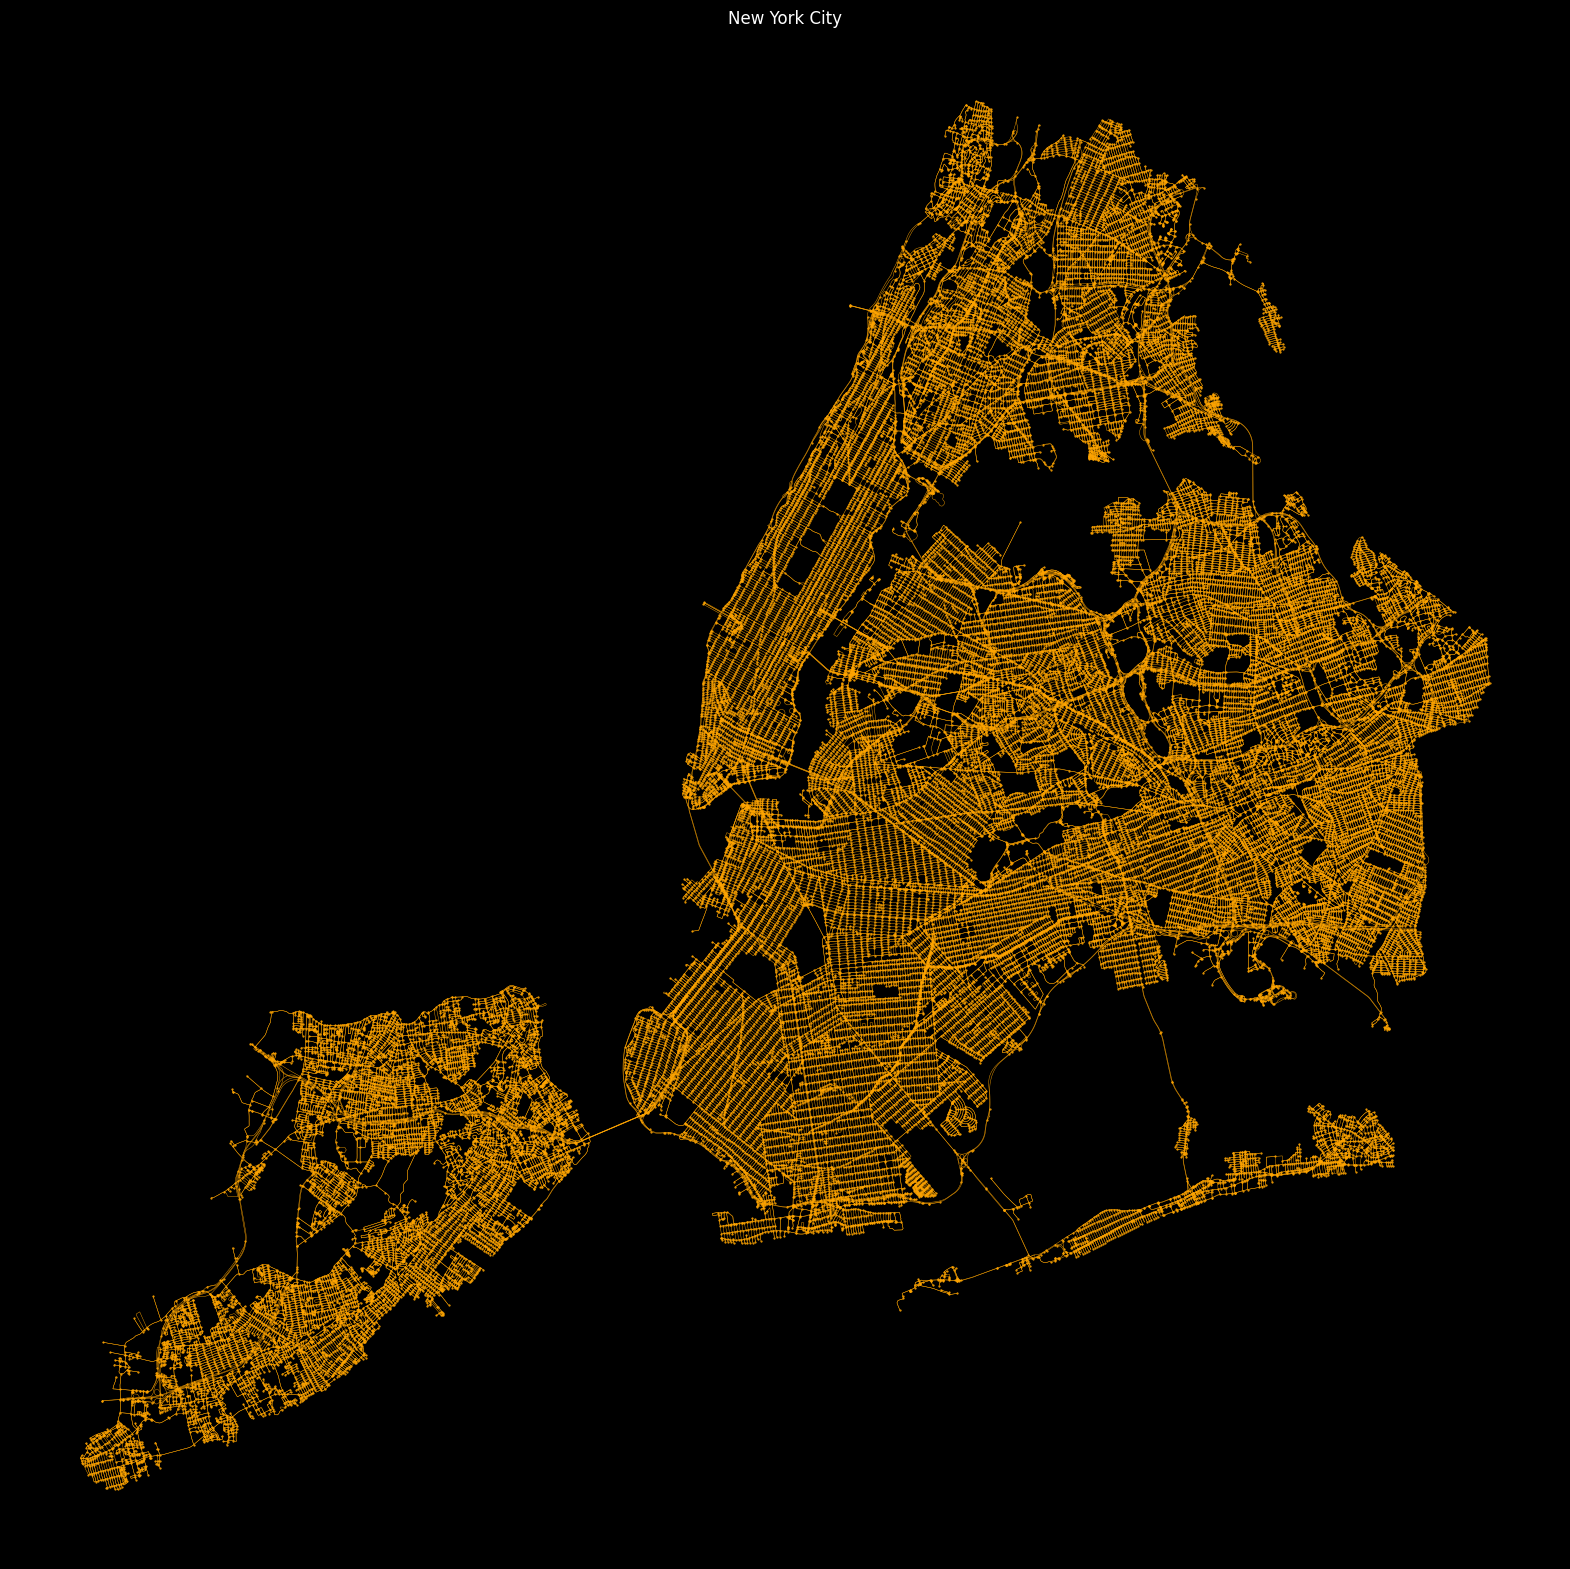
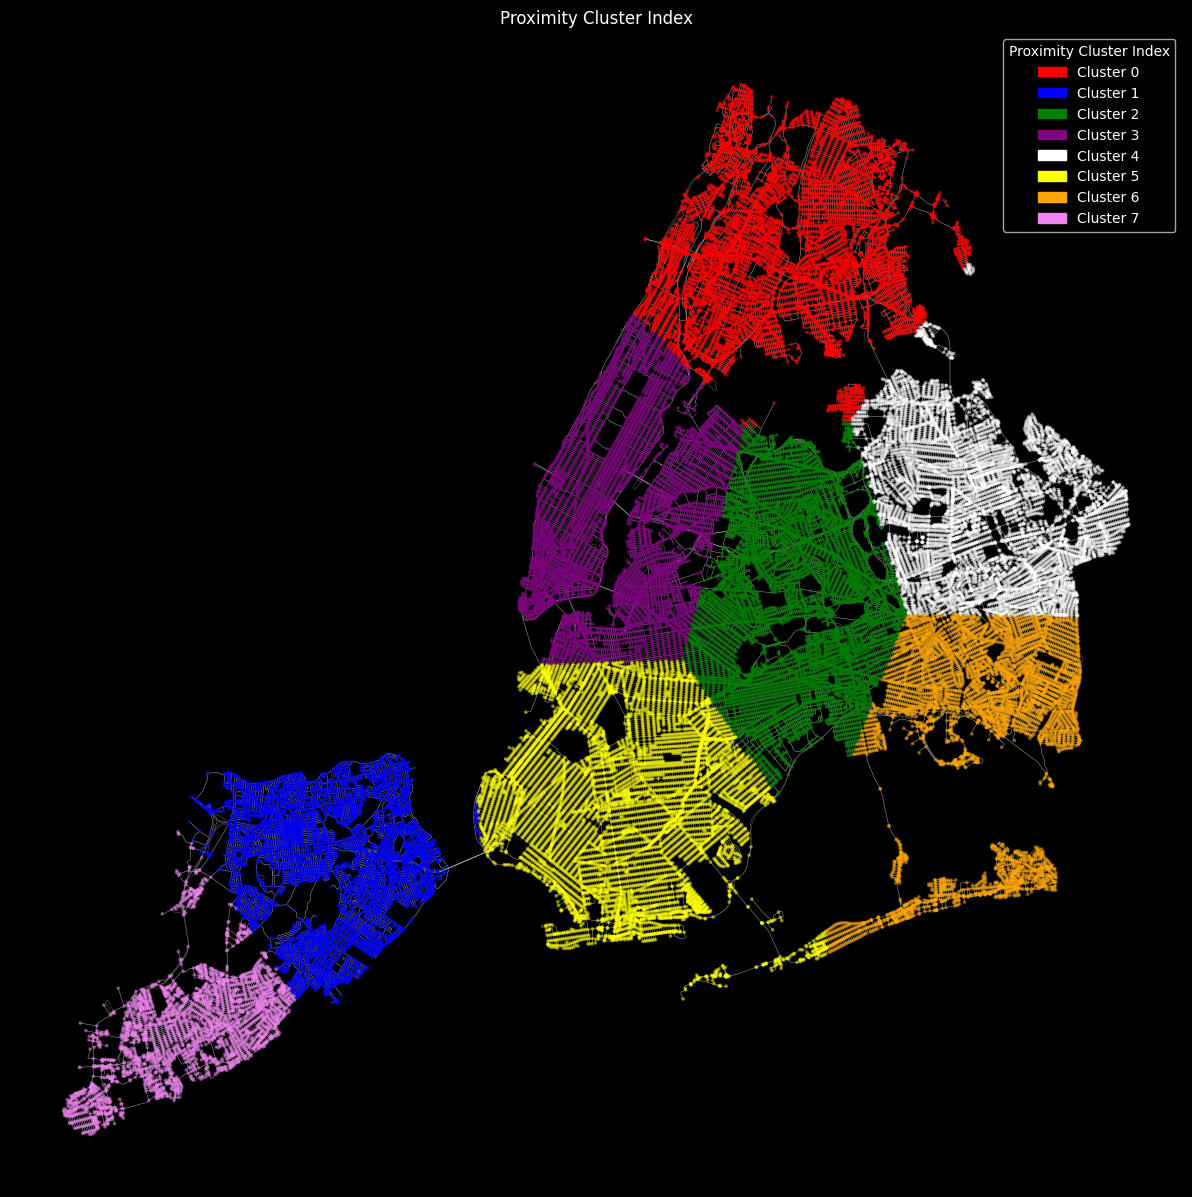
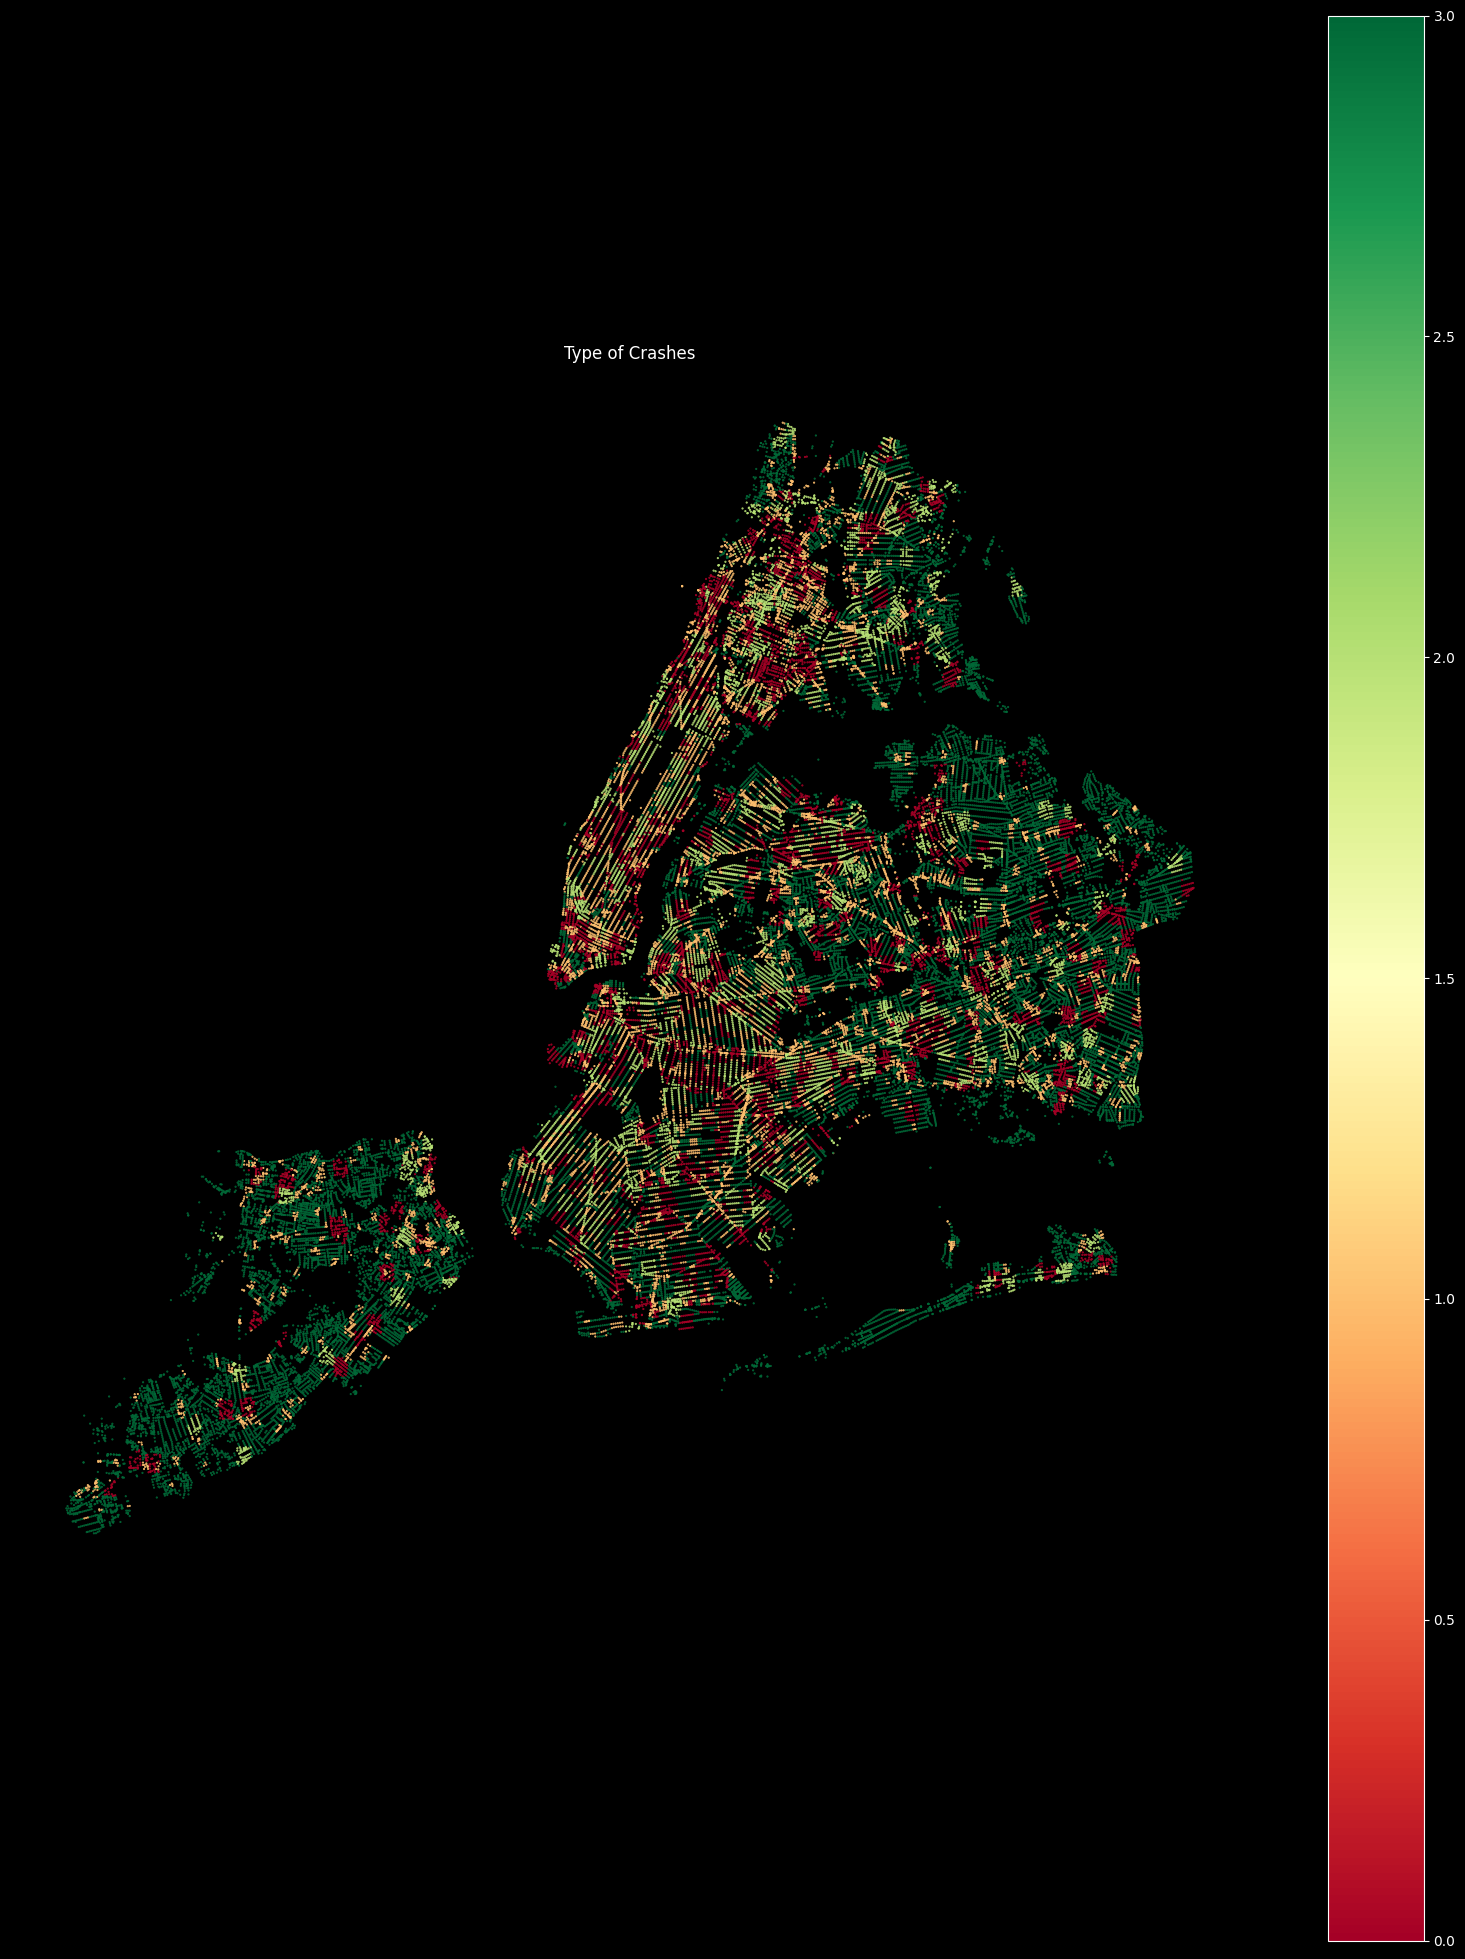
Street network of New York City with edges and nodes.
Features
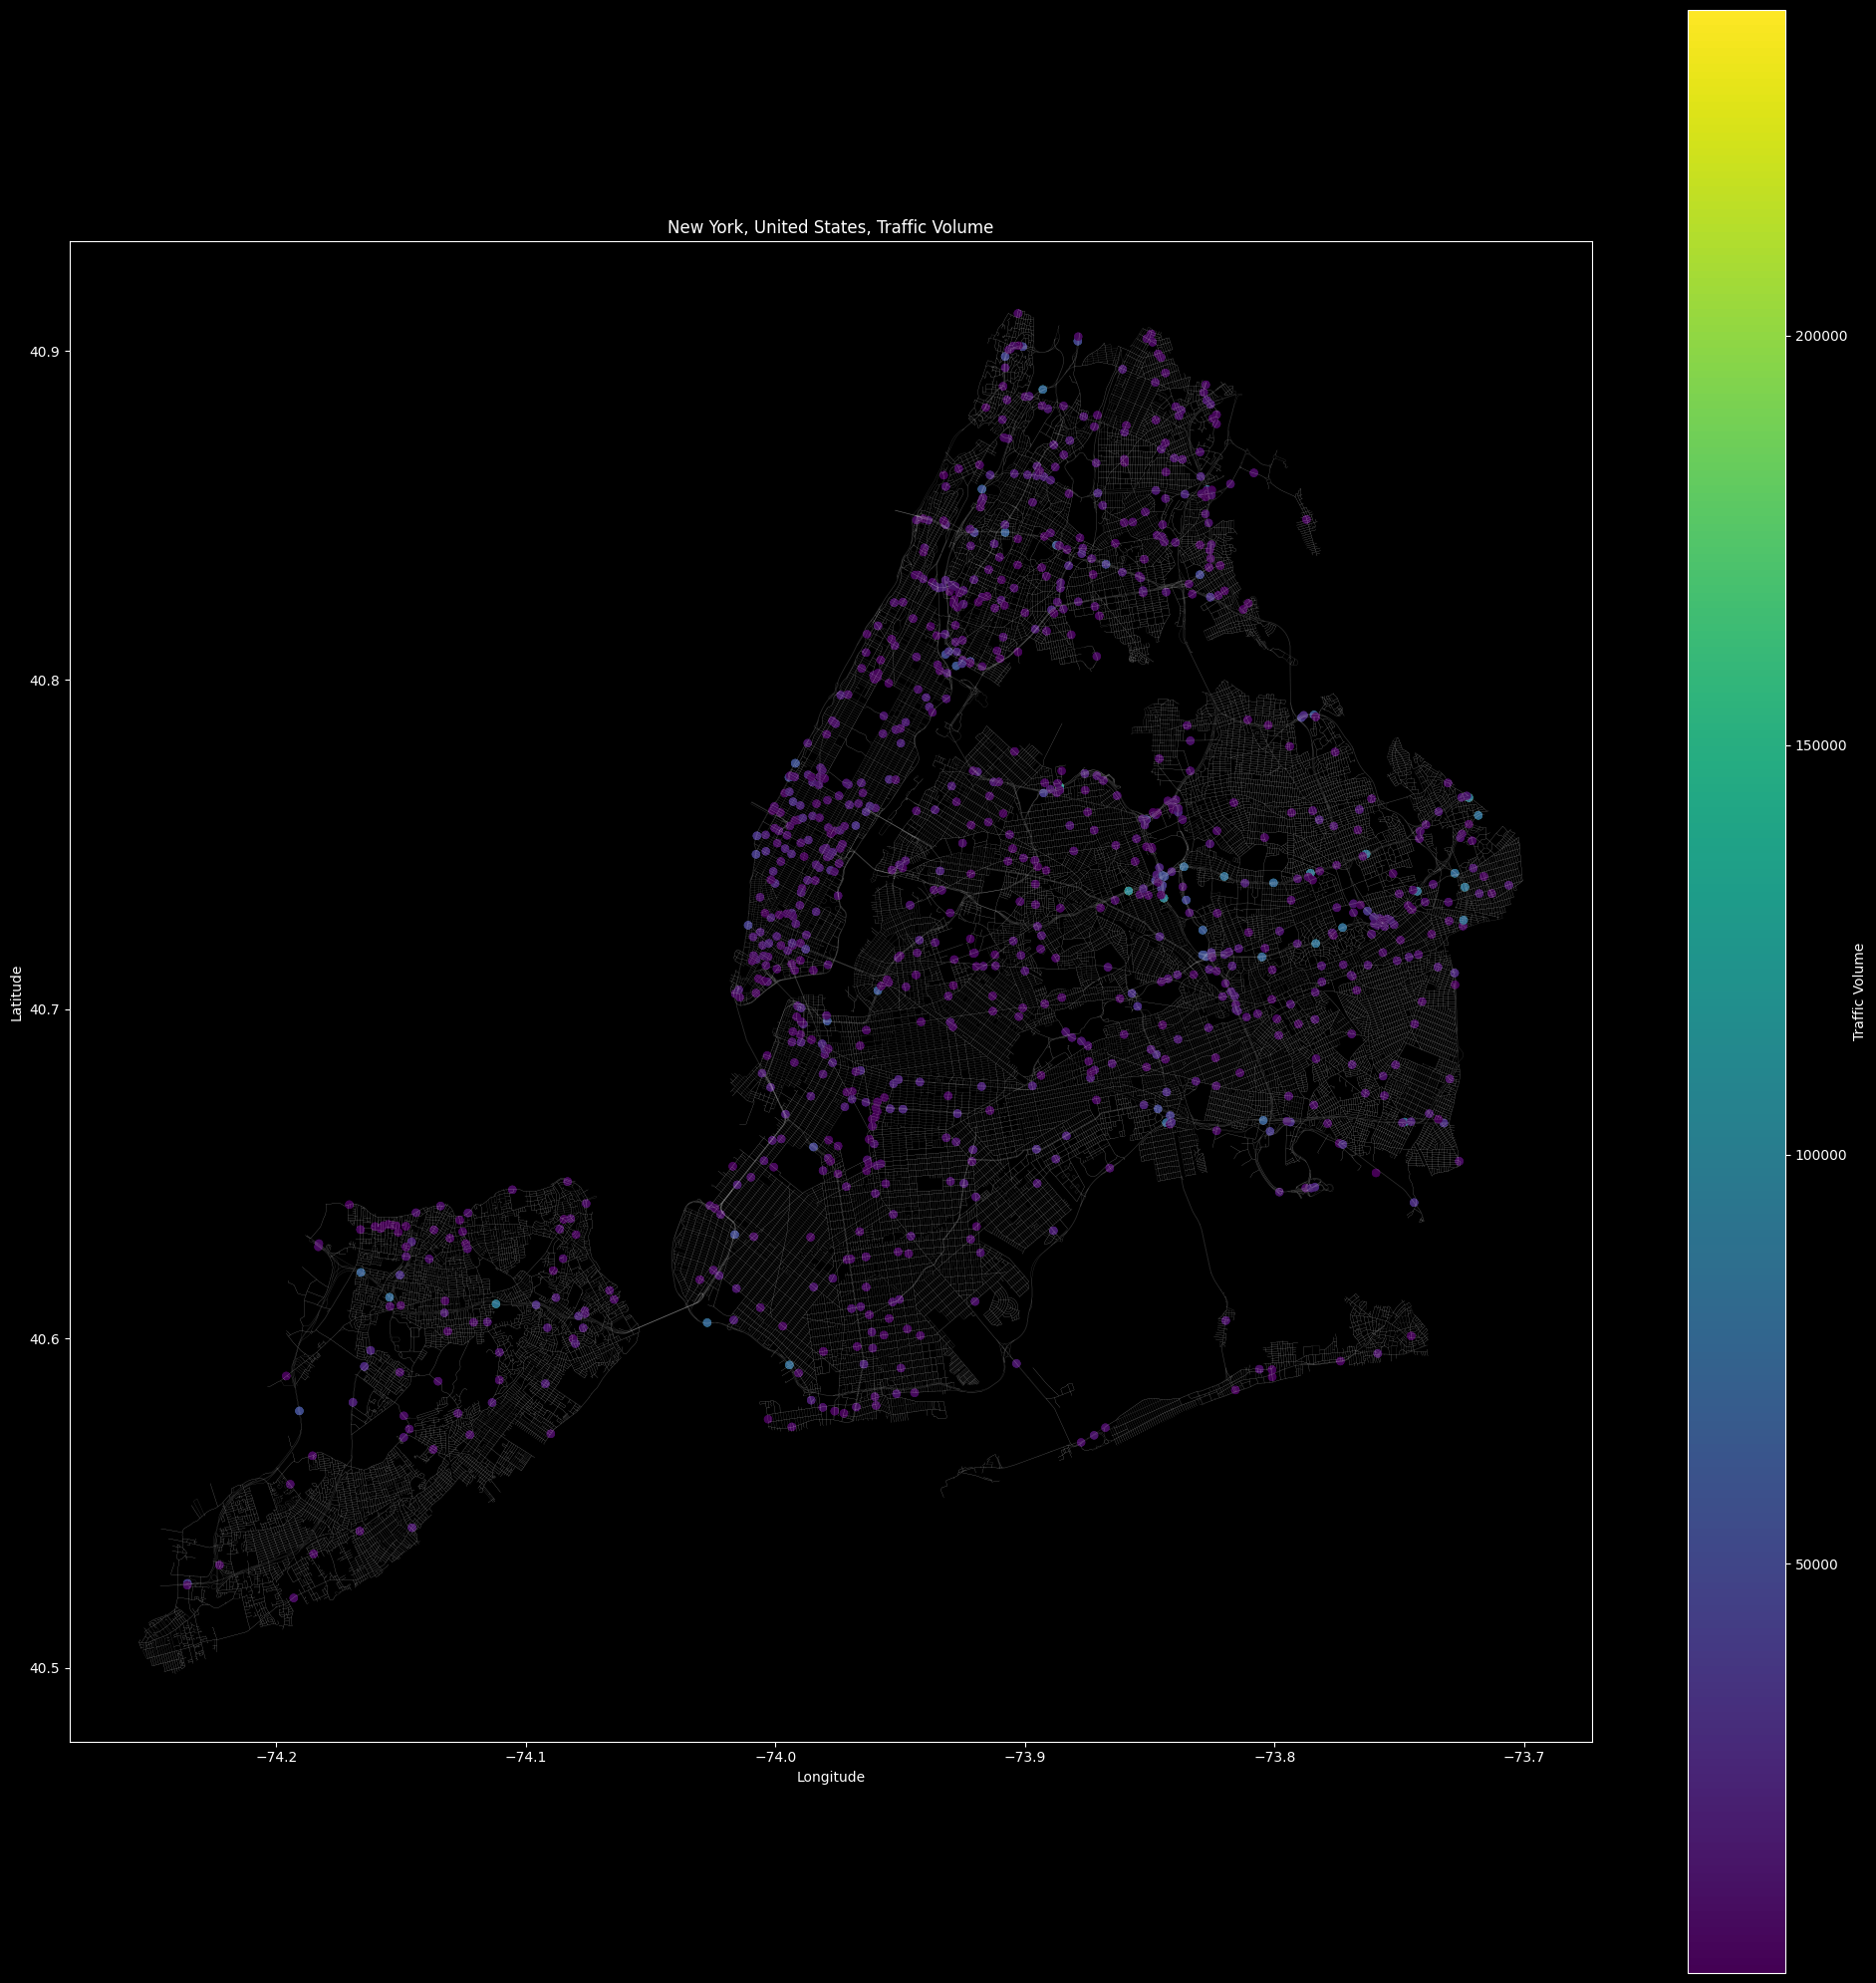
The 4 features included Traffic Signals/Intersections, Low Traffic, Medium Traffic, and High Traffic. To assign the traffic volume data to our nodes, after retrieving the max and min traffic density areas within a weekday, we re-organised the data into medium and high thresholds with quantiles. The Traffic Density is then categorized based on the high, medium, and low thresholds and assigned to the nearest nodes.
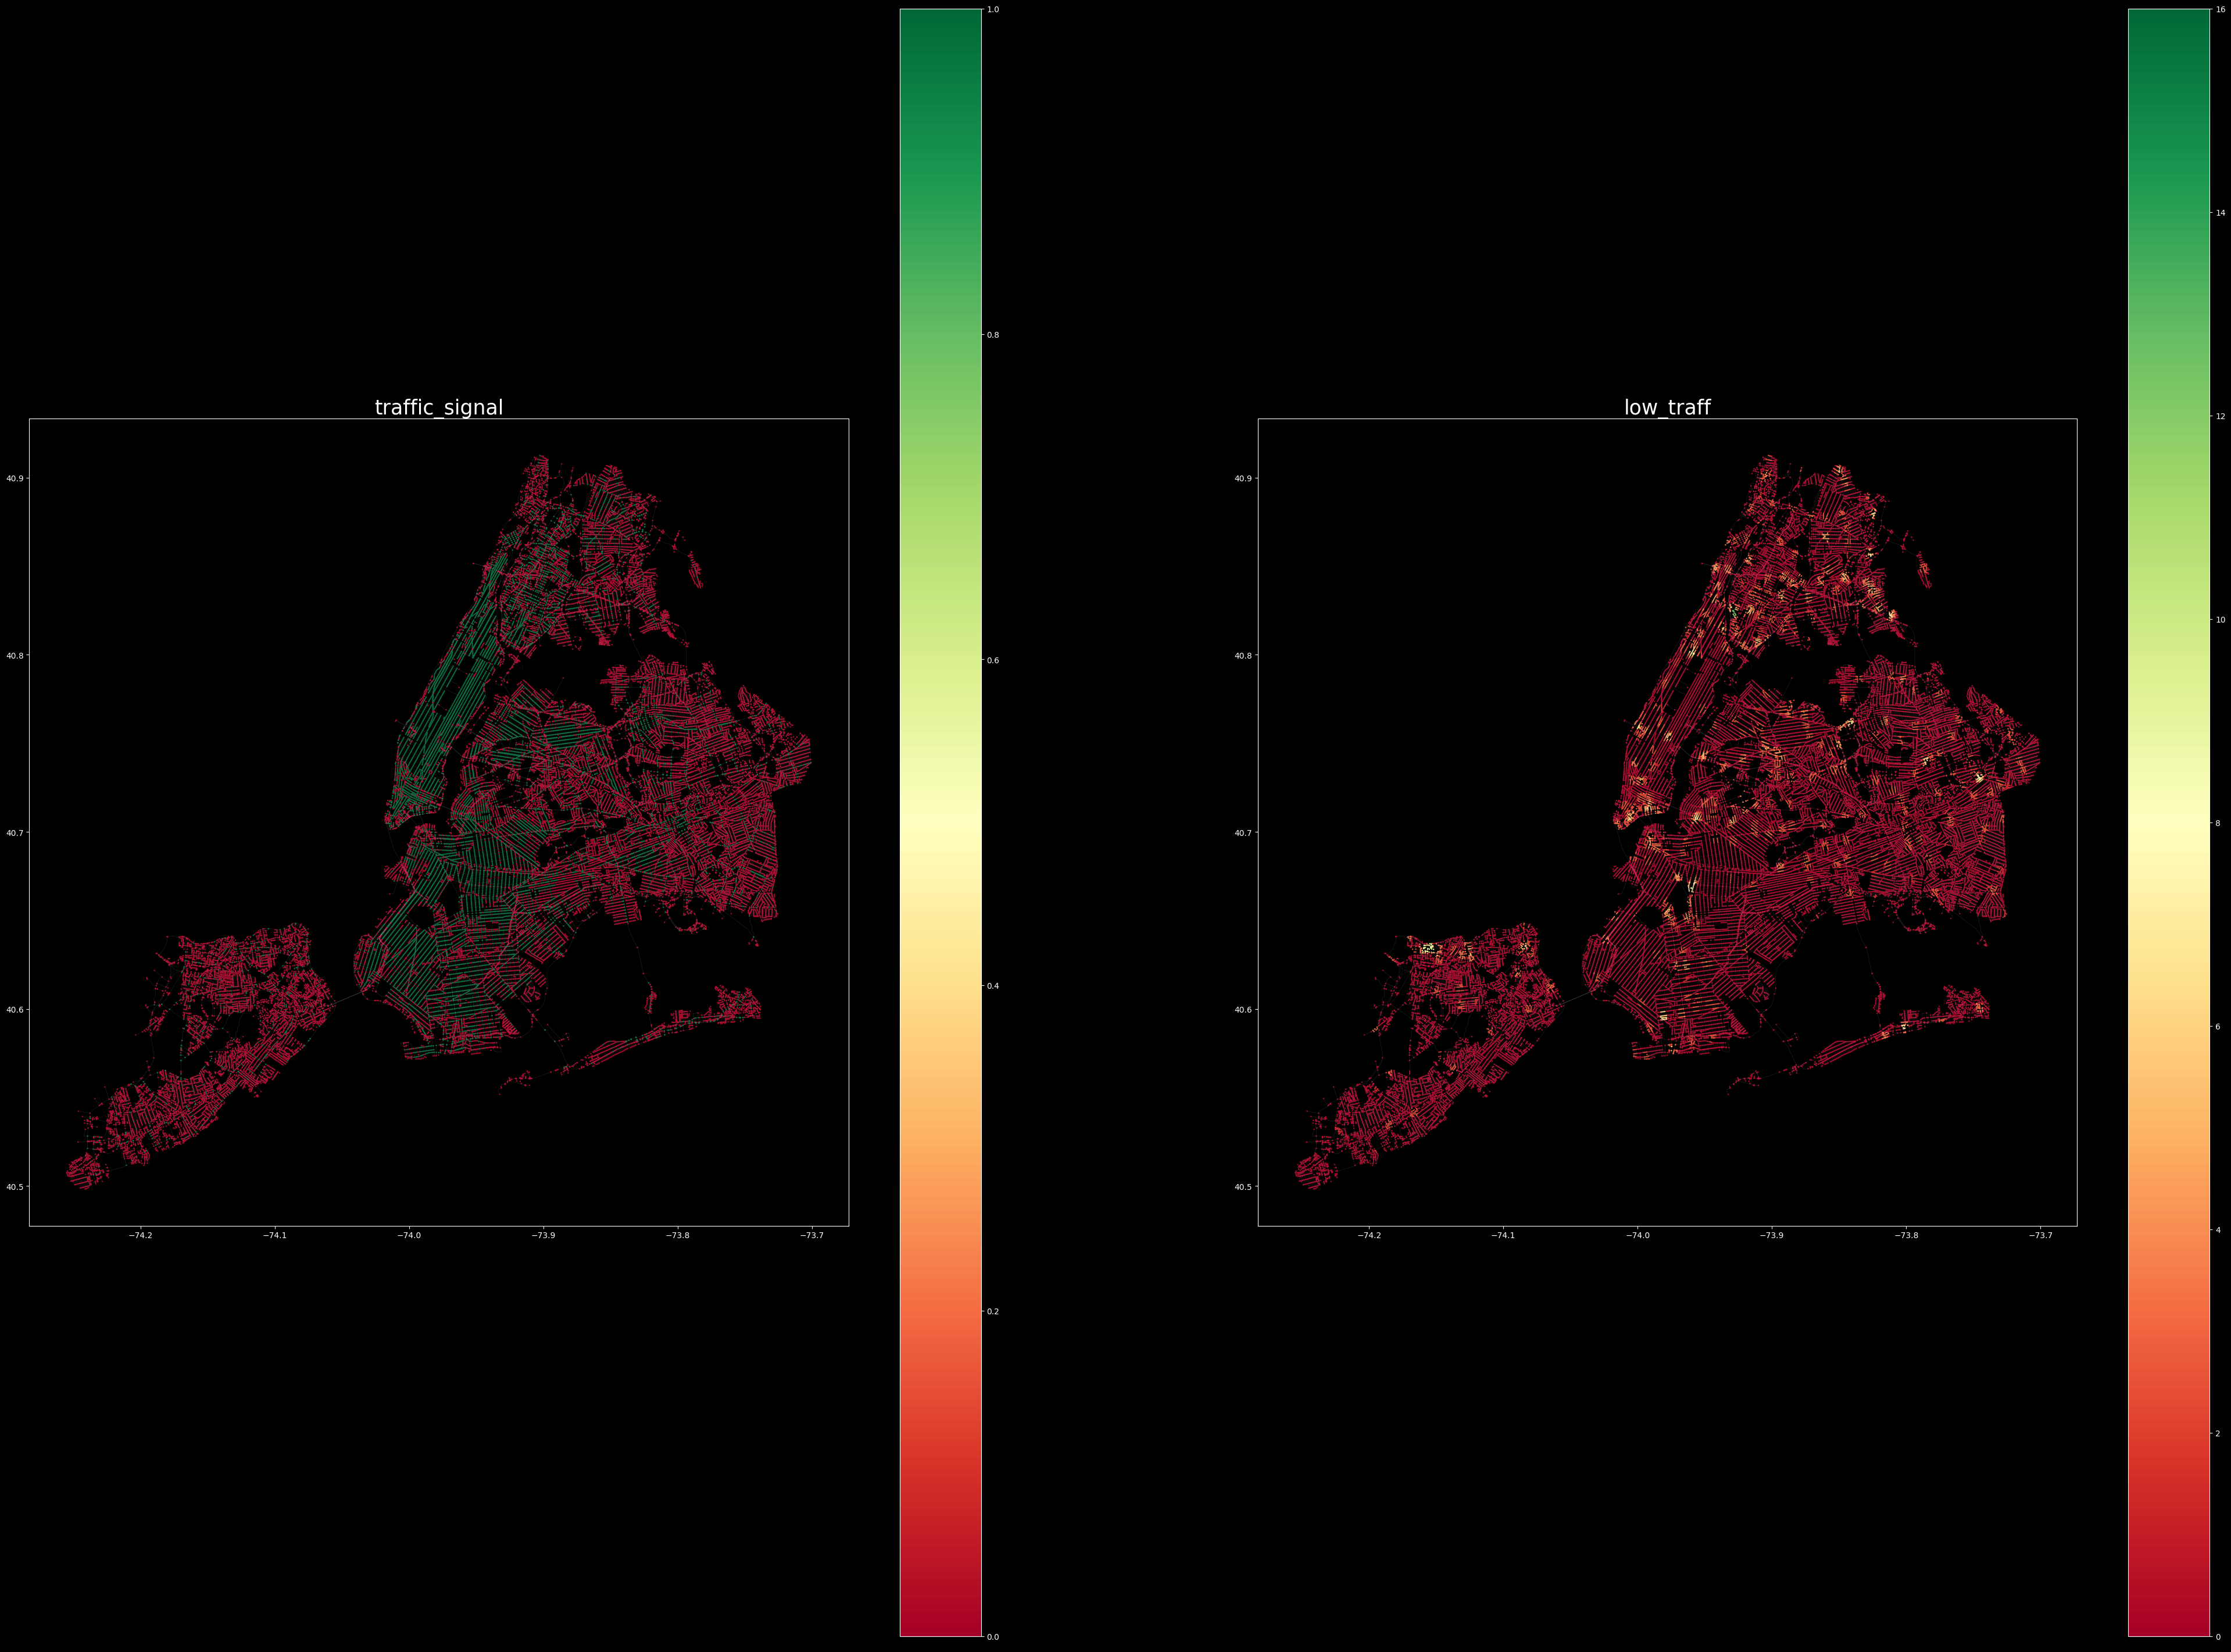
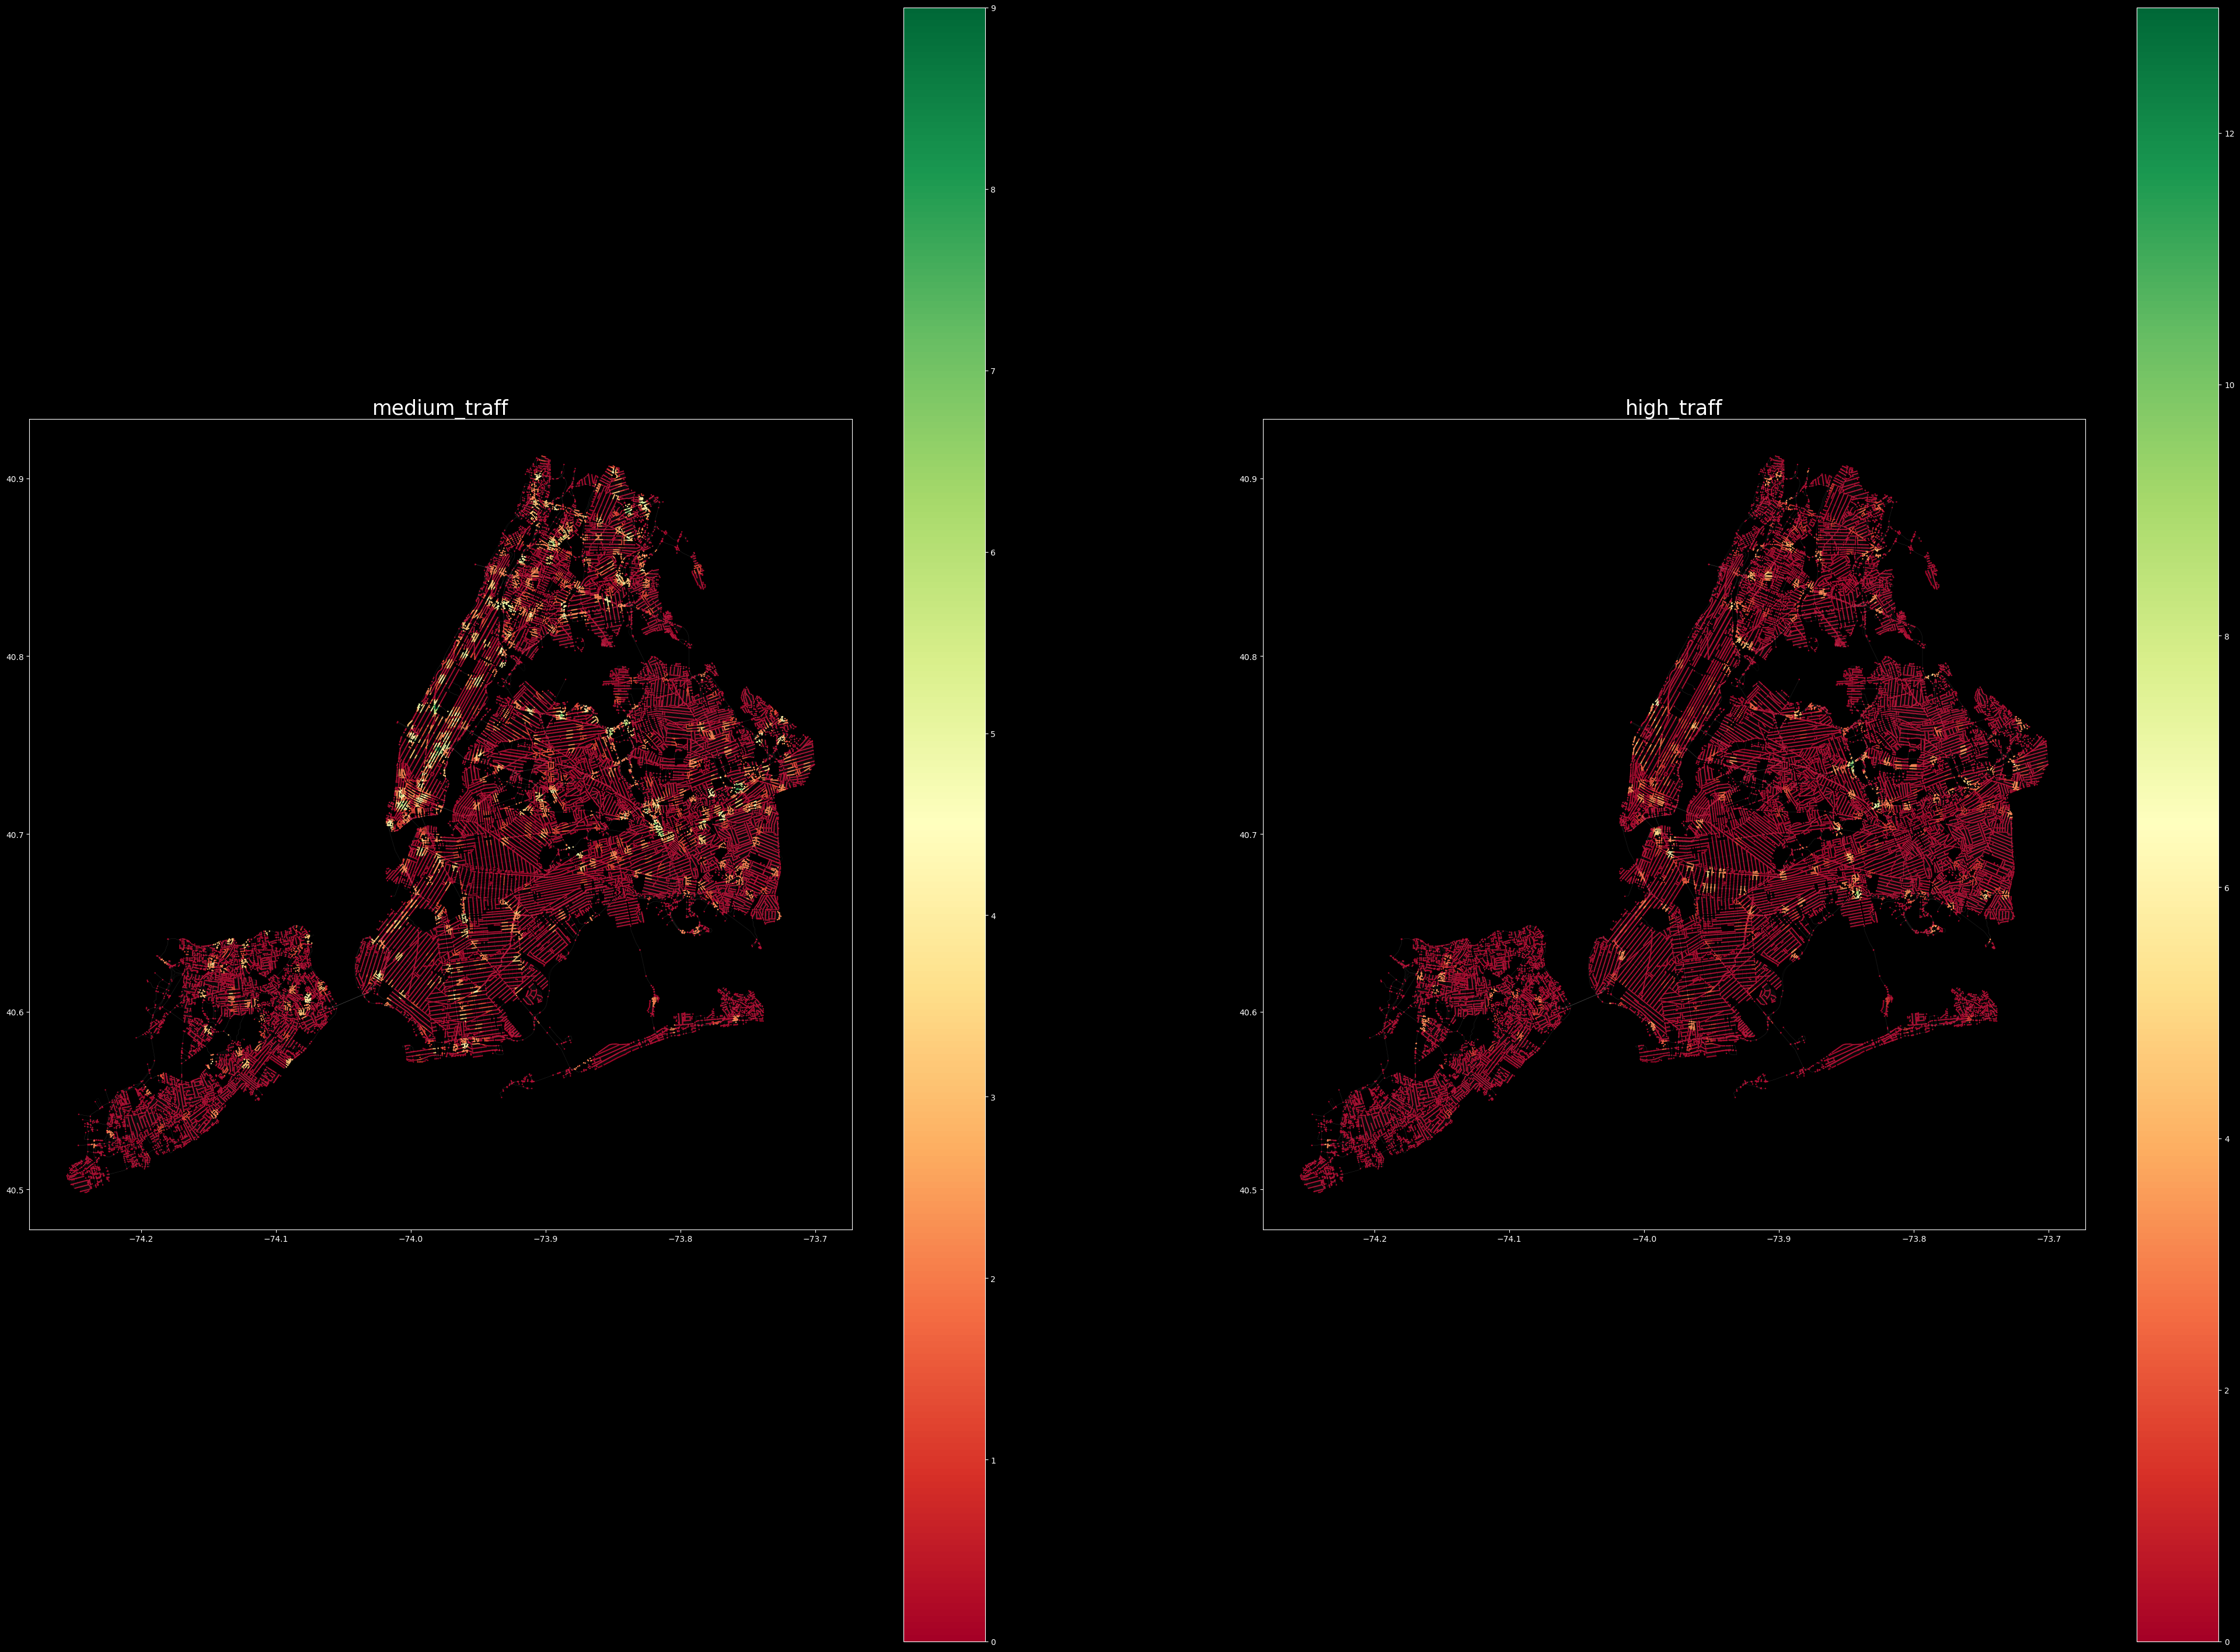
We then cluster the nodes with K-means clustering in order to separate areas which have higher traffic volumes and also less traffic signals and vice versa.
Classification
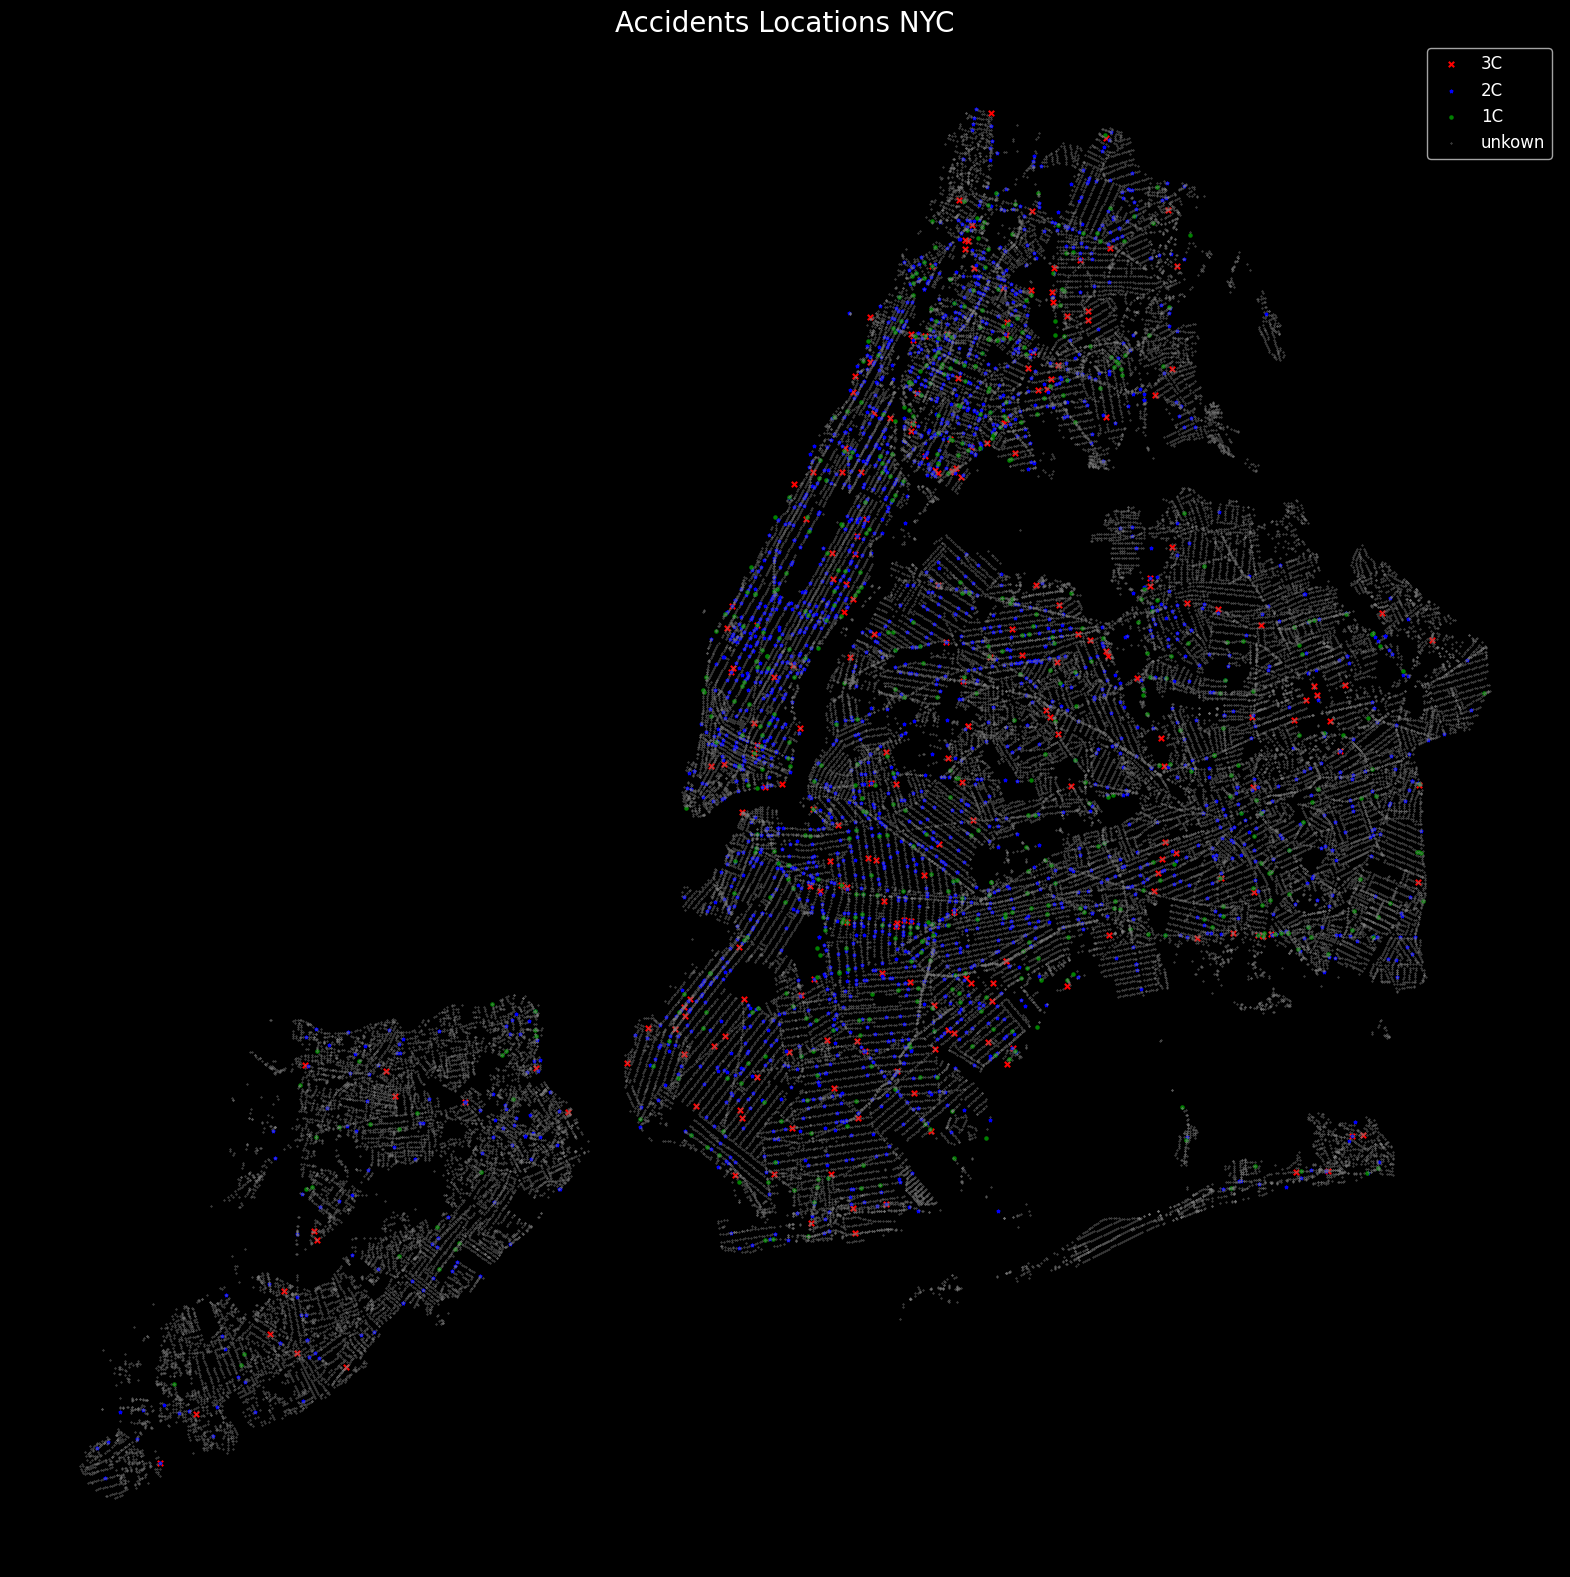
For the crashes we used a dataset from data.cityofnewyork.us which is serious vehicular crashes that were analyzed and reported on as part of SIRTA. Our classification strategy used 3 columns from the dataset which were of 1. Total Non-Severe Injuries (TNS) 2. Total Severe Injuries (TS) and 3. Total Fatalities (TF).
We classified them TF (Total Fatalities) as 3C, TS (Total Severe) as 2C, and TNS (Total Non-Severe) as 1C and encoded so that if there are more than 0 occurrences within Total Fatalities then they are sorted into TF. The same logic was applied to TS and TNS. Due to the large data imbalance in between the classes we later on applied that if TS (Total-Severe) is more than 2 then it is classified as TF (Total-Fatalities).
We can see in the accident locations graph above that 2C – Total Severe – still held a large portion of the data.
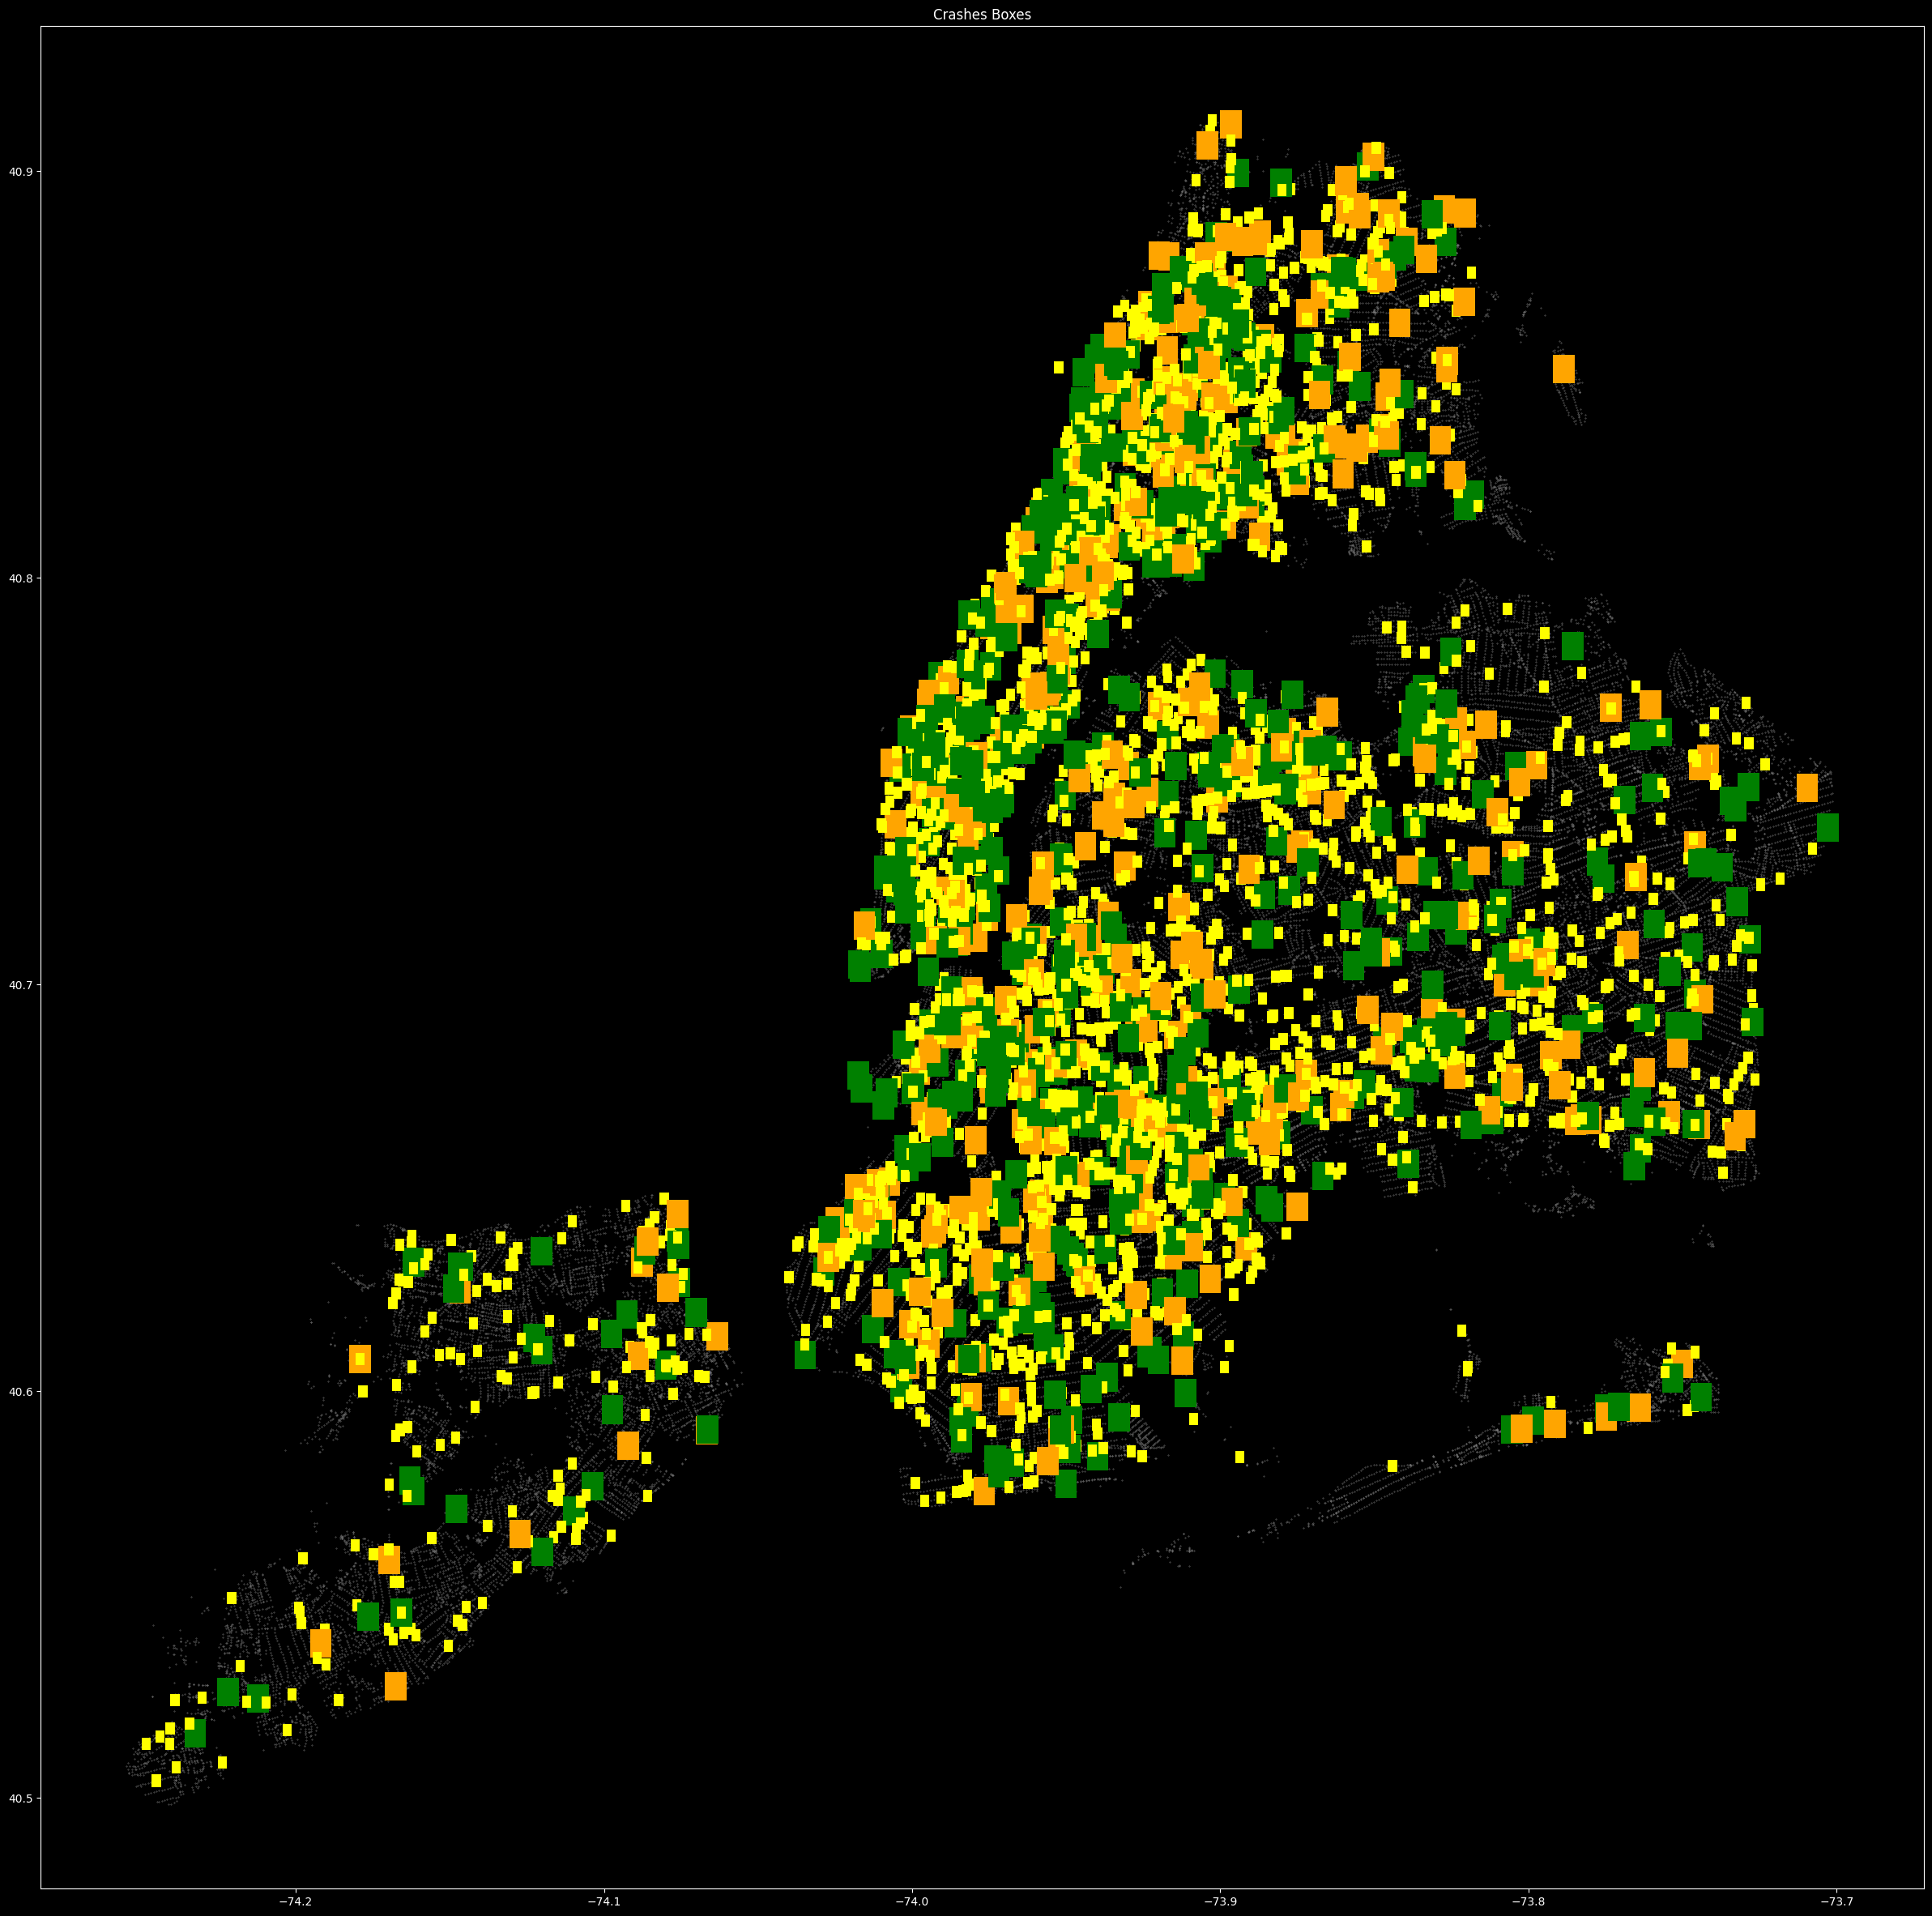
To combat the data imbalance and also to improve predictions we set bounding boxes around the geo points so a wider area of nodes can be applied to the classes 1C and 3C meanwhile keeping the bounding boxes for 2C smaller as they were more than the other two classes to begin with.
We then plot the classes again with the graph and can see that the classes which were less now have wider applicable area.
Training
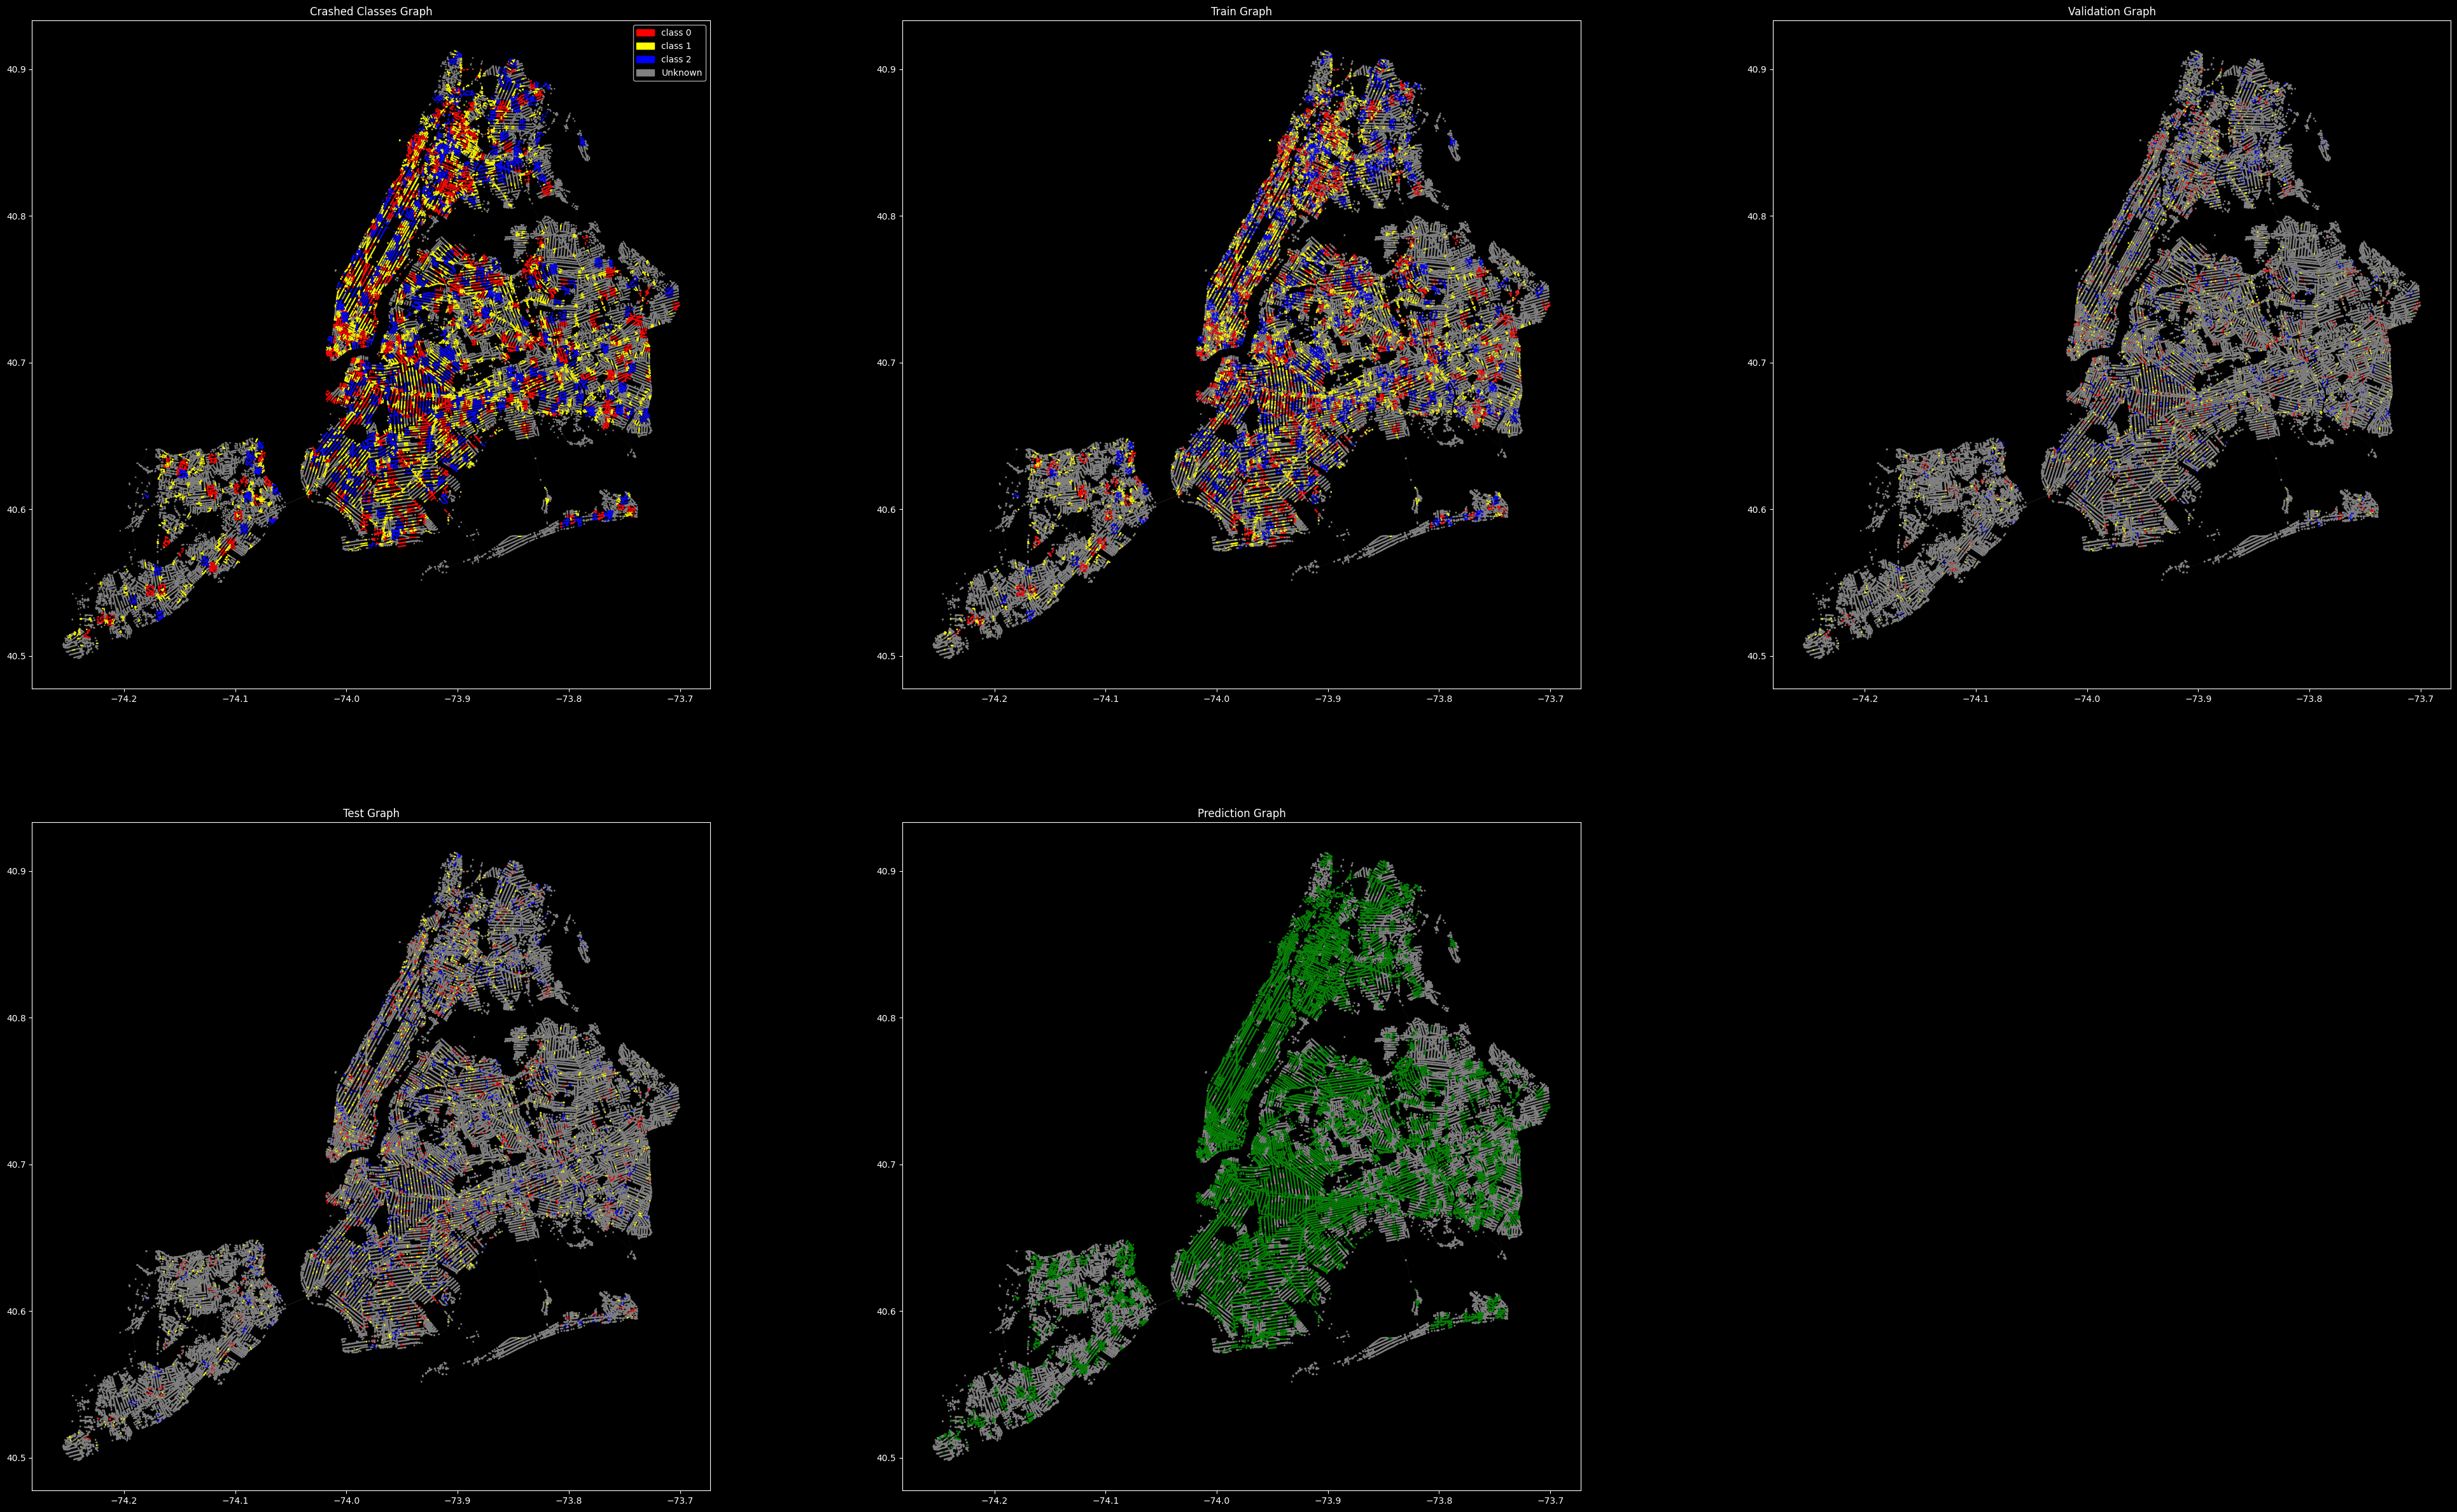
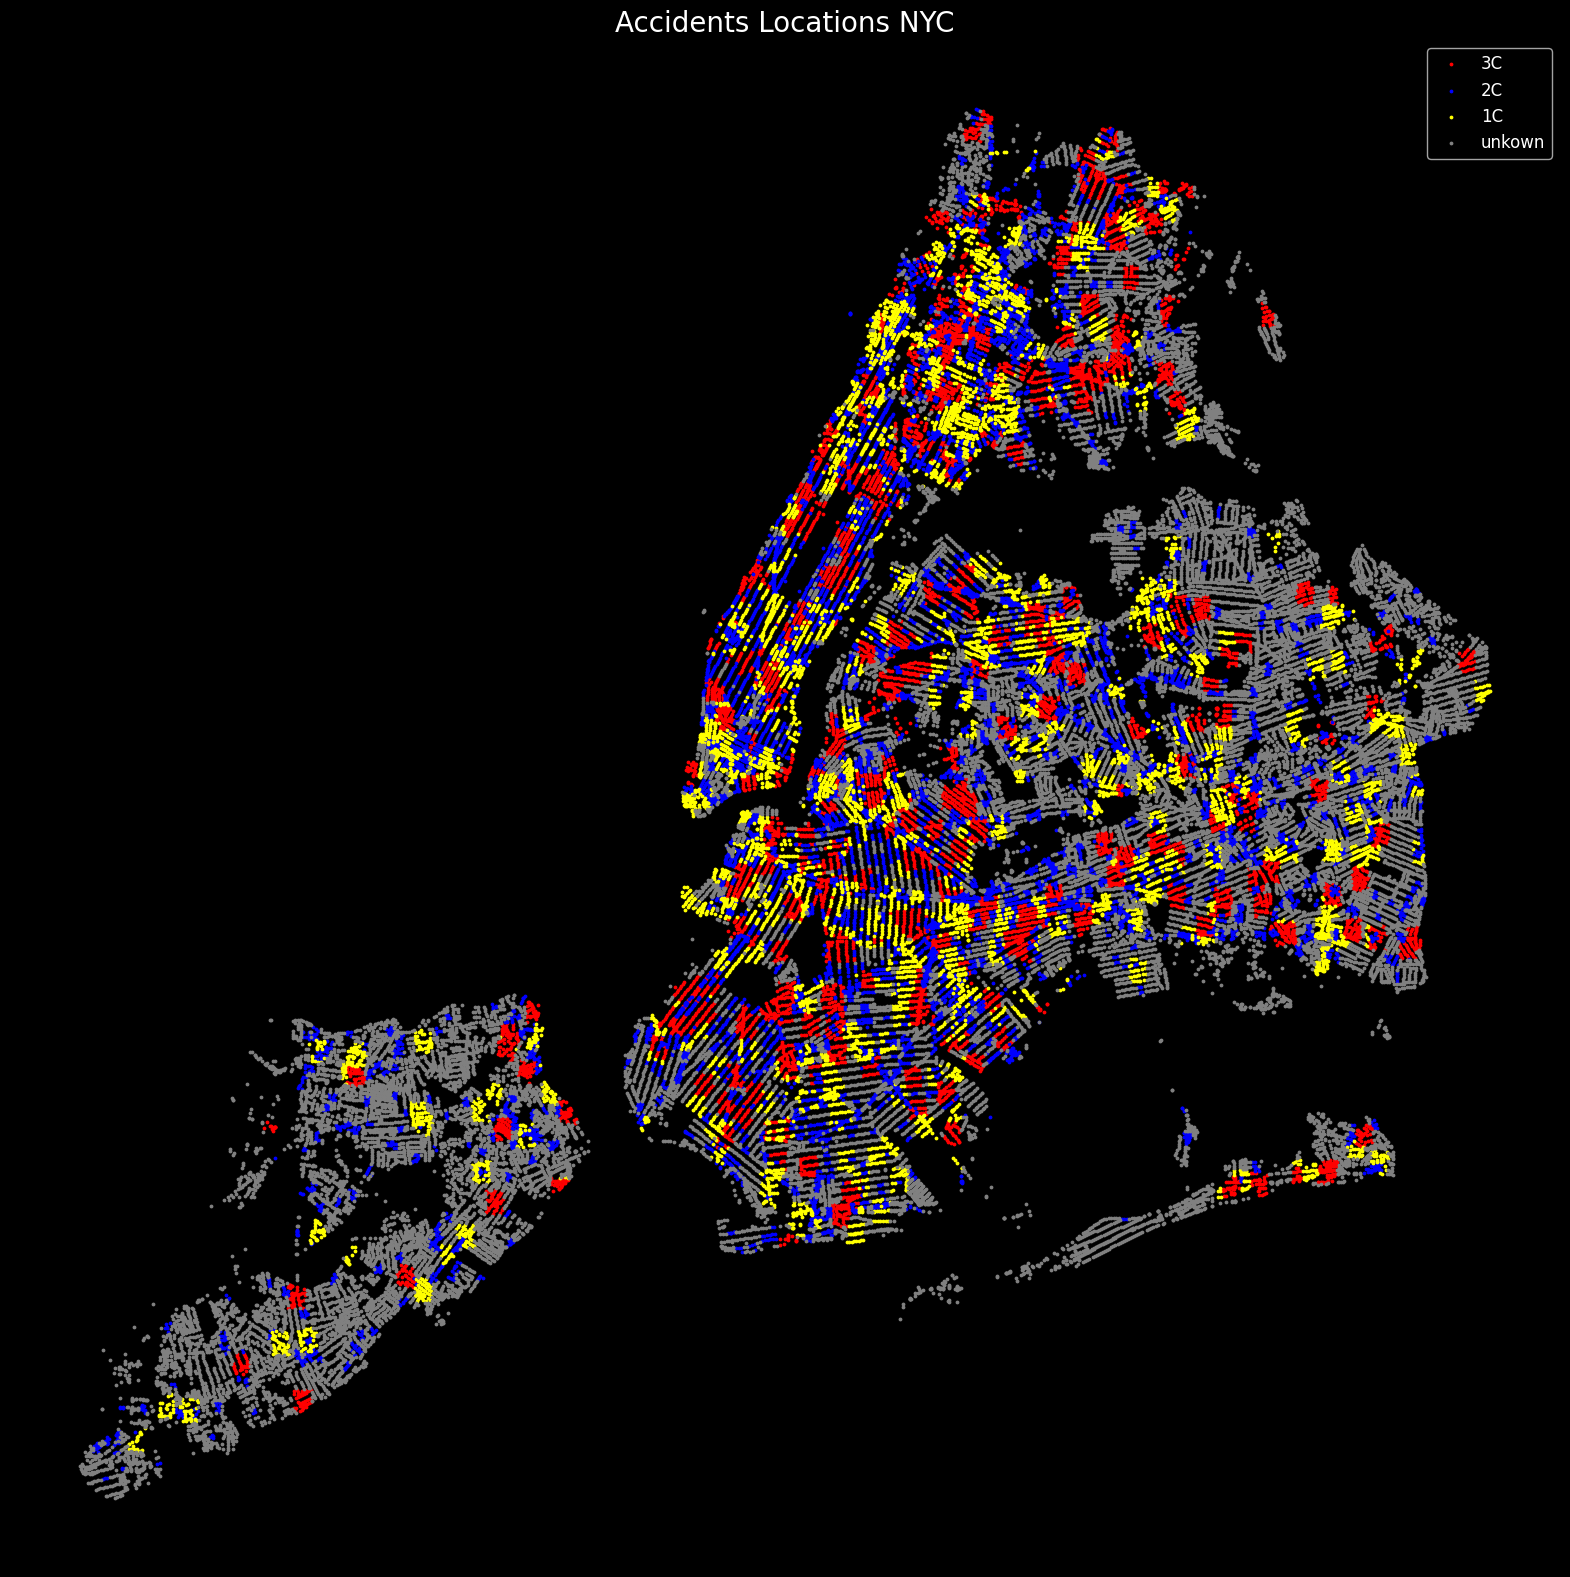
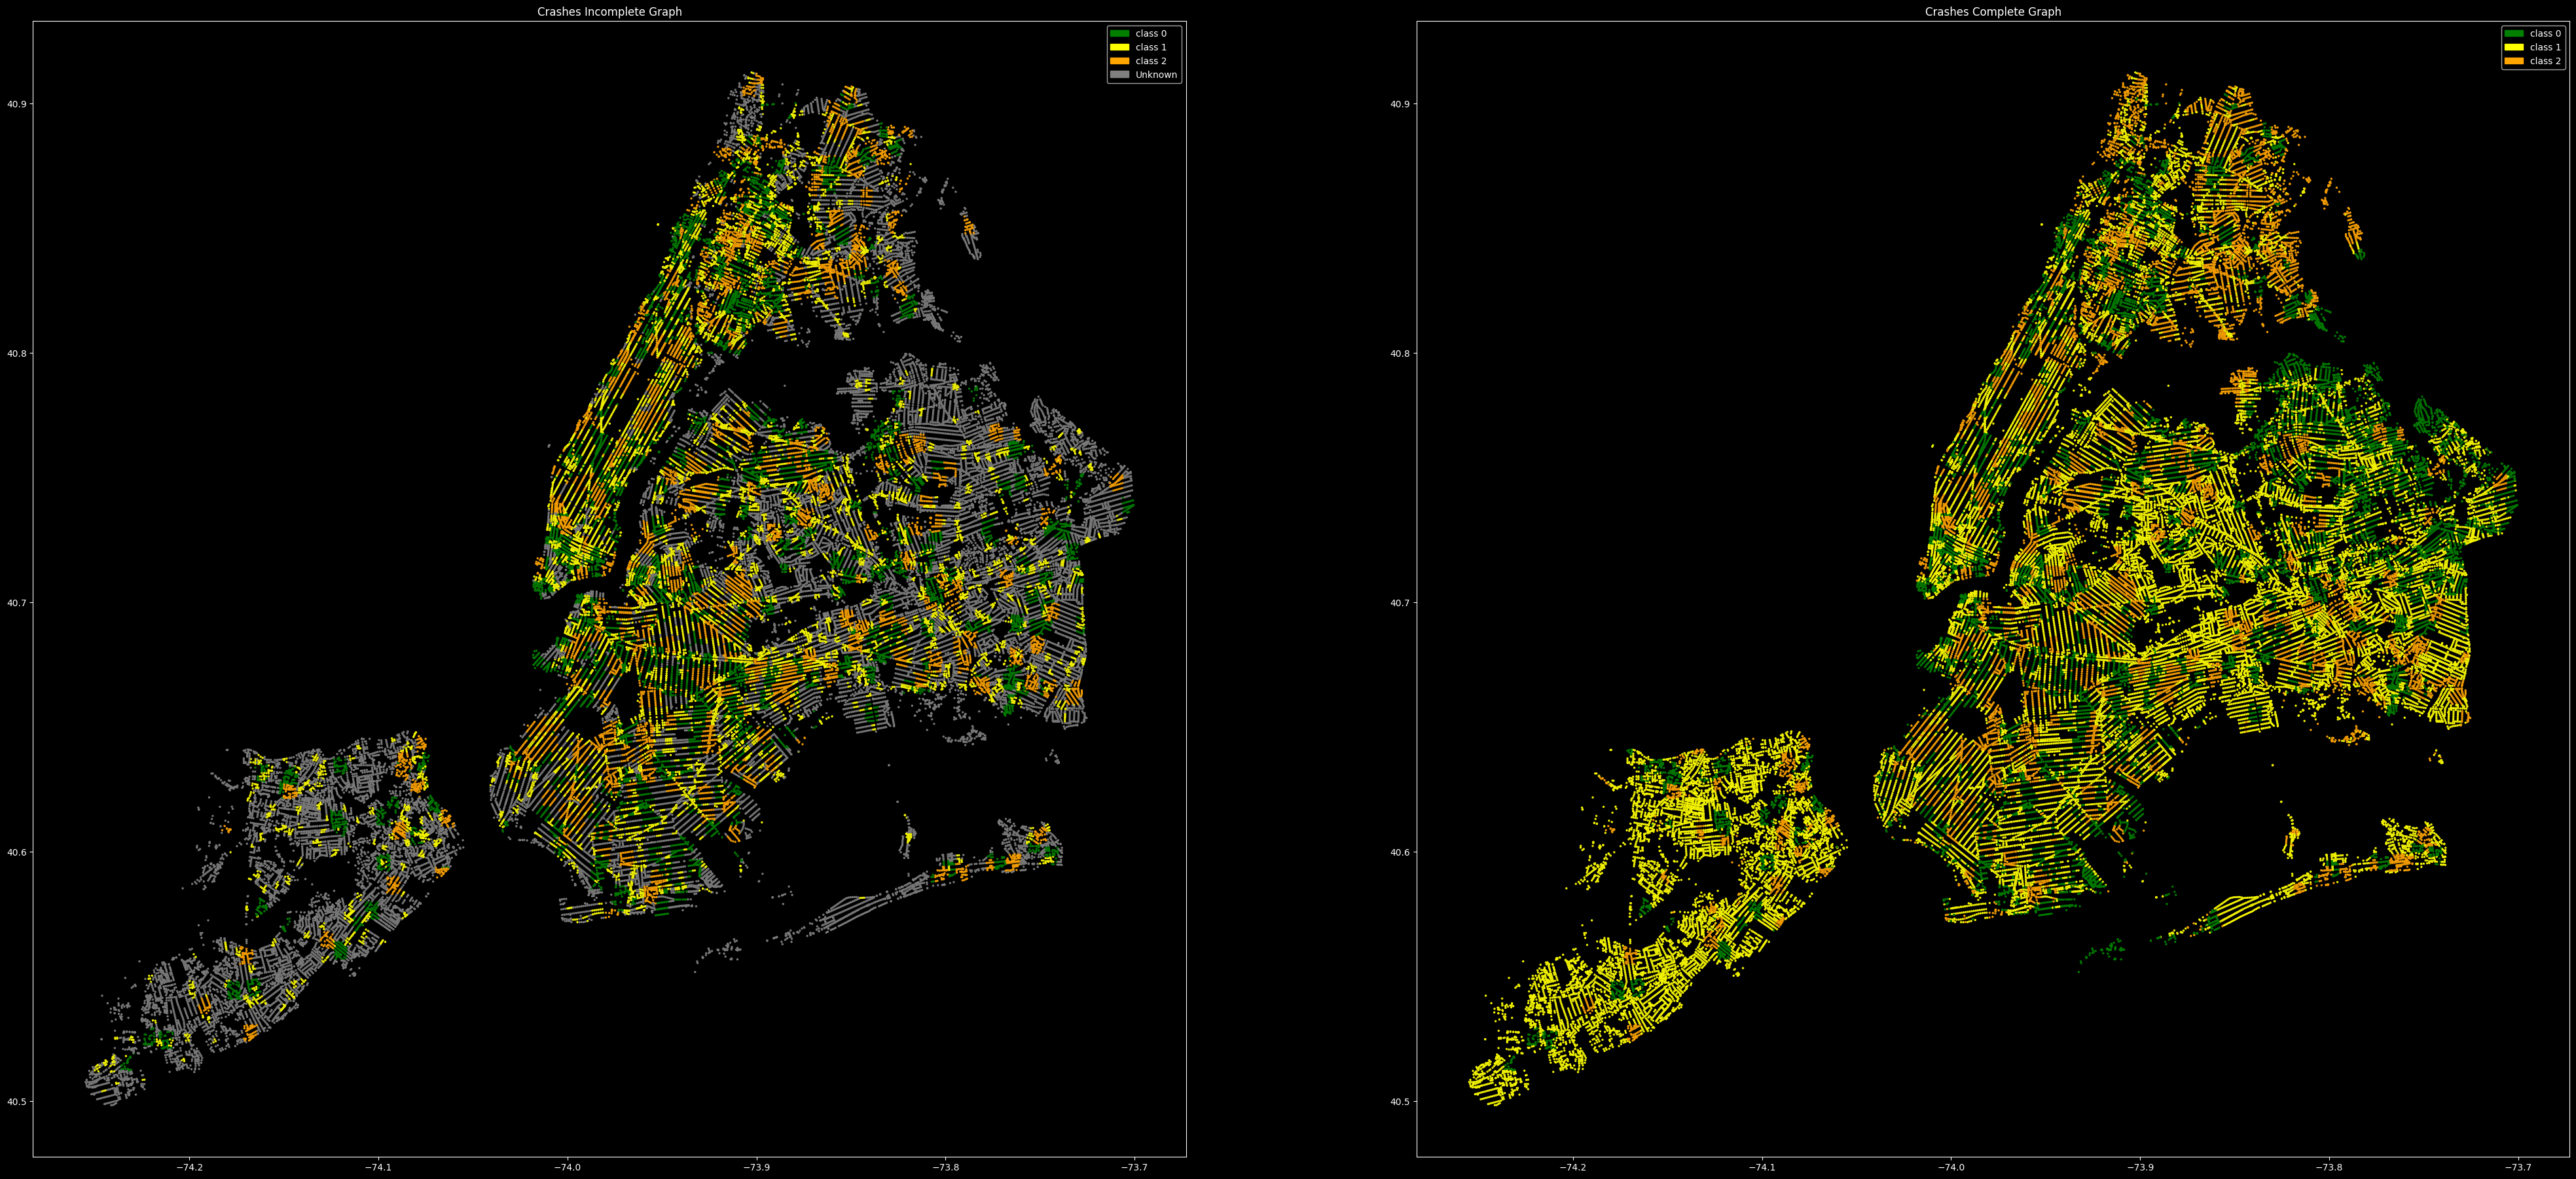
The graph was split into Train, Validation, Test, Prediction Nodes and set for training. From left to right we can see the Crash Classes Graph, Train Graph, Validation Graph, Test Graph and the Prediction Graph.
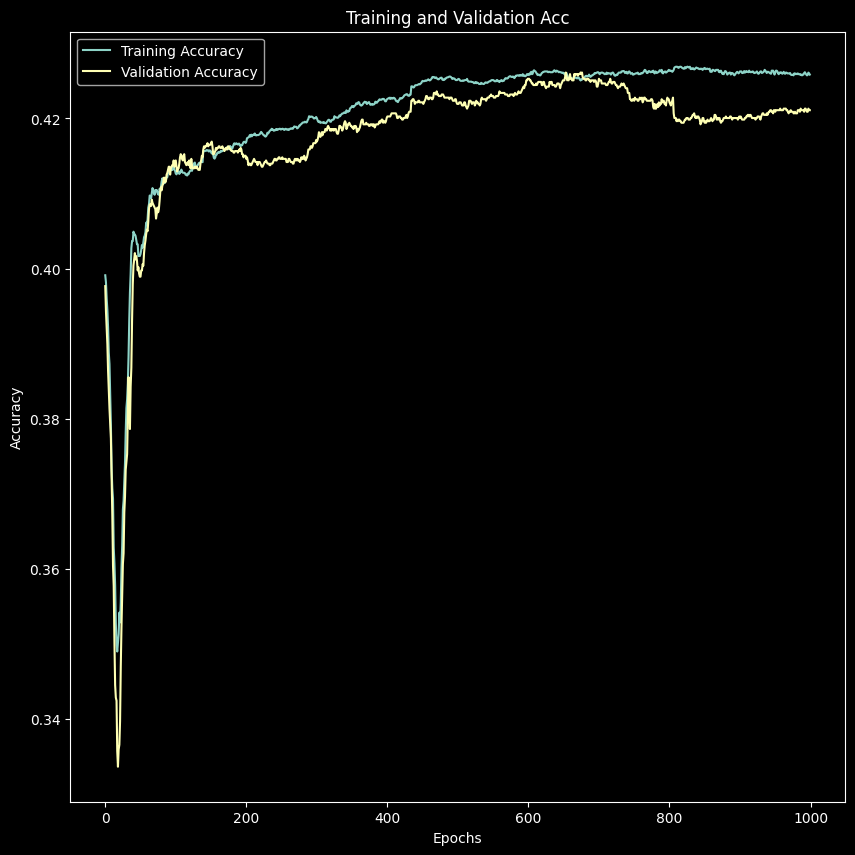
The plot demonstrates the improvement in accuracy for both the training and validation datasets as the model trains over 1000 epochs, with the training accuracy generally being higher than the validation accuracy. There is a noticeable gap between the training and validation accuracy, with the training accuracy being higher. This gap indicates that the model is likely overfitting to some extent.
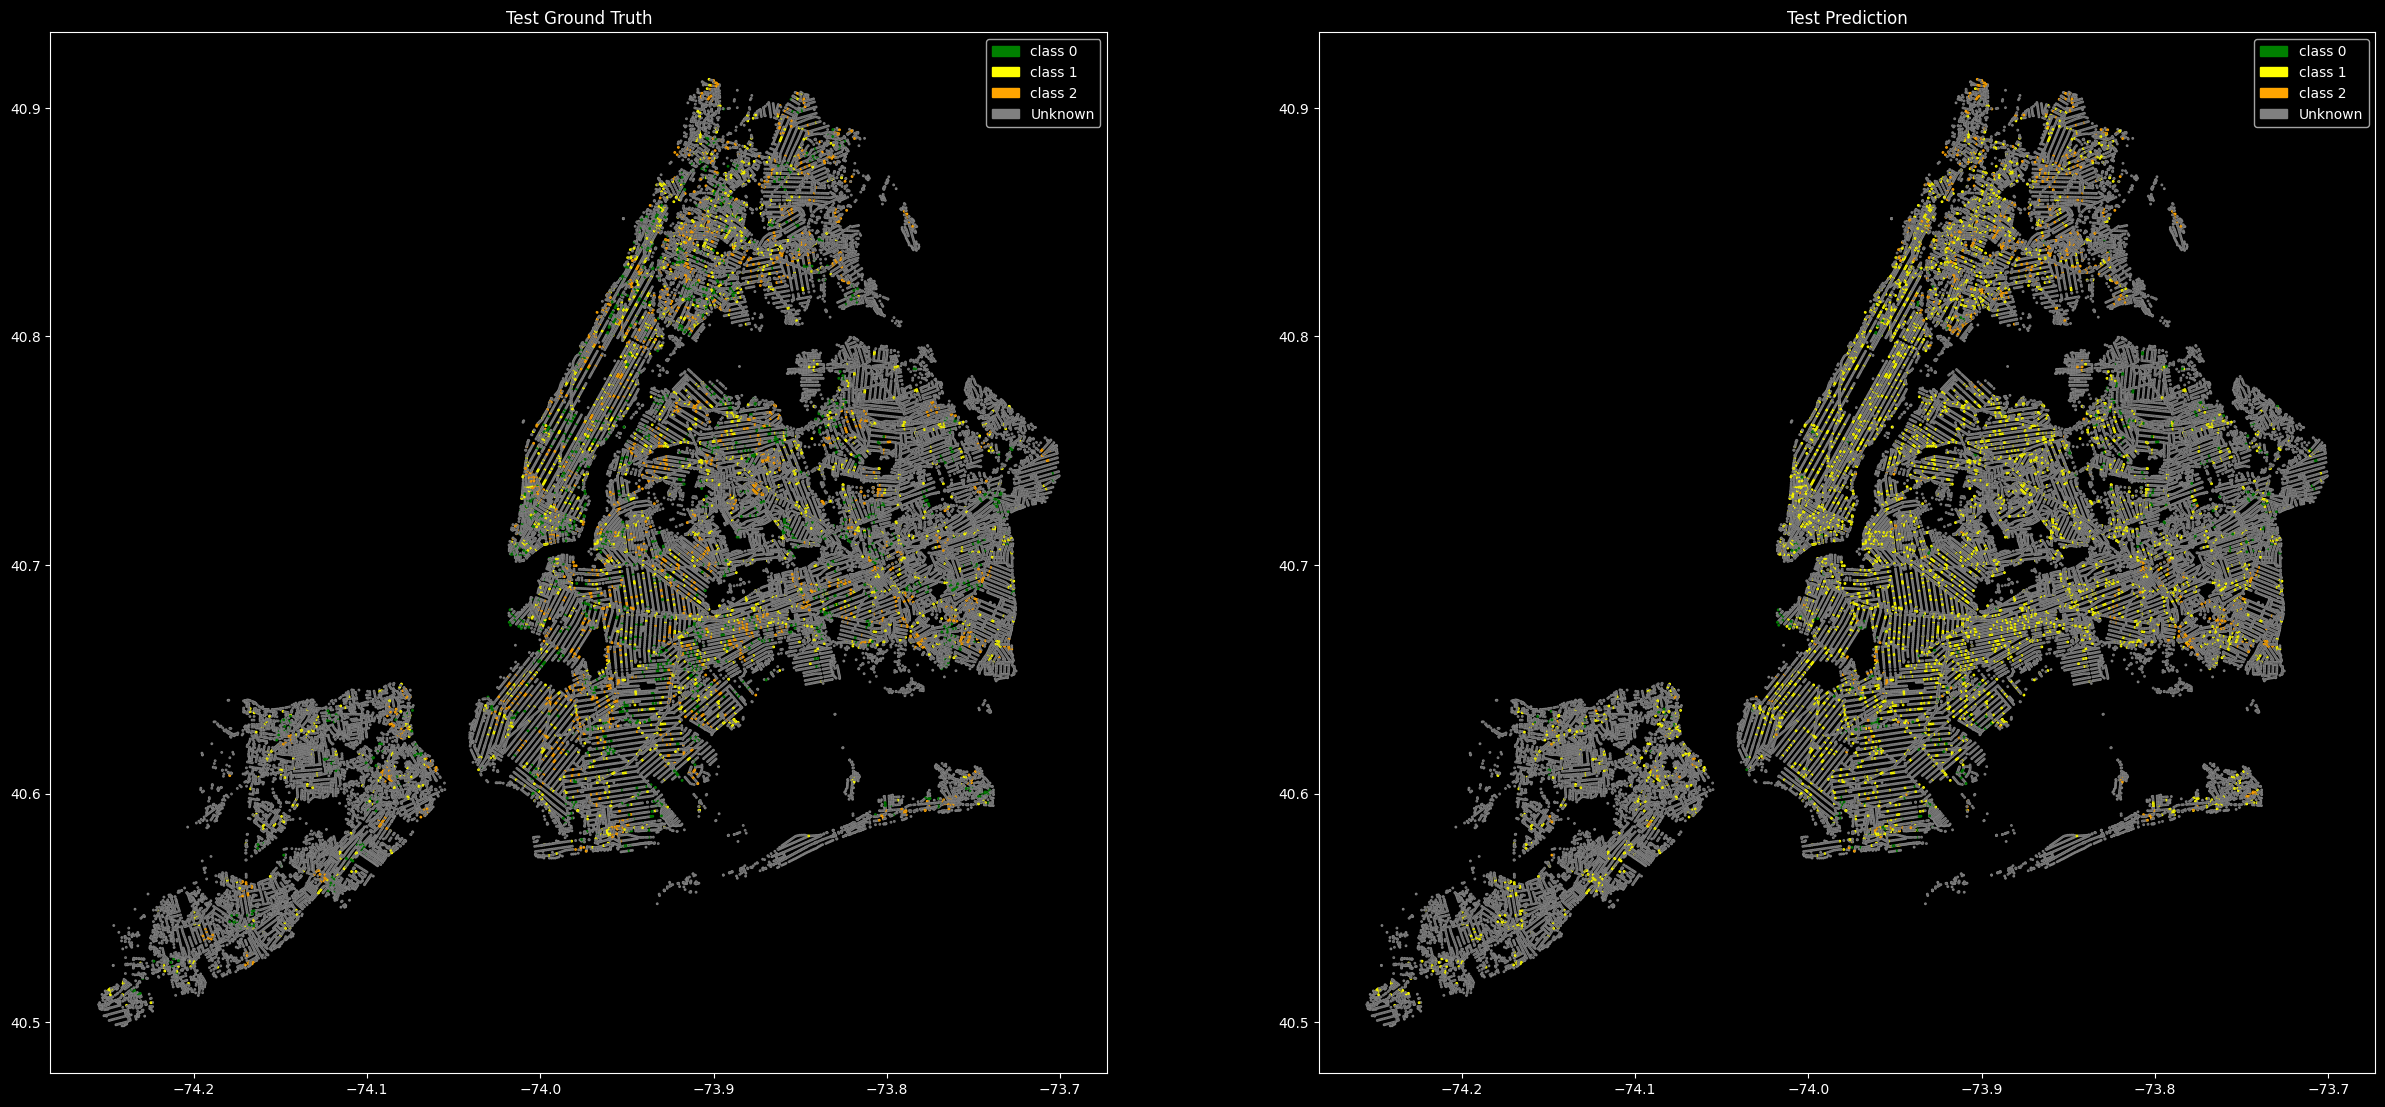
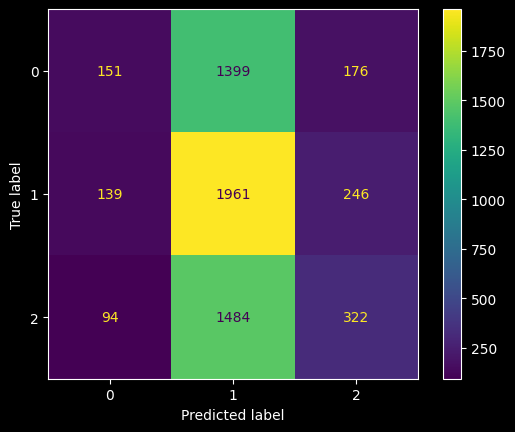
Class 0 (3C): The model struggles significantly with class 0, often misclassifying it as class 1.
Class 1 (2C): The model performs well with class 1, with the highest number of correct predictions, but there are still some misclassifications.
Class 2 (1C): The model has a moderate performance with class 2, with many instances being misclassified as class 1.
This suggested us the need for:
- More training data for underrepresented classes.
- Model tuning to improve classification accuracy.
- Techniques such as class weighting to handle imbalanced datasets.
In the future by applying these methods the model could be improved in order to have more accurate predictions.
Conclusion
The complete graph of the missing classes after training showed us that there was a somewhat an accurate prediction of the type of crash in the unknown areas. The class predicted most (2C) made sense as there would be more severe injury crashes than fatality which would be more rare, and non-severe as it is a dense city where the crash risks are higher. In the end the model could be vastly improved with features that may affect crashes more precisely, and improving the training data and process.
