Abstract
The main objective of the Software I seminar was to engage in computational logics and growth assemblages using voxels as its main geometrical component. The logic utilizes algorithms and visual programming in Grasshopper and Loops using Anemone Plugin.
By definition, an assemblage is the process of combining individual components or parts to generate a larger functional unit, system or product.
In our Iterative Assemblage Strategy we focused on exploring different growth constraints and selection methods to understand how varied geometry and handle positions could generate different assembled geometries.
Components design
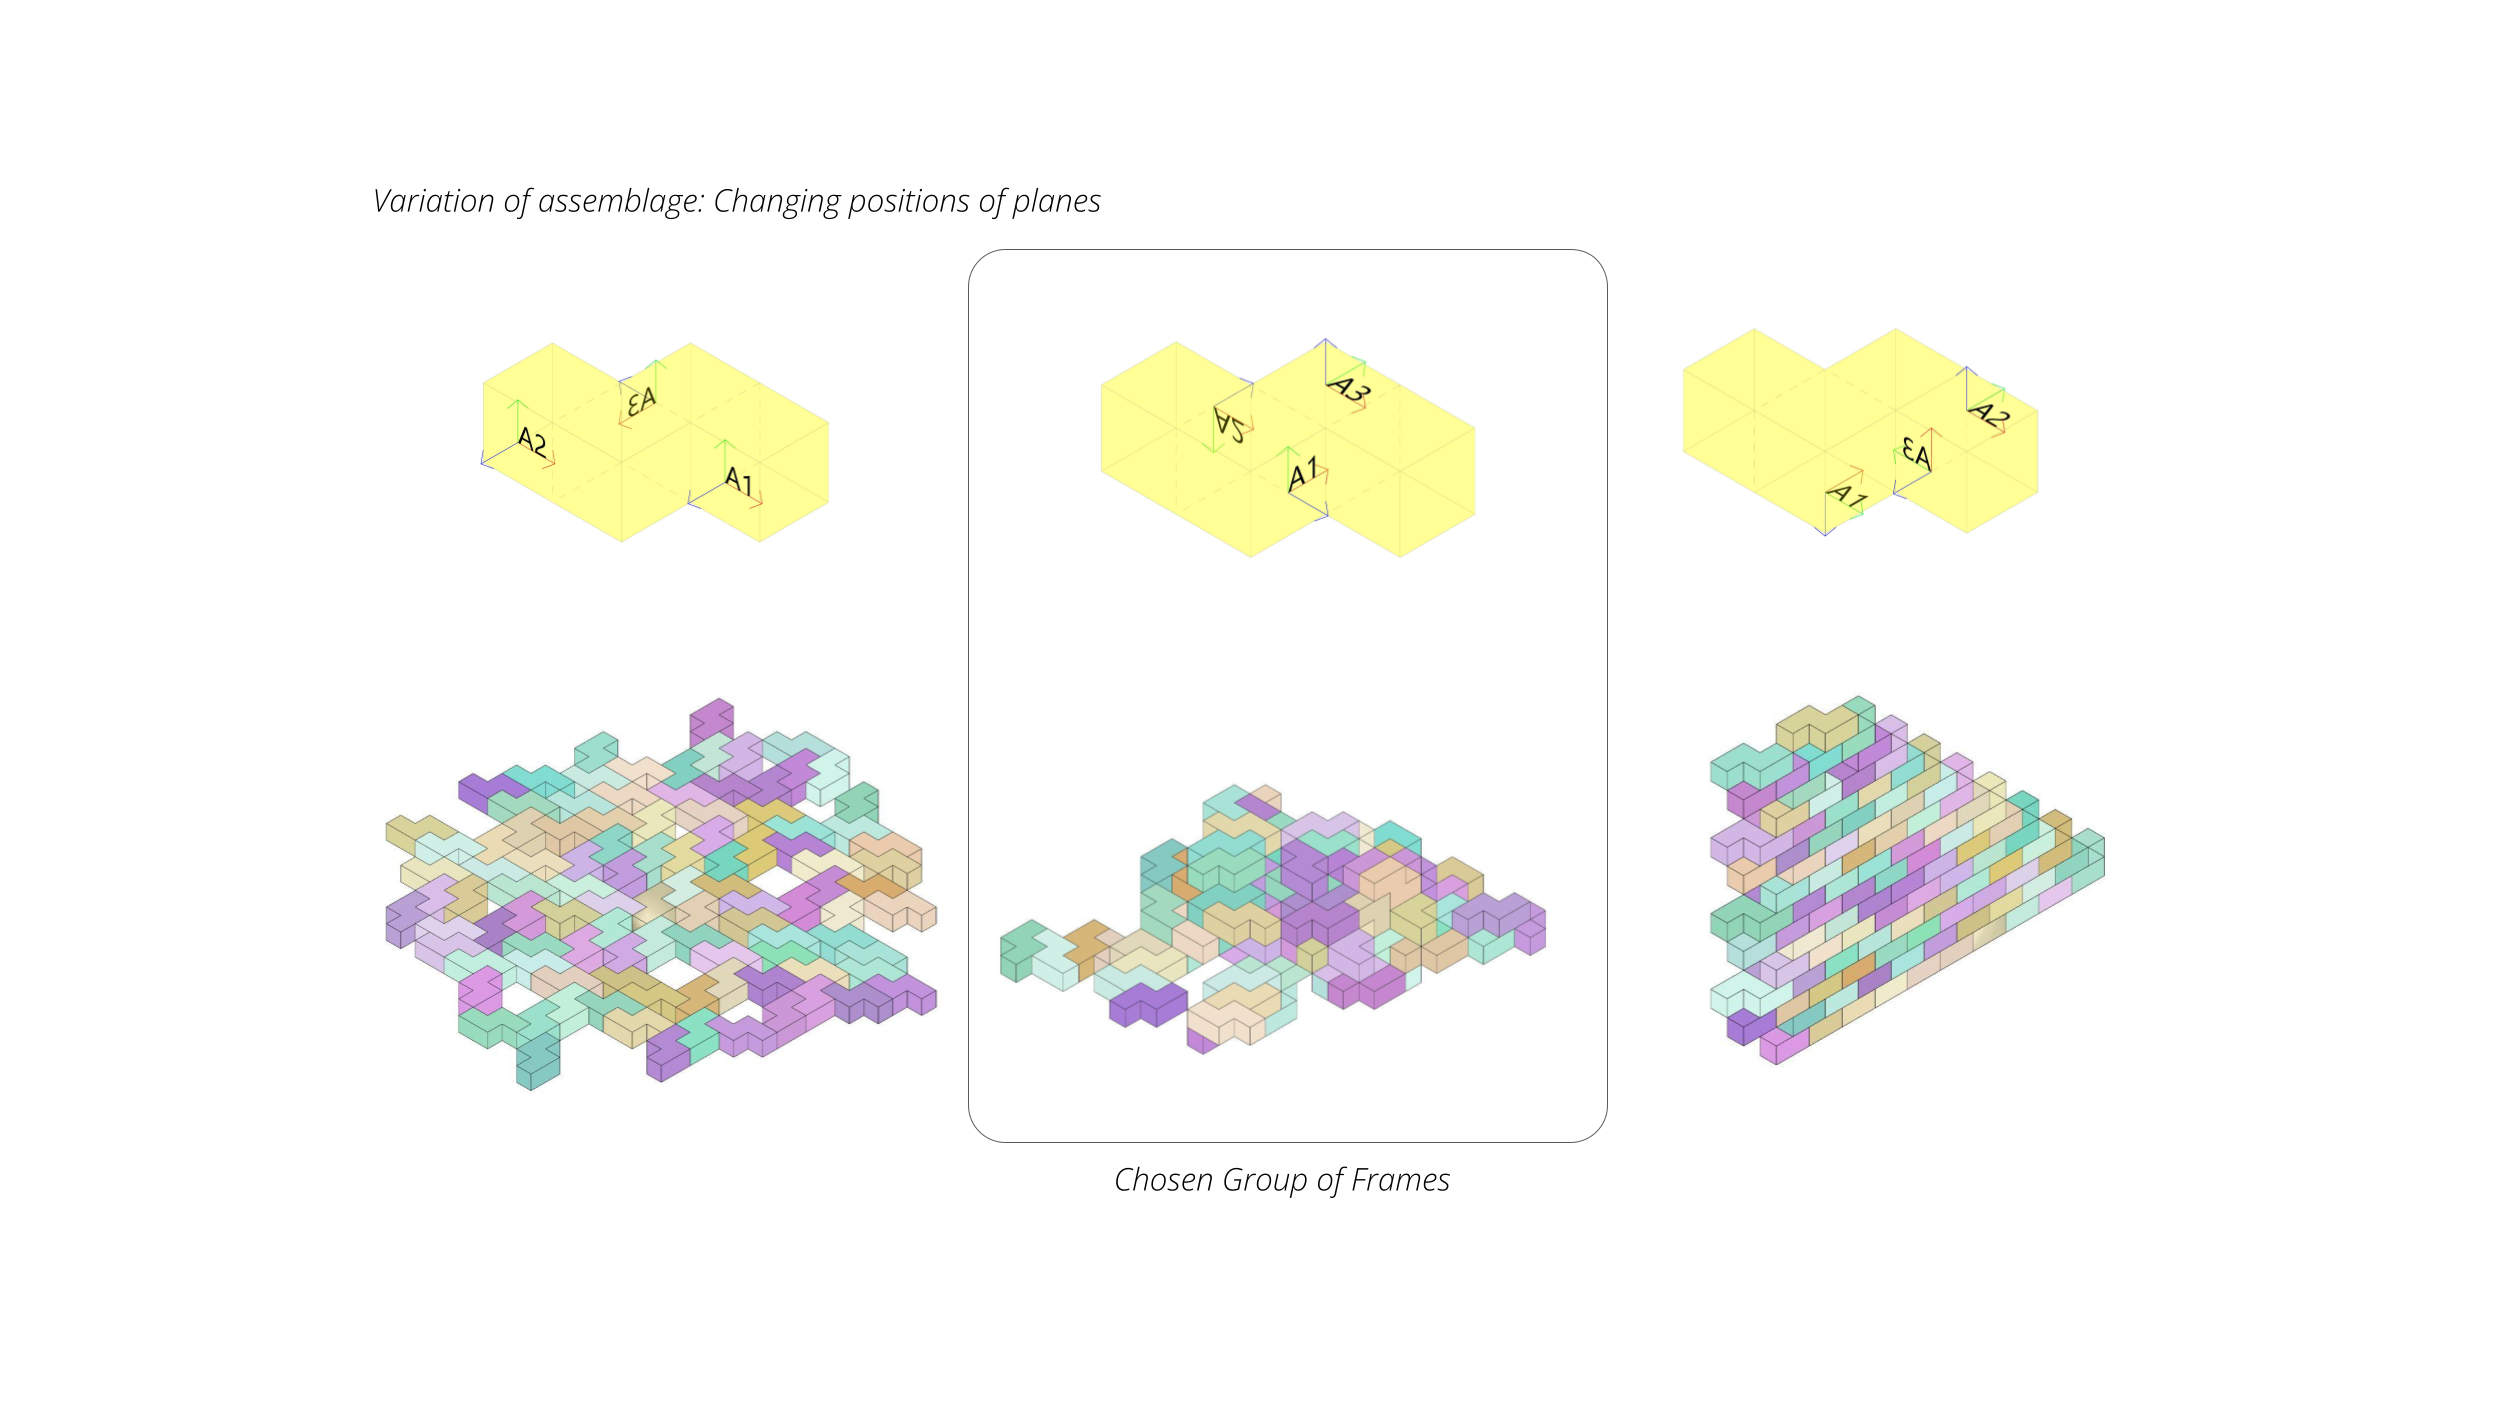
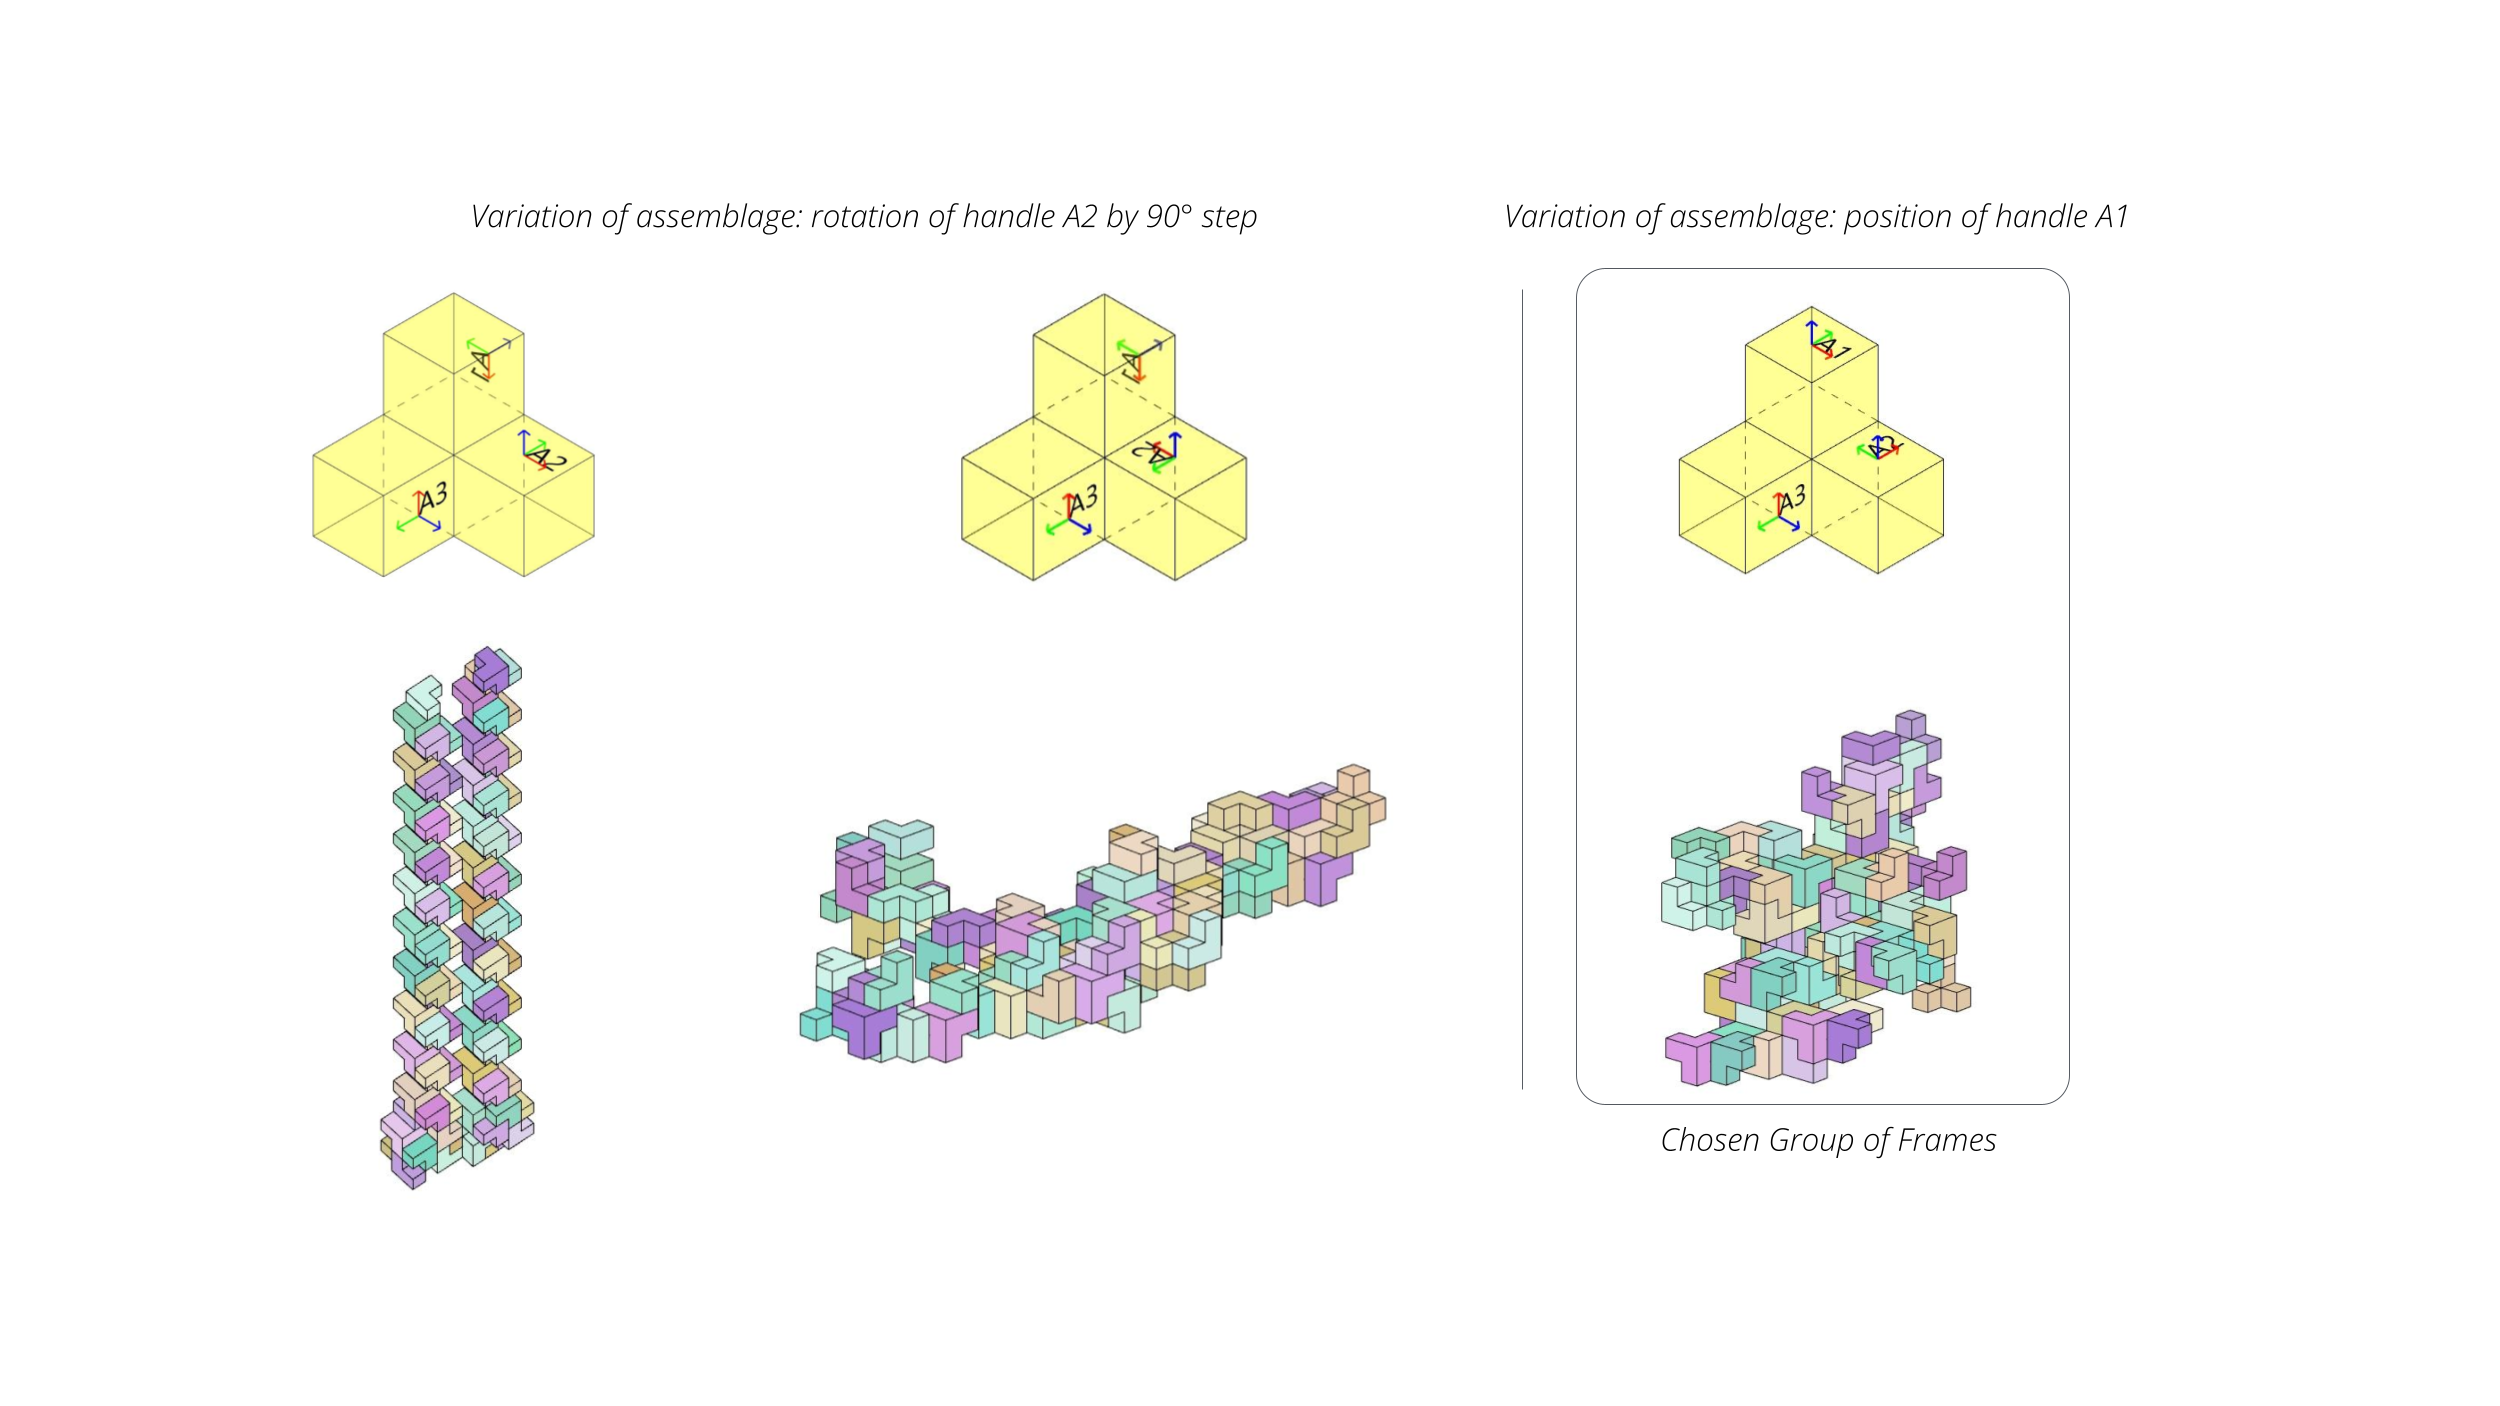
For the Voxel assemblage exercise, three different voxel-based components were designed. For each component, three distinct positions of planes were implemented. The permutations with this group of frames have demonstrated outcomes that had zero collision and other trials with some collision. The permutation growth and the collision effect is a consequence of the positions of the planes that were set. By changing the position or rotation of the frames novel geometrical behaviors are generated.
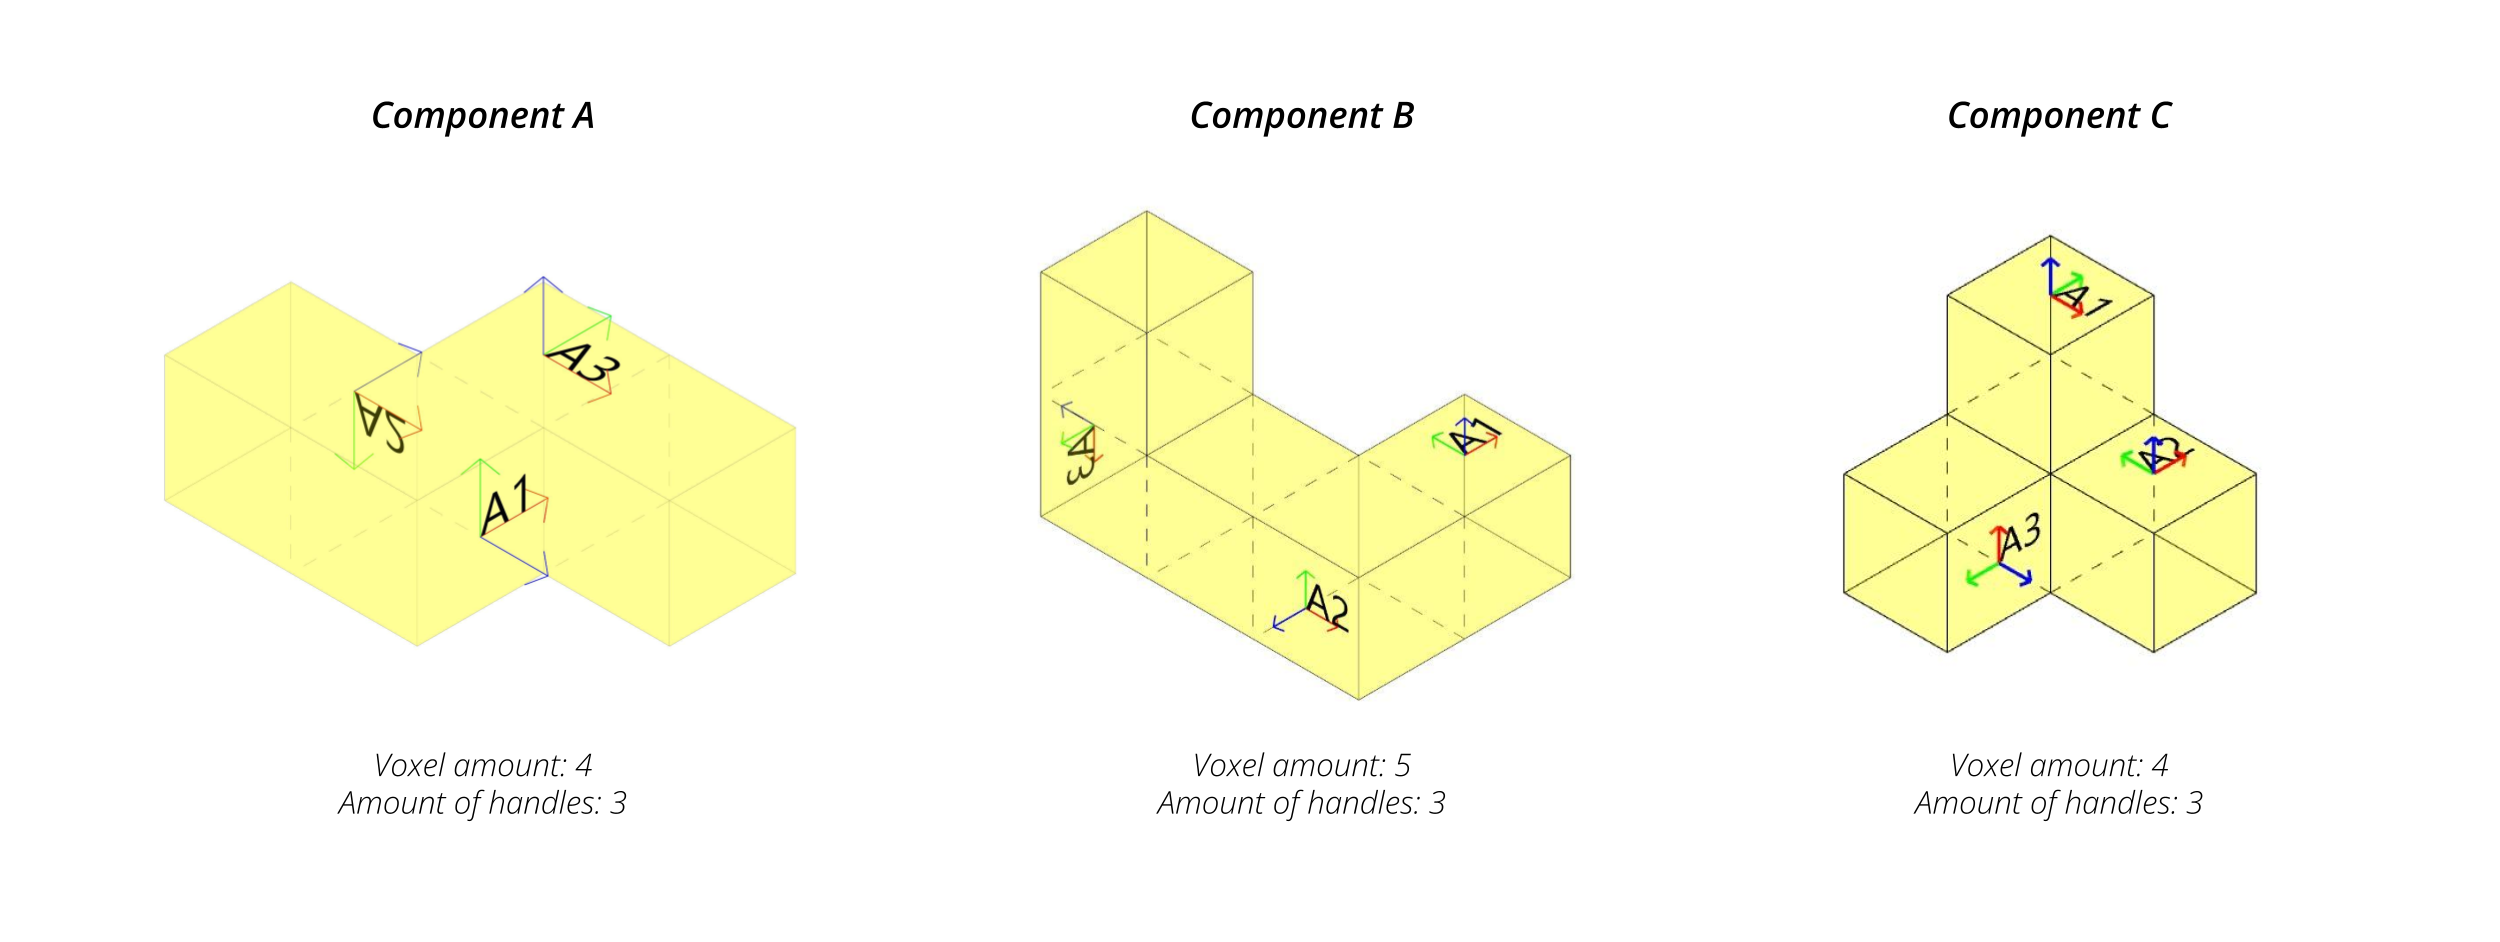
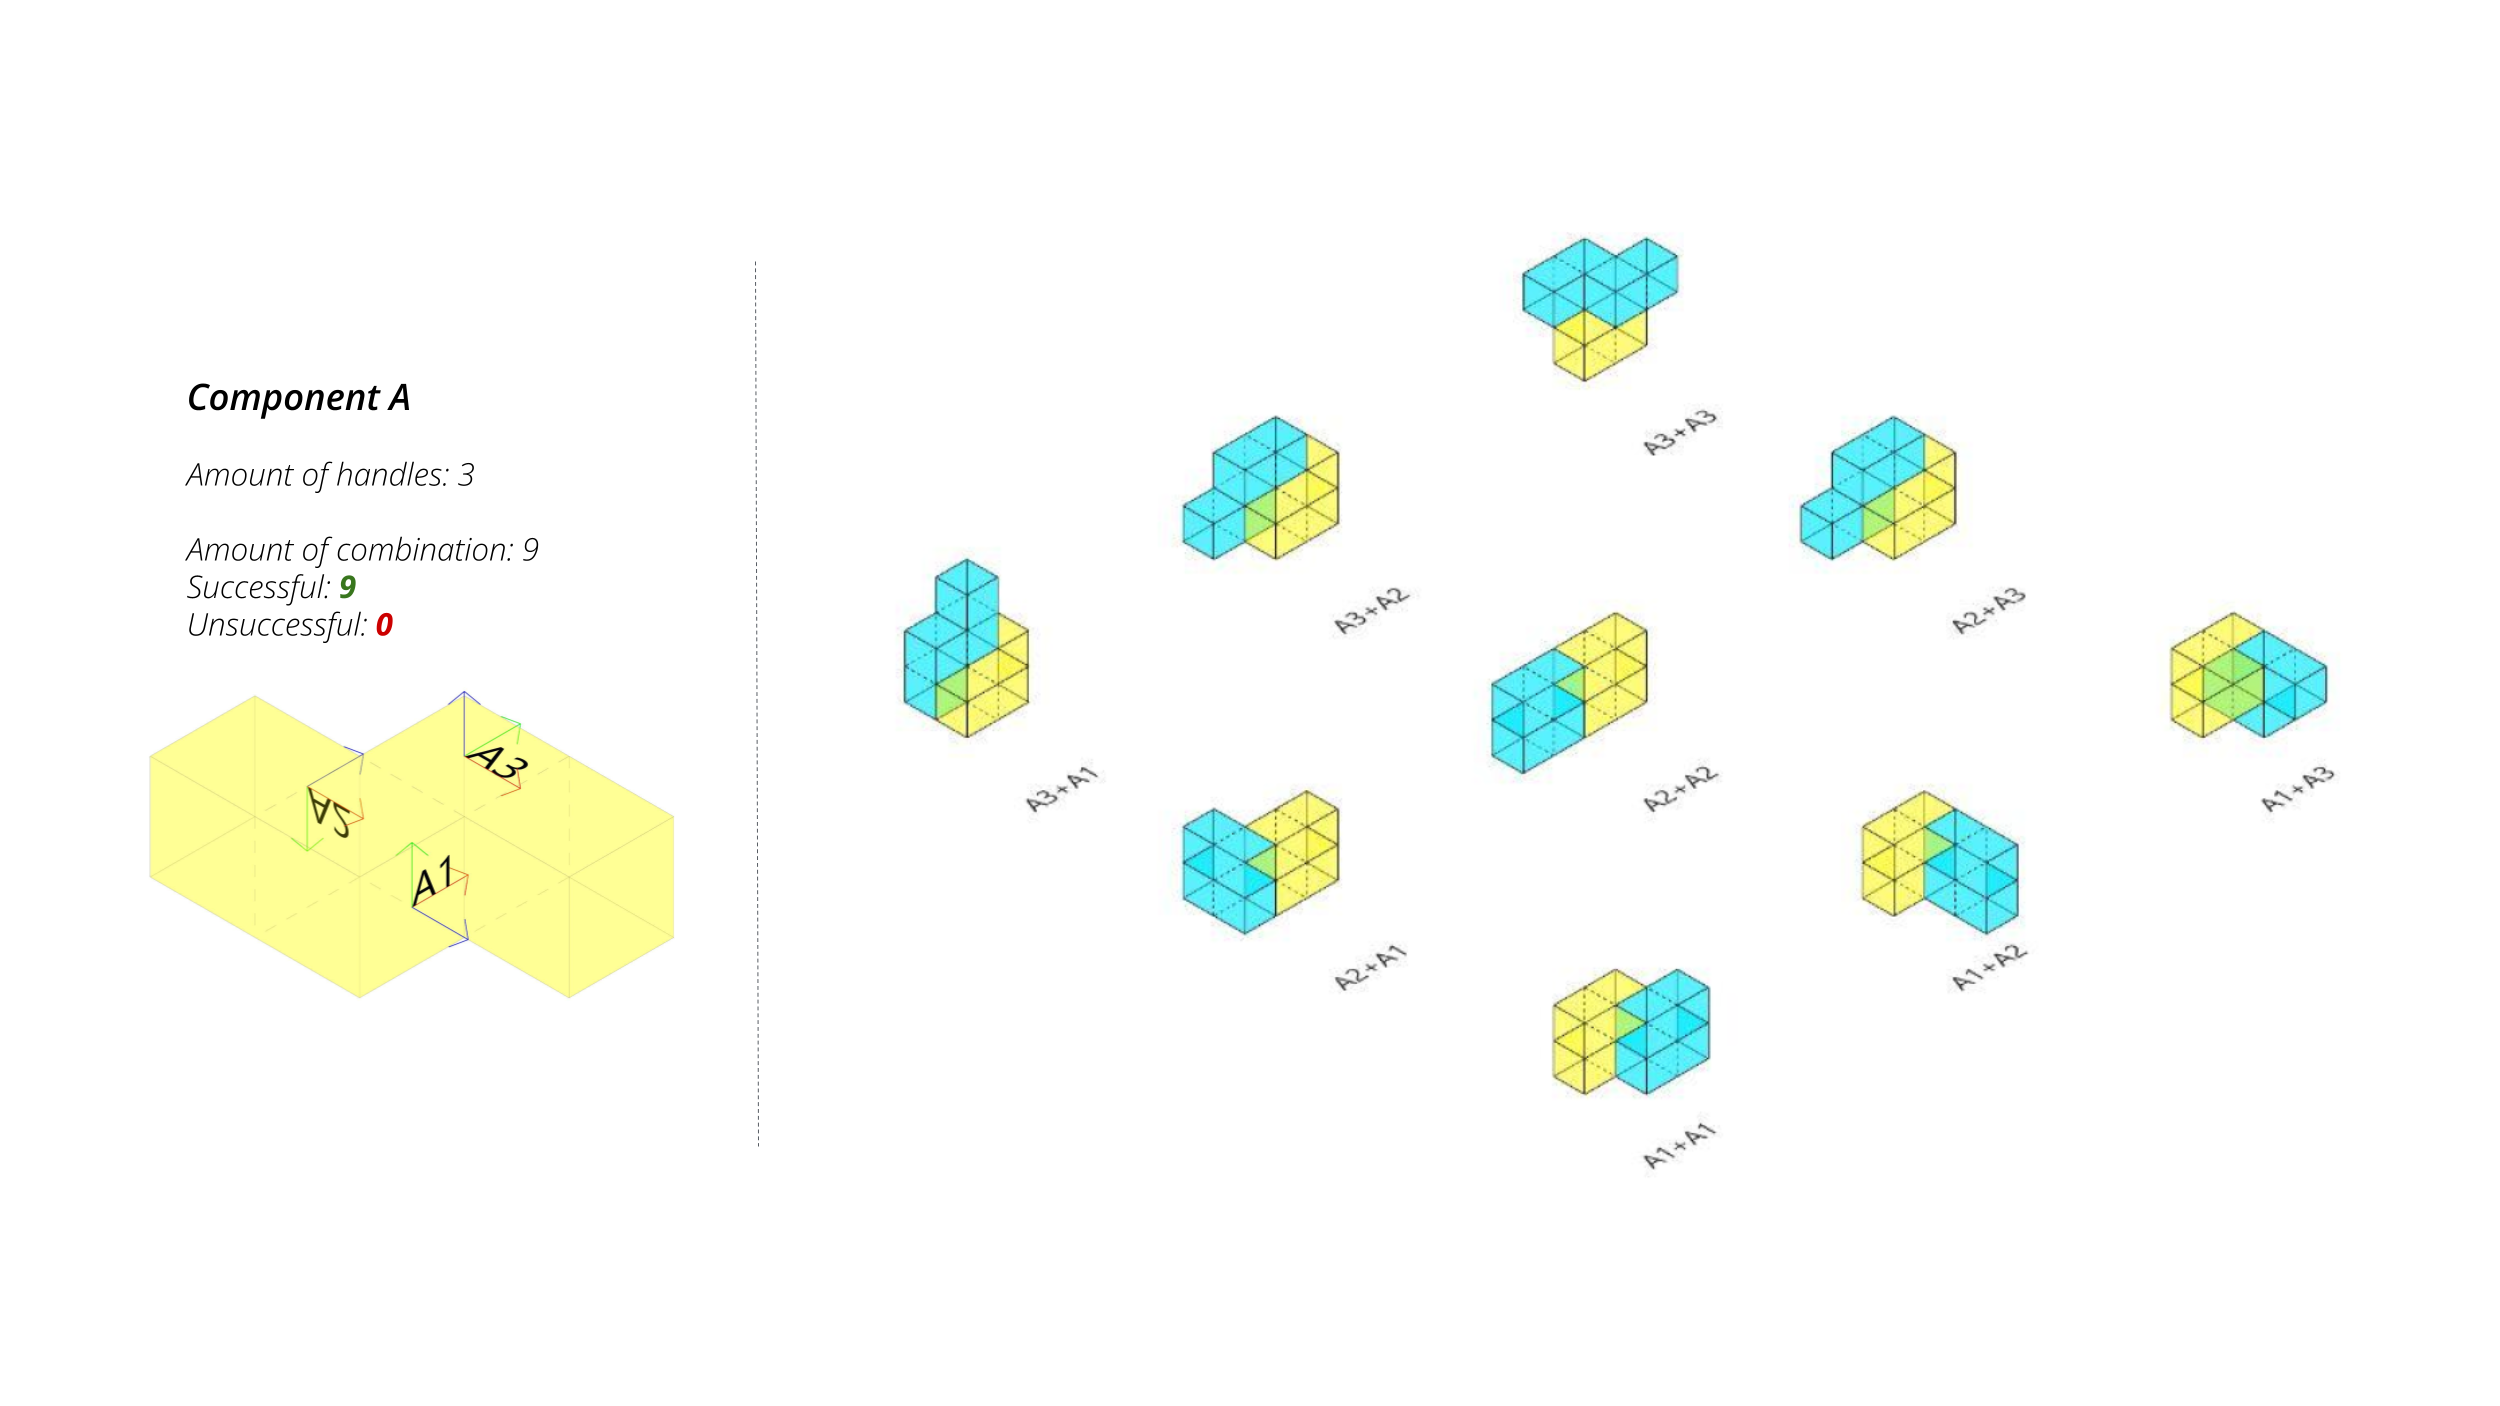
Component A
For the design of component A, 4 voxels and 3 handles were employed. A group of three frames were selected and a collision test was conducted. It was observed that the permutations had zero collisions, as a result, we obtain an almost planar shape, primarily because plane A3 facilitates growth along the z-axis only in certain iterations. Furthermore, two alternative scenarios were explored: one involved altering the positions of the planes to yield a completely flat outcome, with growth occurring only along the “x” and “y” axes, while the other produced growth exclusively along the “z” axis, essentially in a vertical direction. Considering all the three outcomes the individual that had the frame on top was chosen to be tested further, because of the potential to grow both vertically and horizontally.
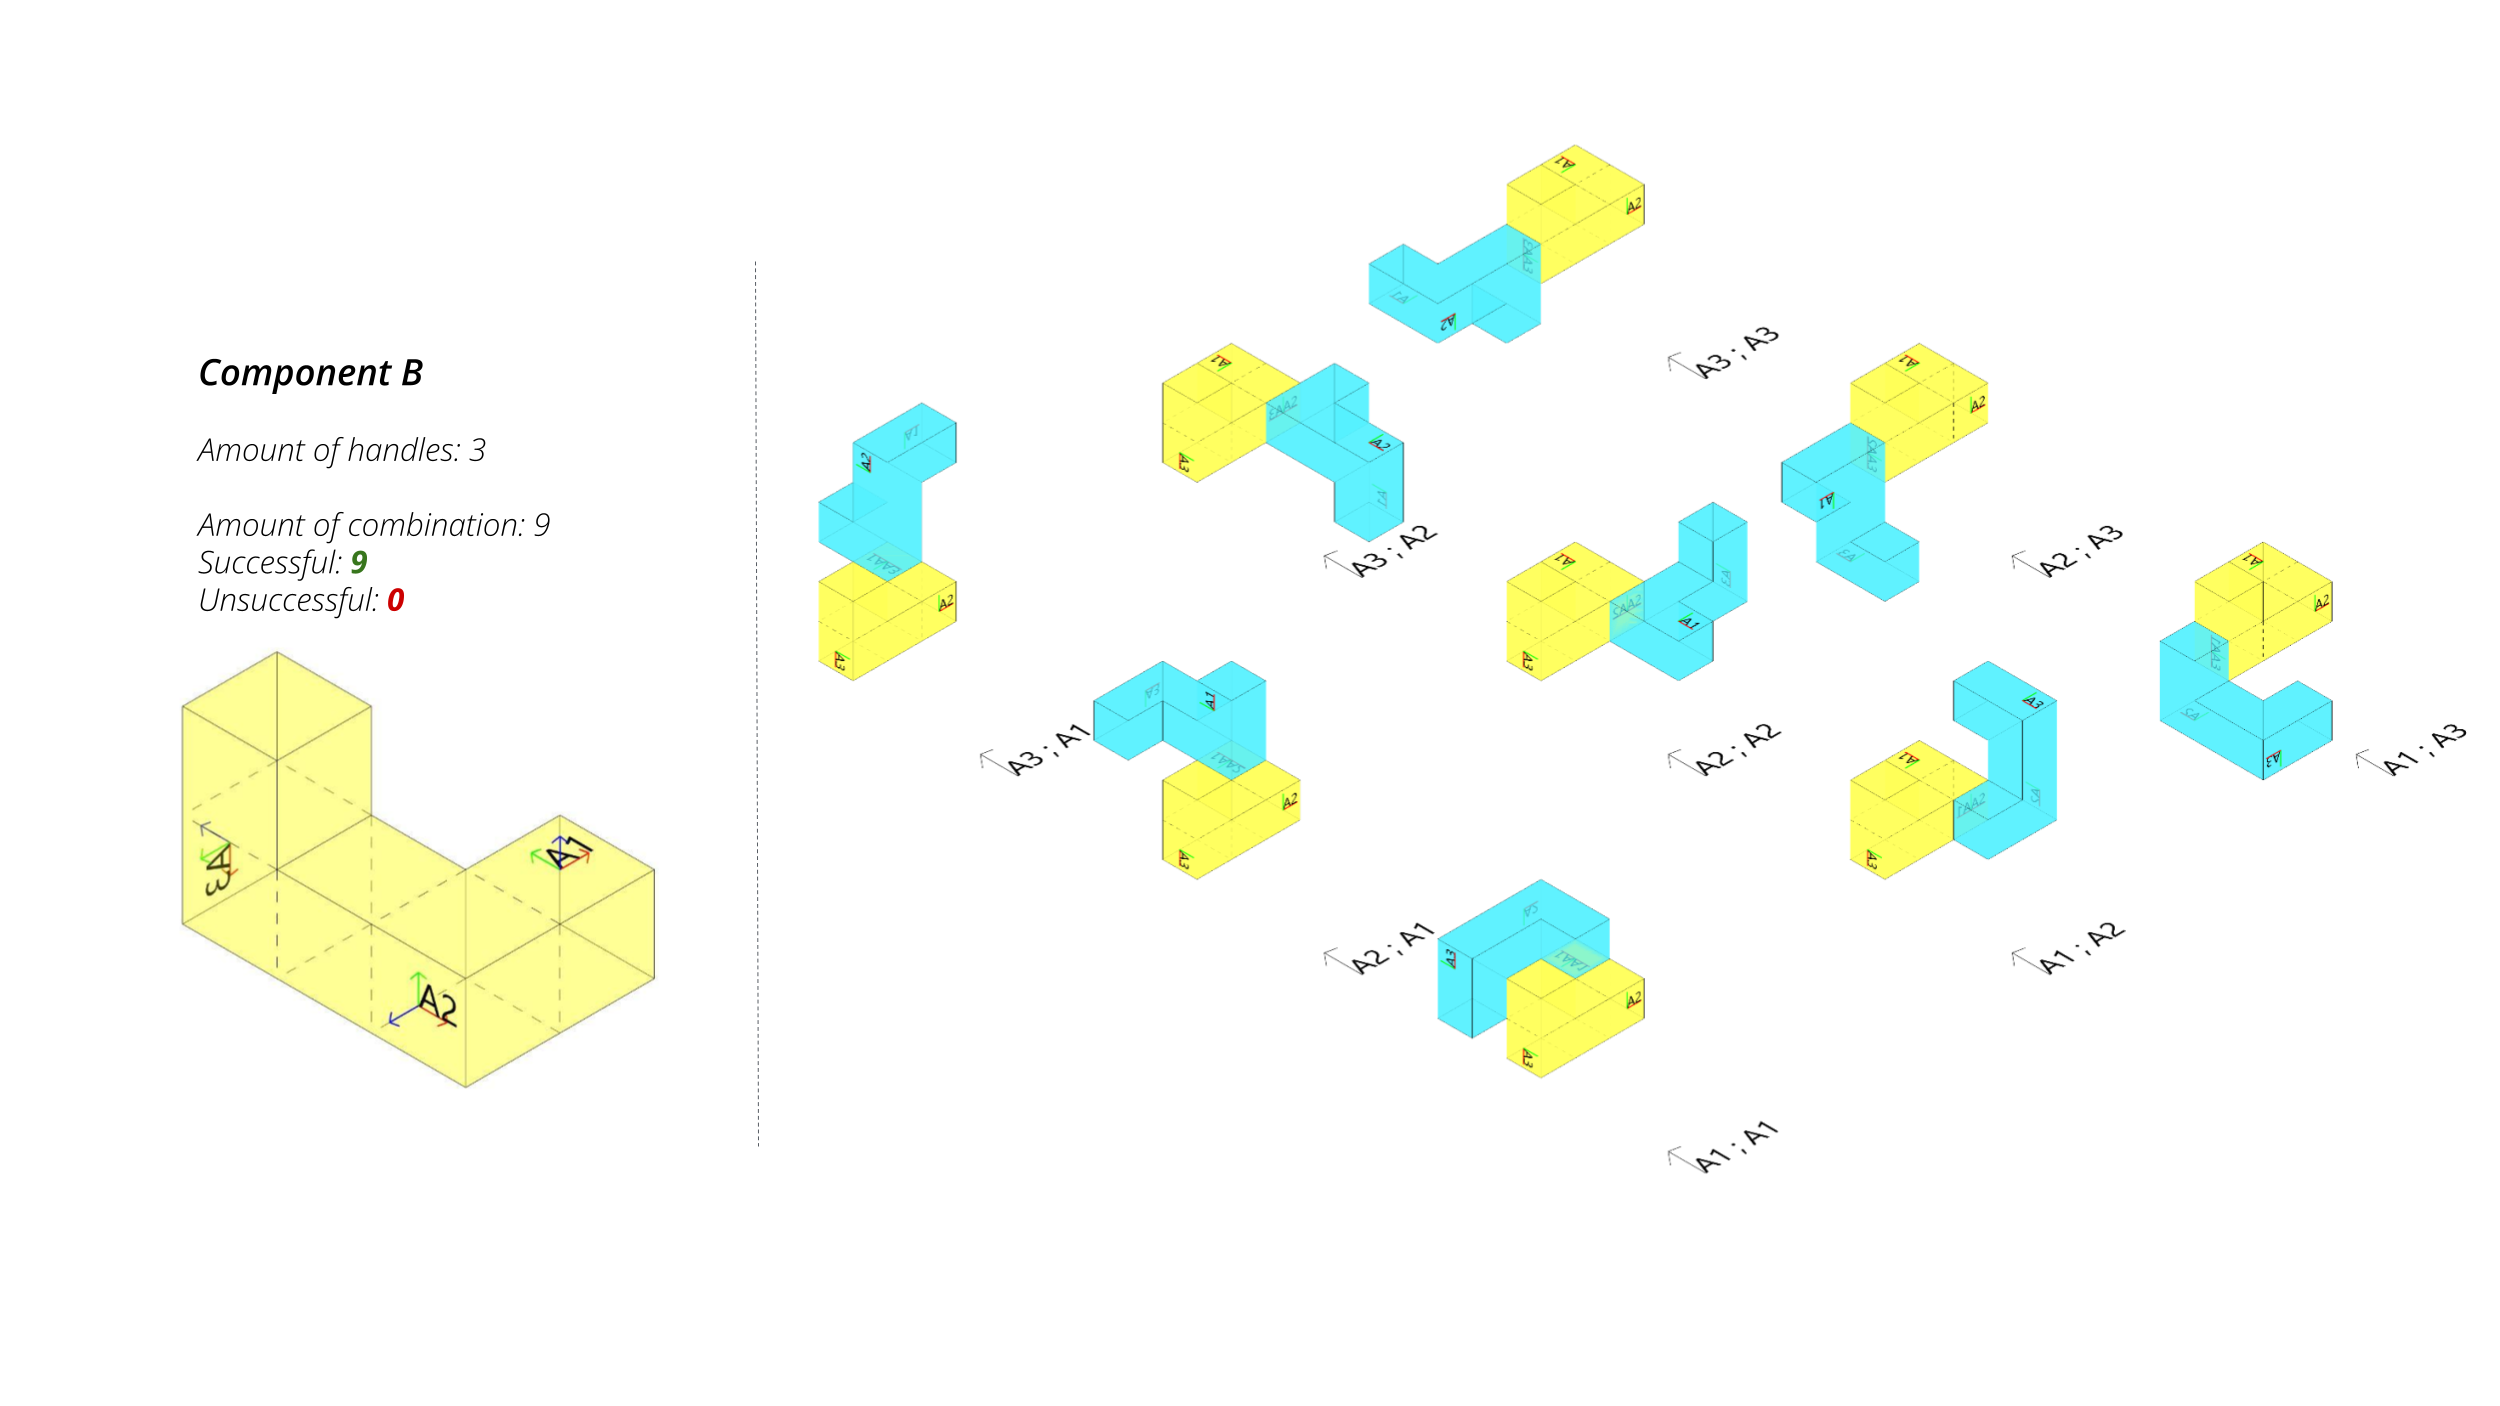
Component B
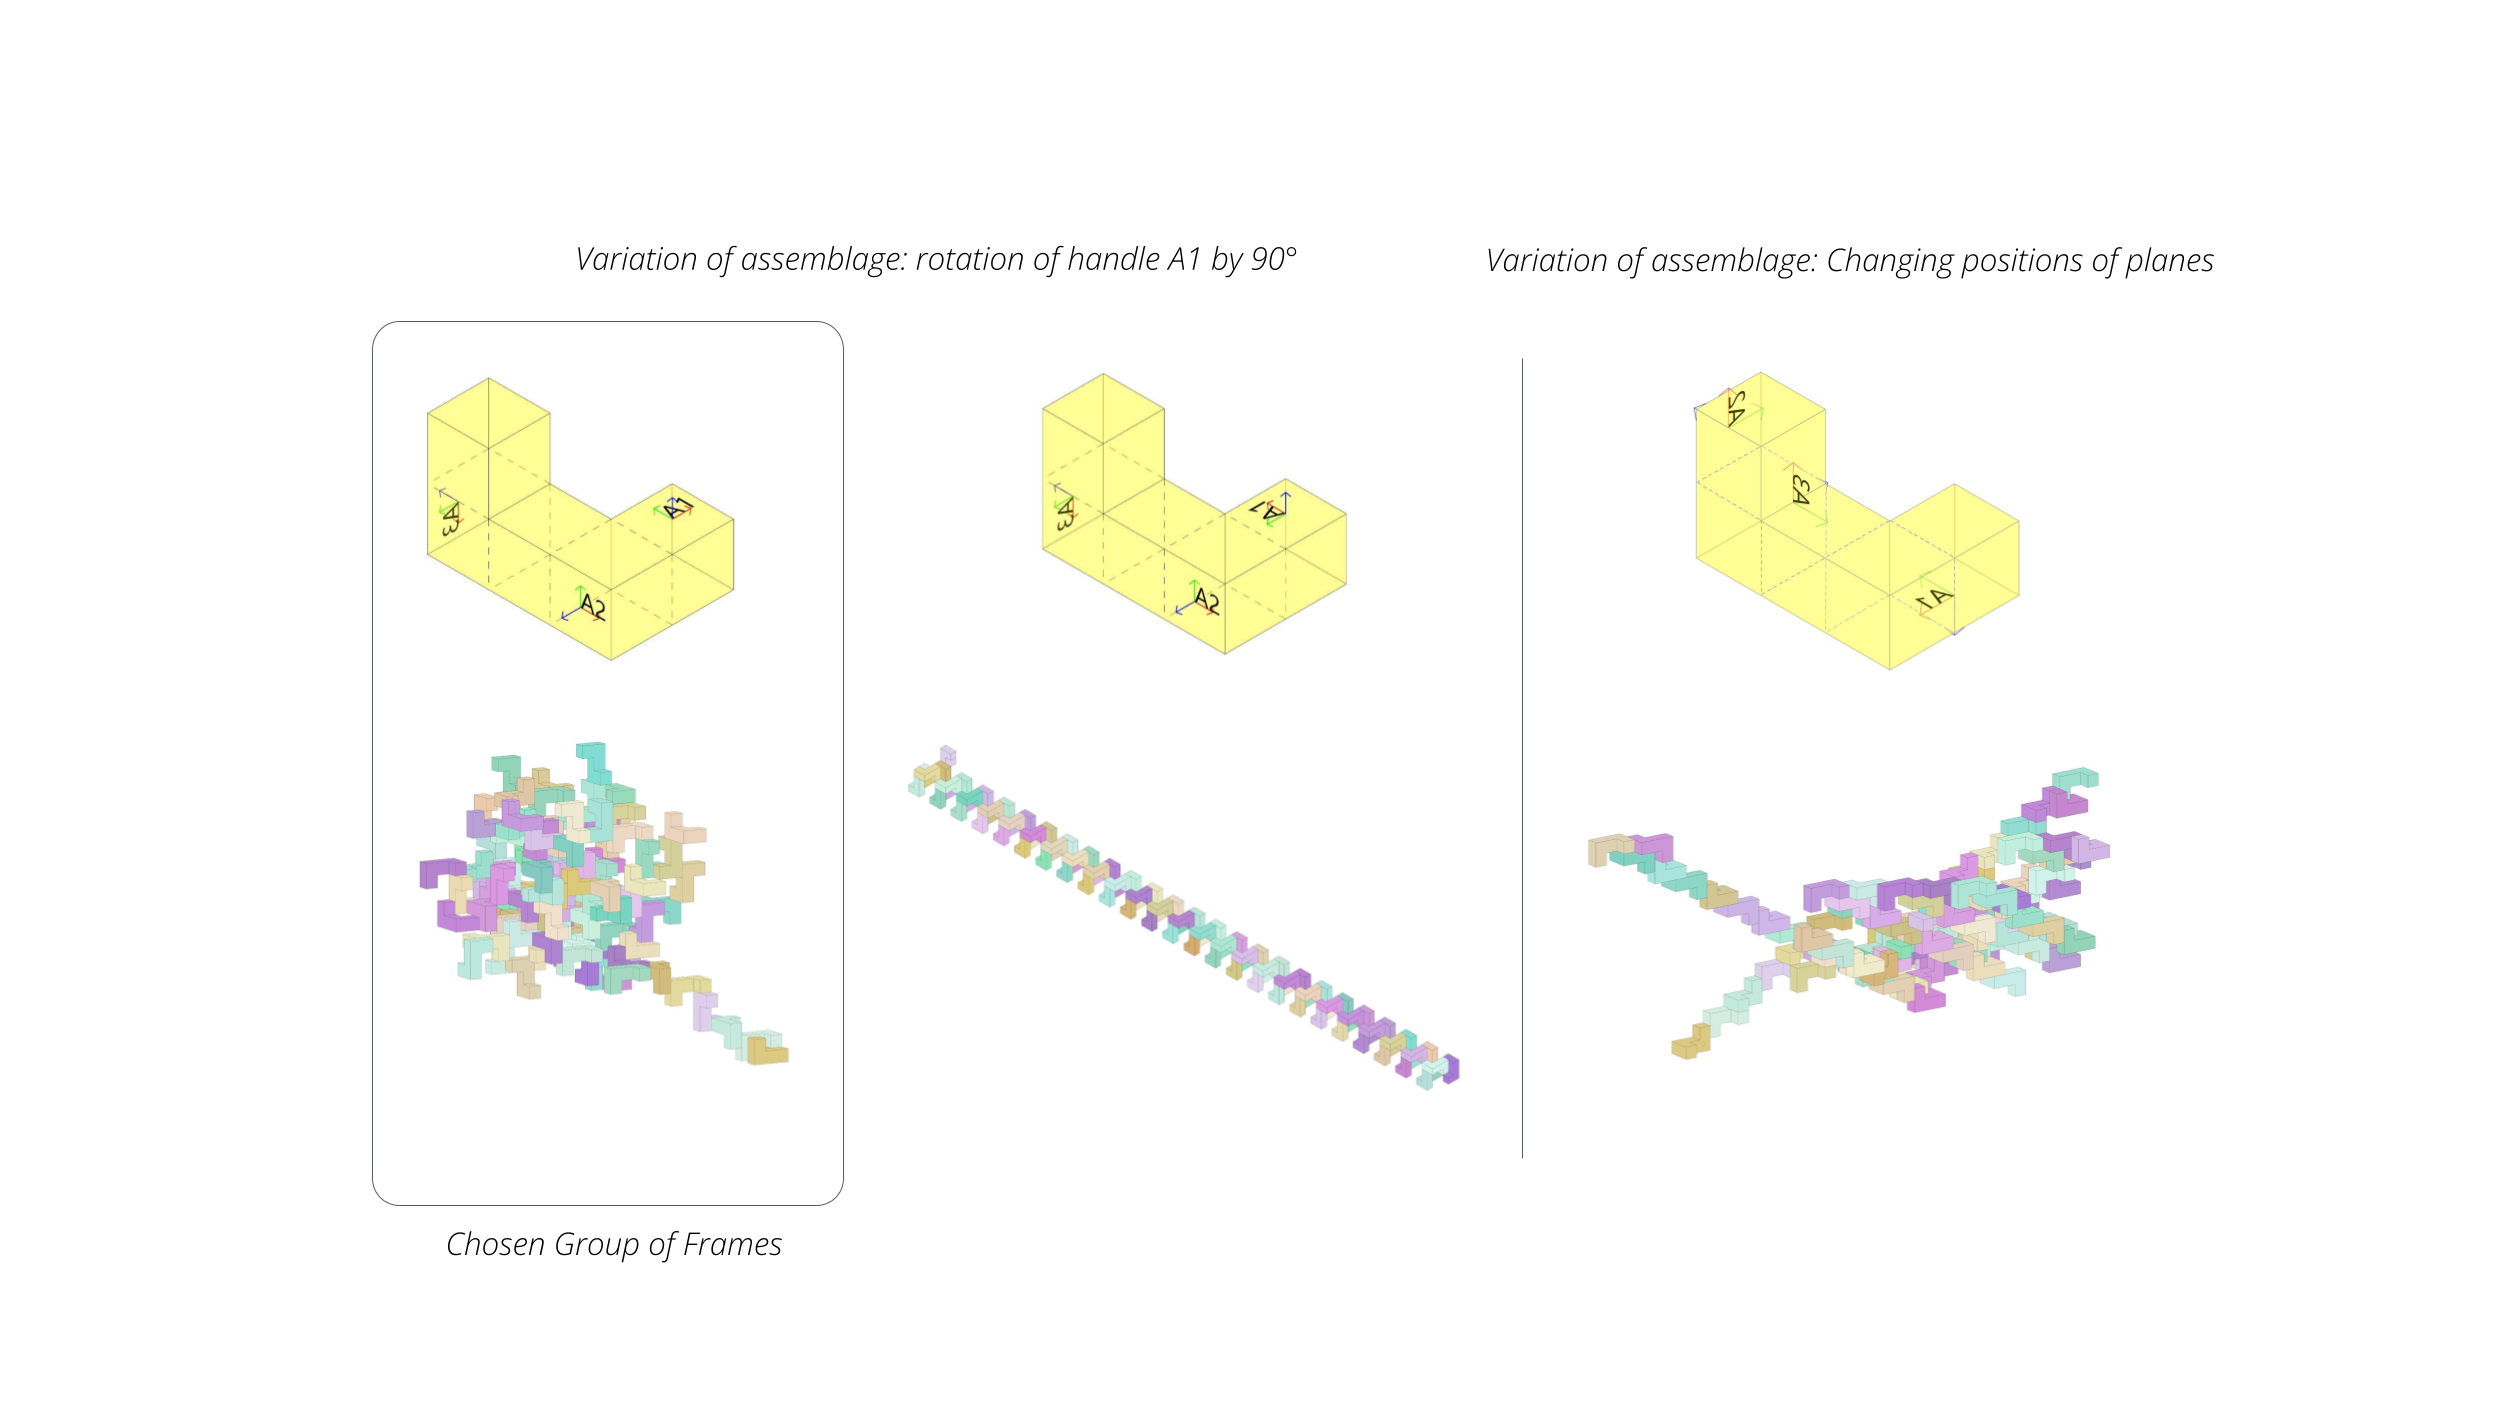
For the design of component B, 5 voxels and 3 handles were employed. A group of three frames were selected and a collision test was conducted. It was observed that the permutations had zero collisions, resulting in a rather distinctive shape where growth initially follows a linear pattern and subsequently becomes denser and more populated. Also, two different permutations were explored: the first by rotating plane A1 by 90°, resulting in a linear geometry, and the second by entirely changing the handles positions, yielding a scattered geometry in all directions. Considering all the three outcomes the individual that engendered two distinct behaviors, one linear at the beginning of the iterations and the other dense and populated towards the last iterations has been chosen to be tested further.
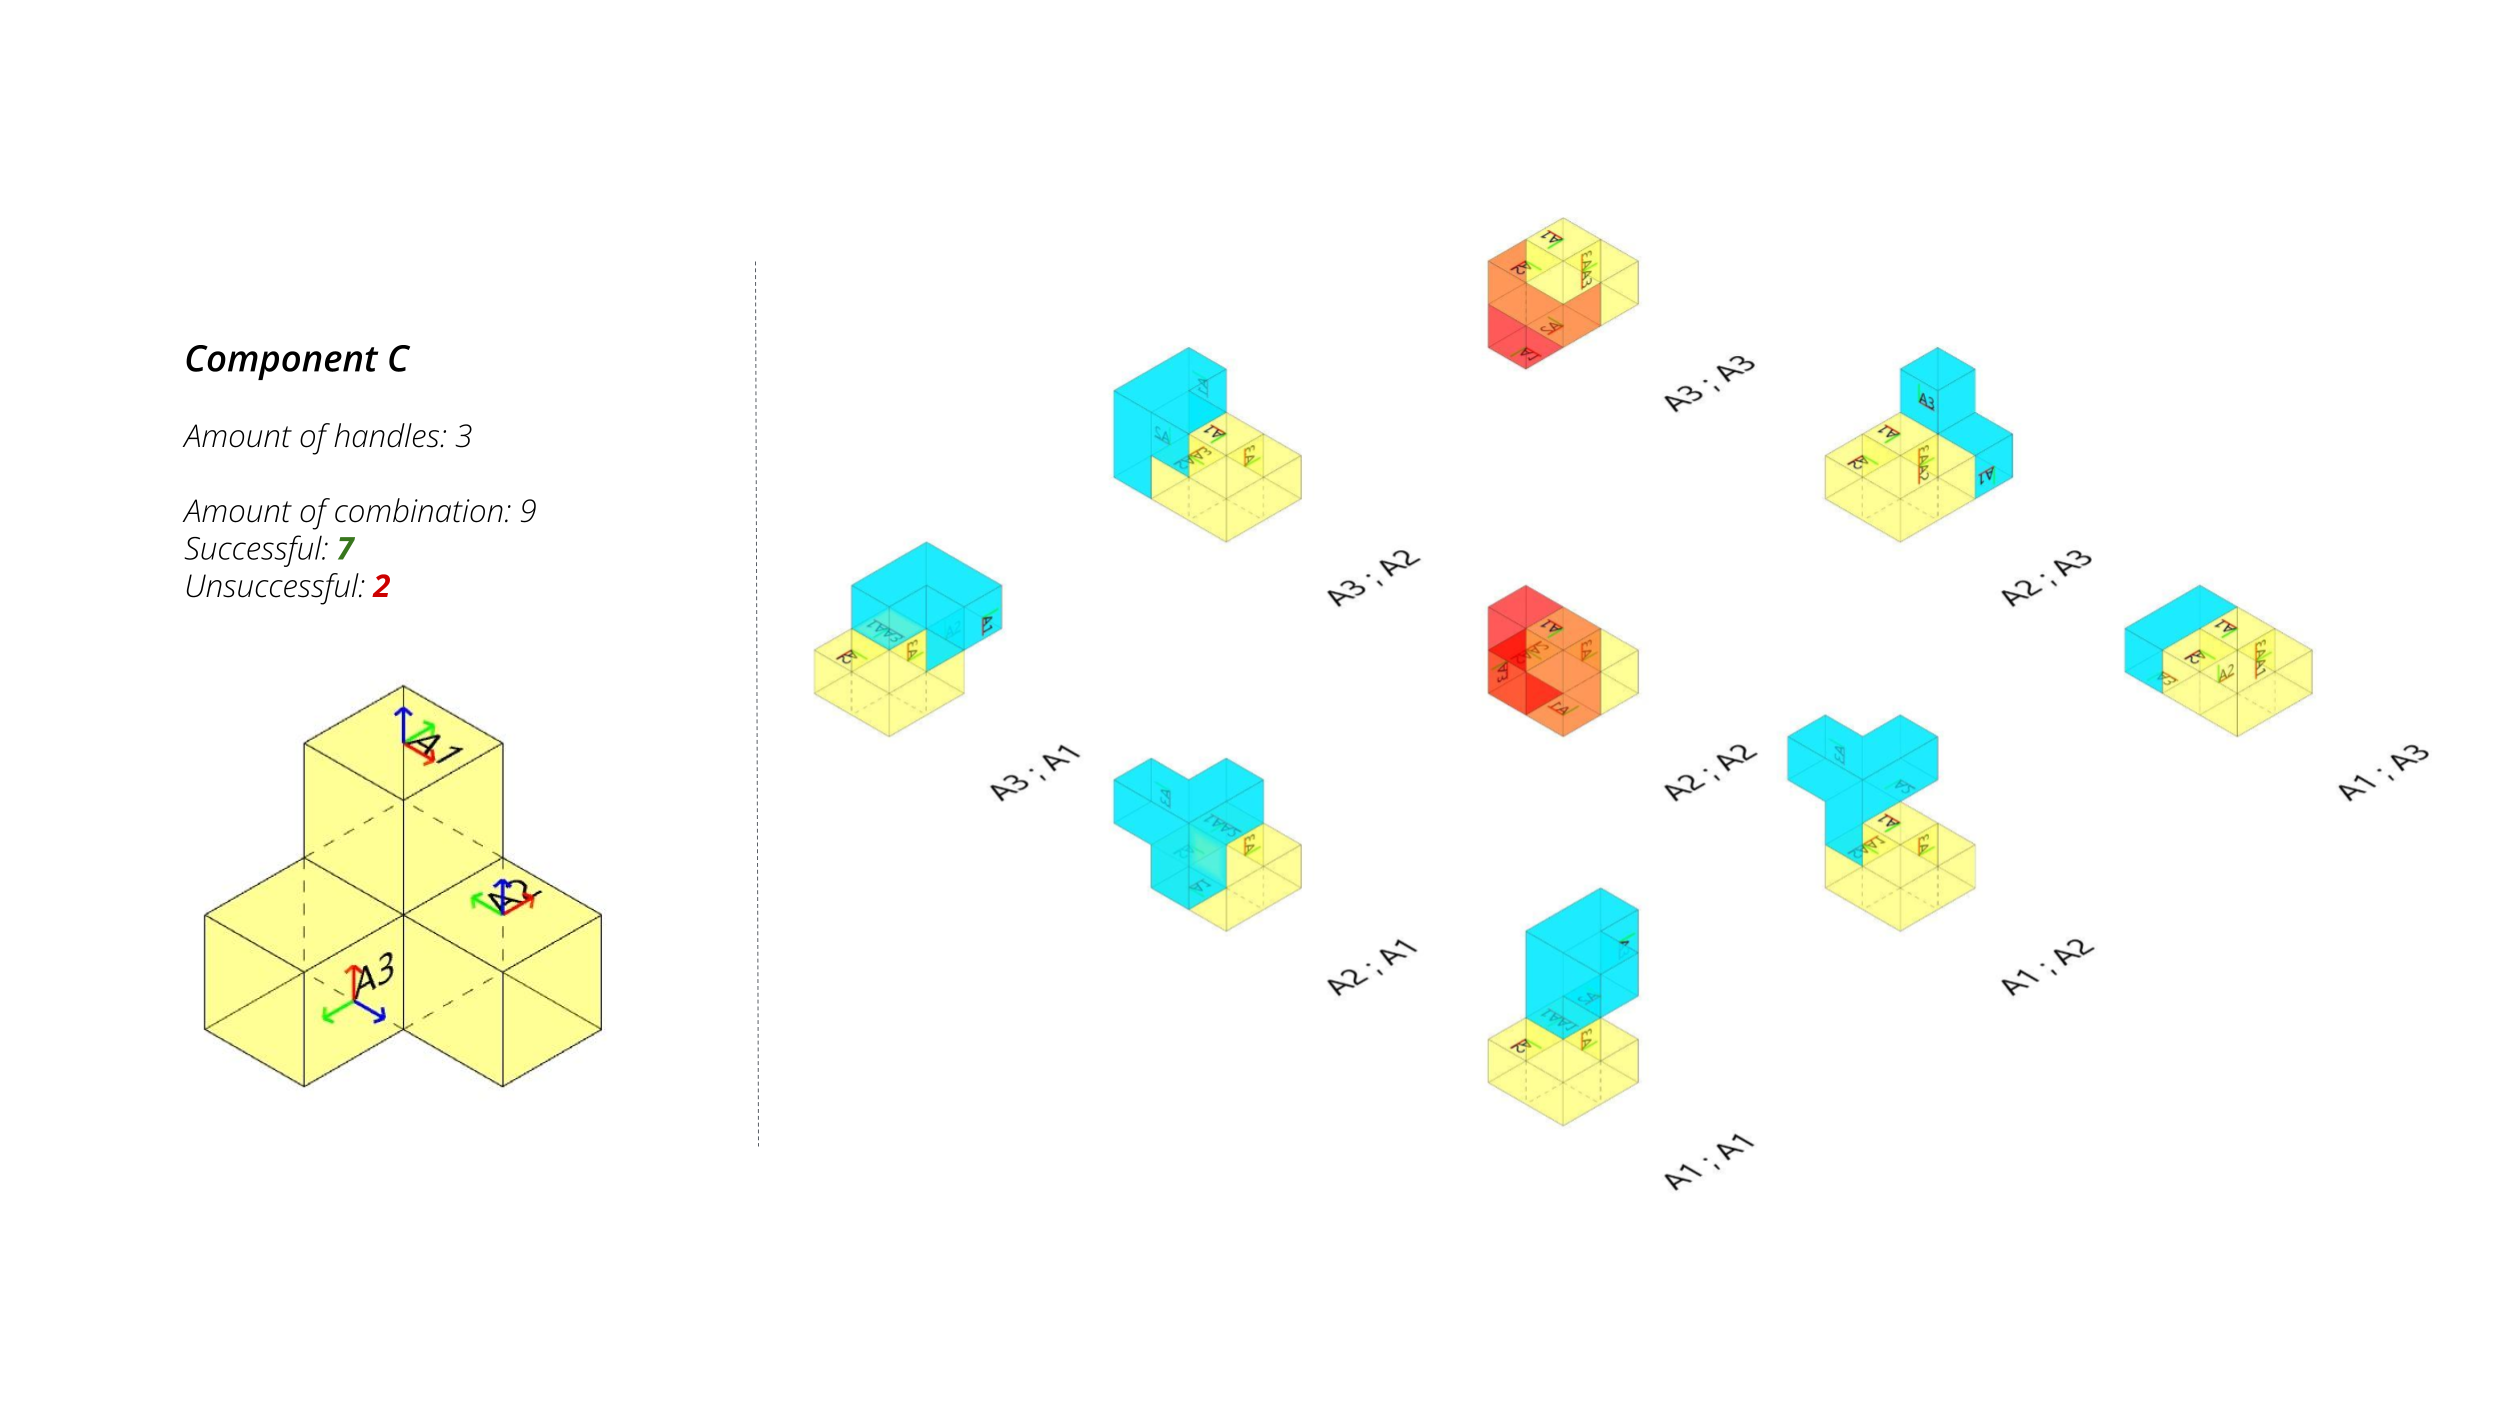
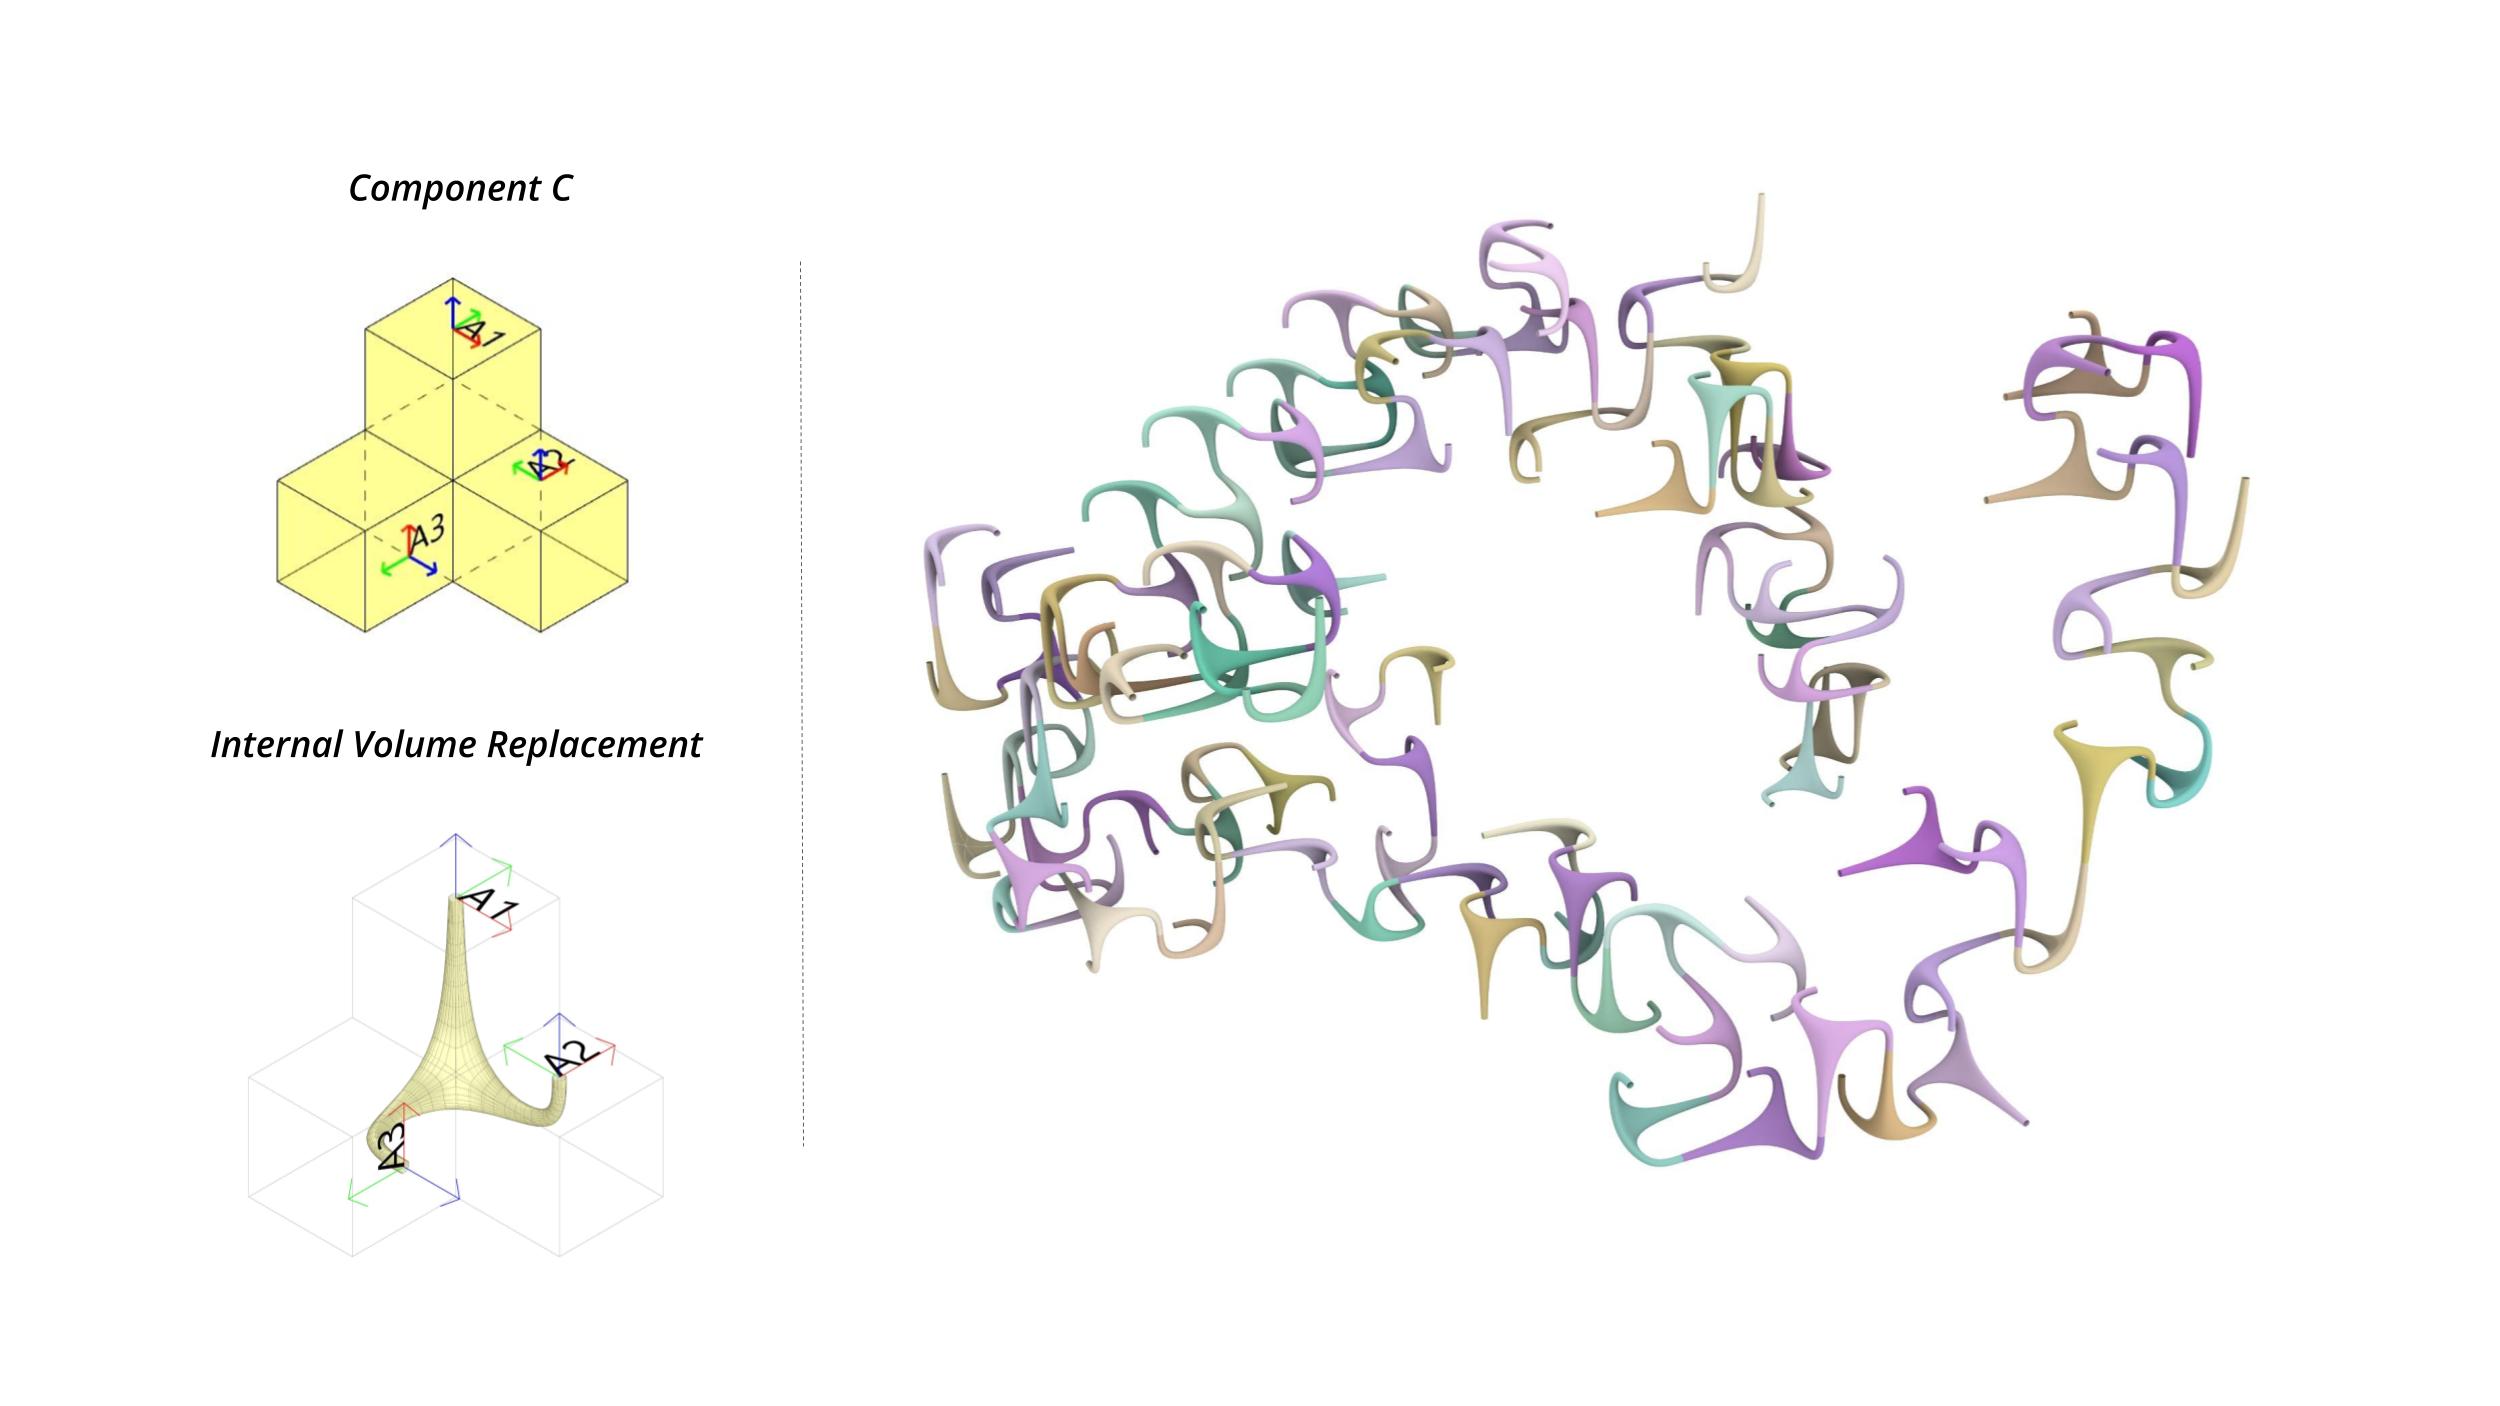
Component C
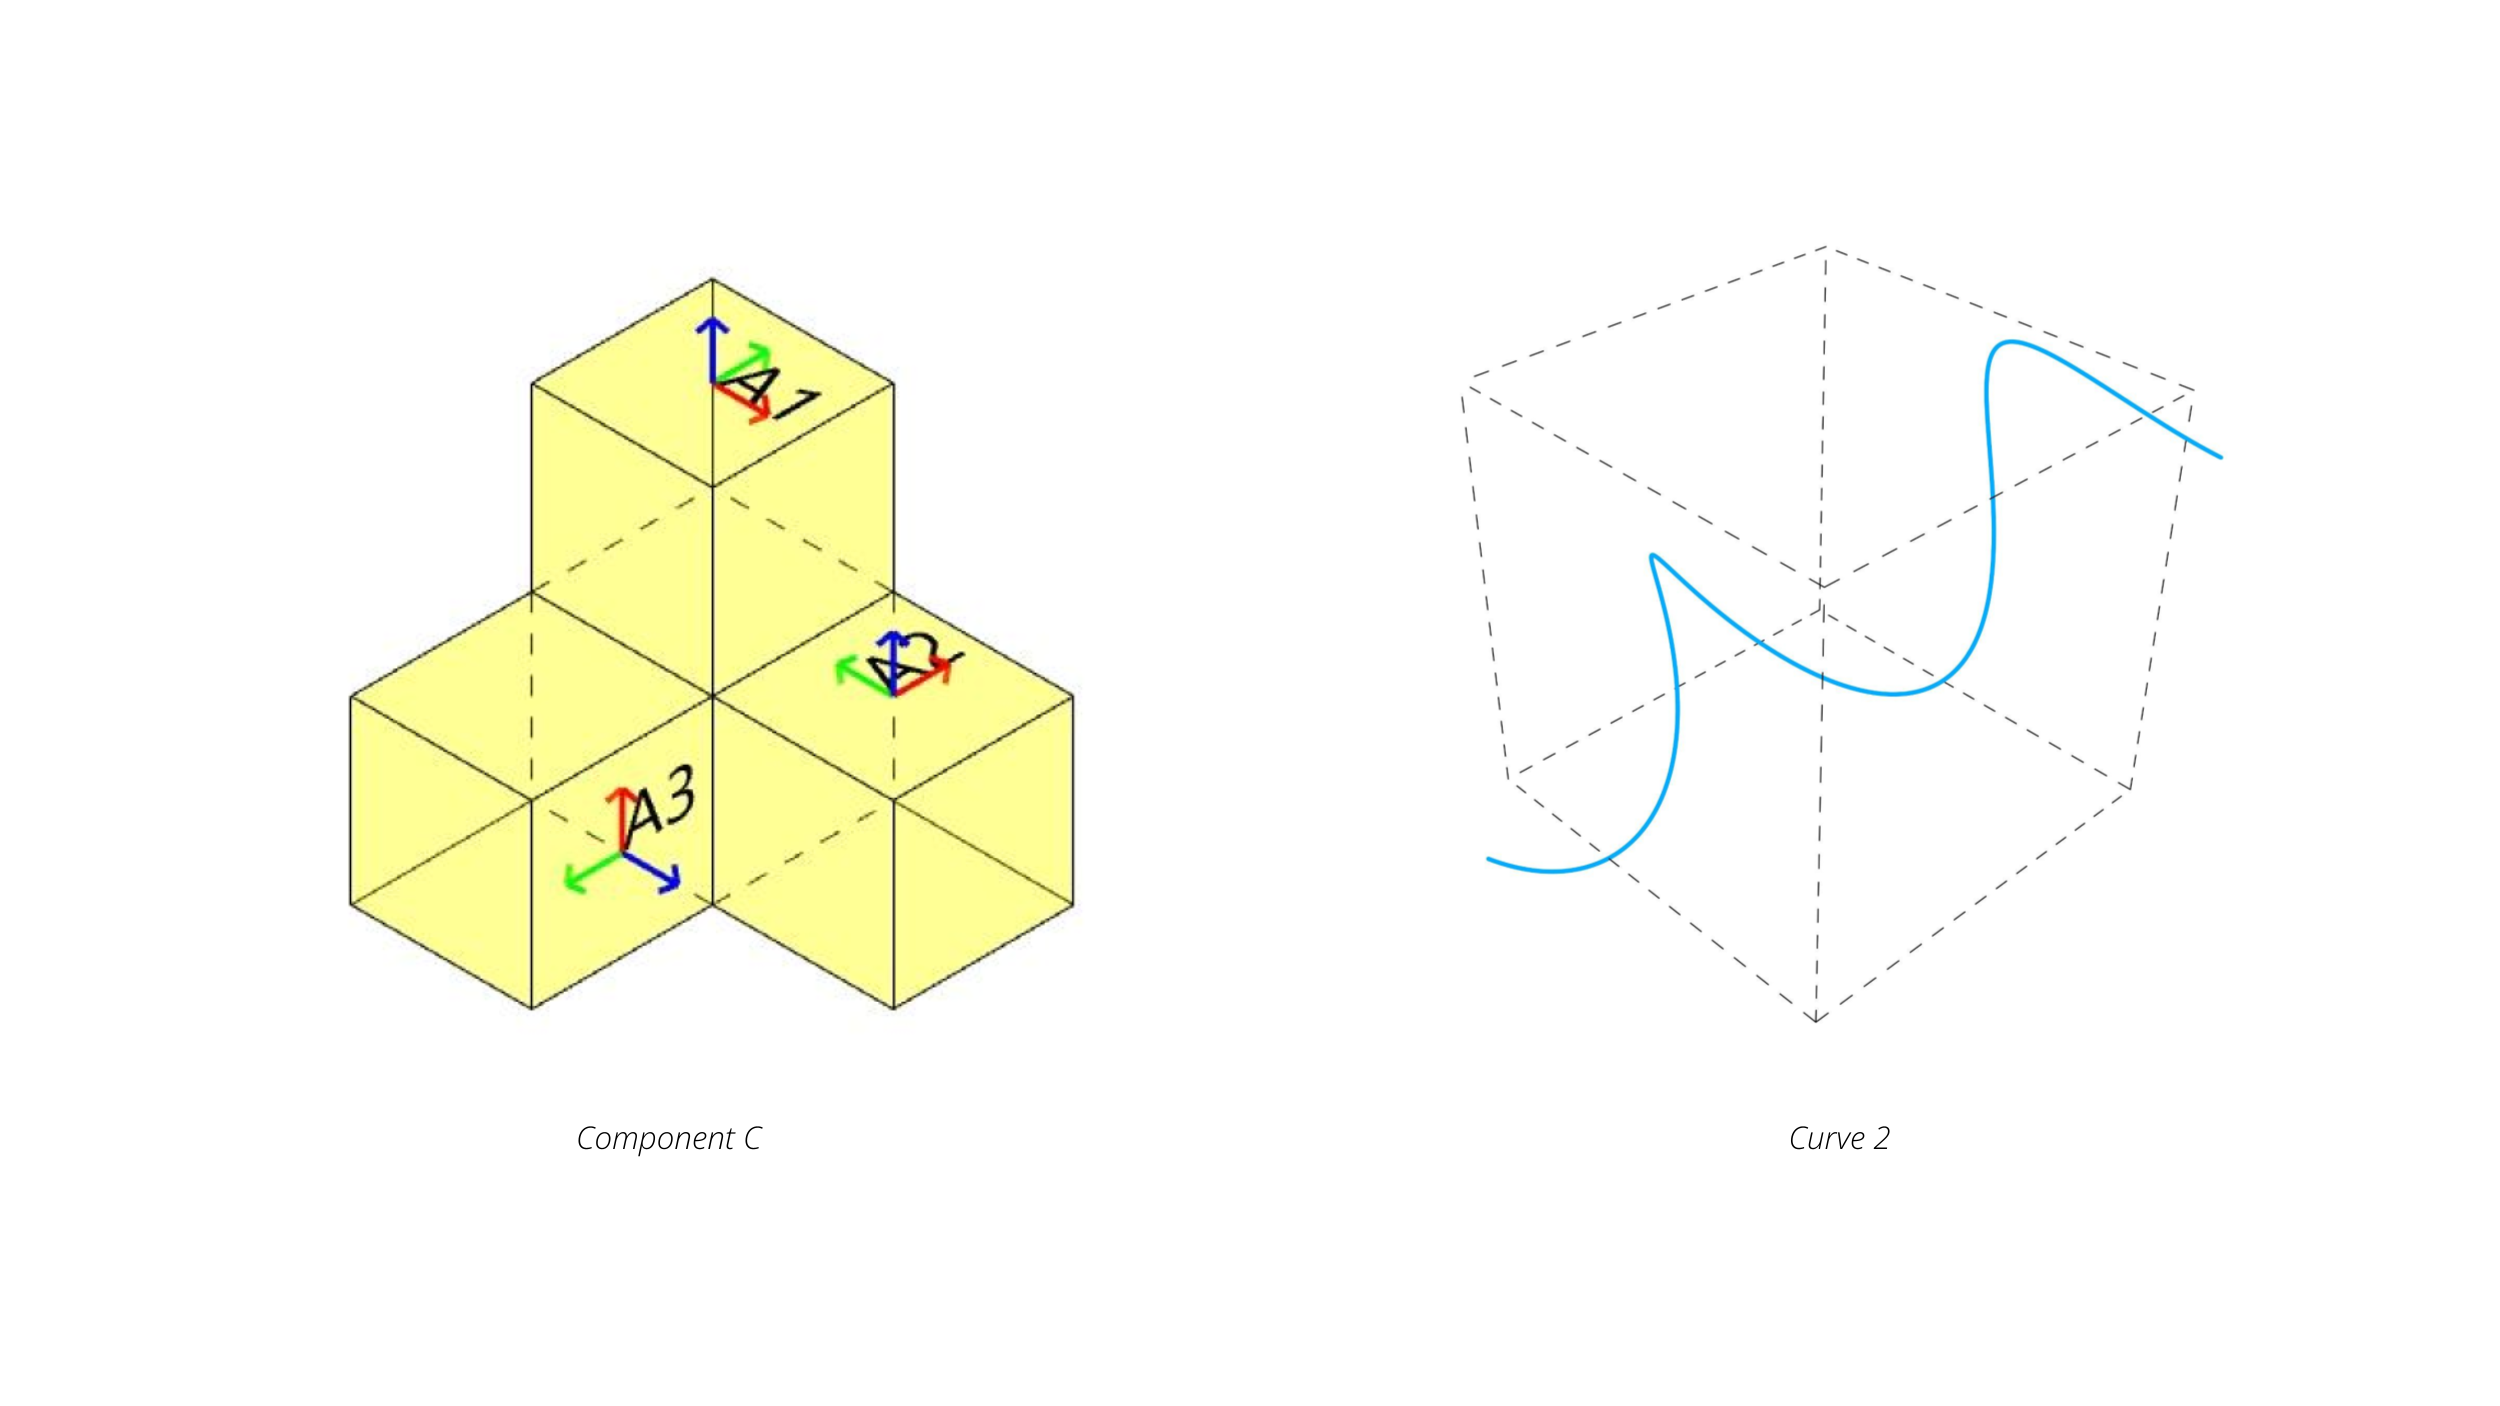
For the design of component C, 4 voxels and 3 handles were employed. A group of three frames were selected and a collision test was conducted. It was observed that the permutations had 2 collisions and 7 successful assemblages, in this instance due to the handles position the result is a dense and compact shape. Furthermore, we have investigated two alternative scenarios where the handle A2 has been rotated by 90°: in the first case a vertical growth pattern resembling parallel towers is obtained, while in the other, a densely populated and compact, yet linear, growth is achieved. Considering all three outcomes, the selected candidate for further evaluation is the one that displays a denser and more compact behavior, as it exhibits distinct characteristics compared to those previously chosen.
Iterative assemblage strategy – Exploration 1
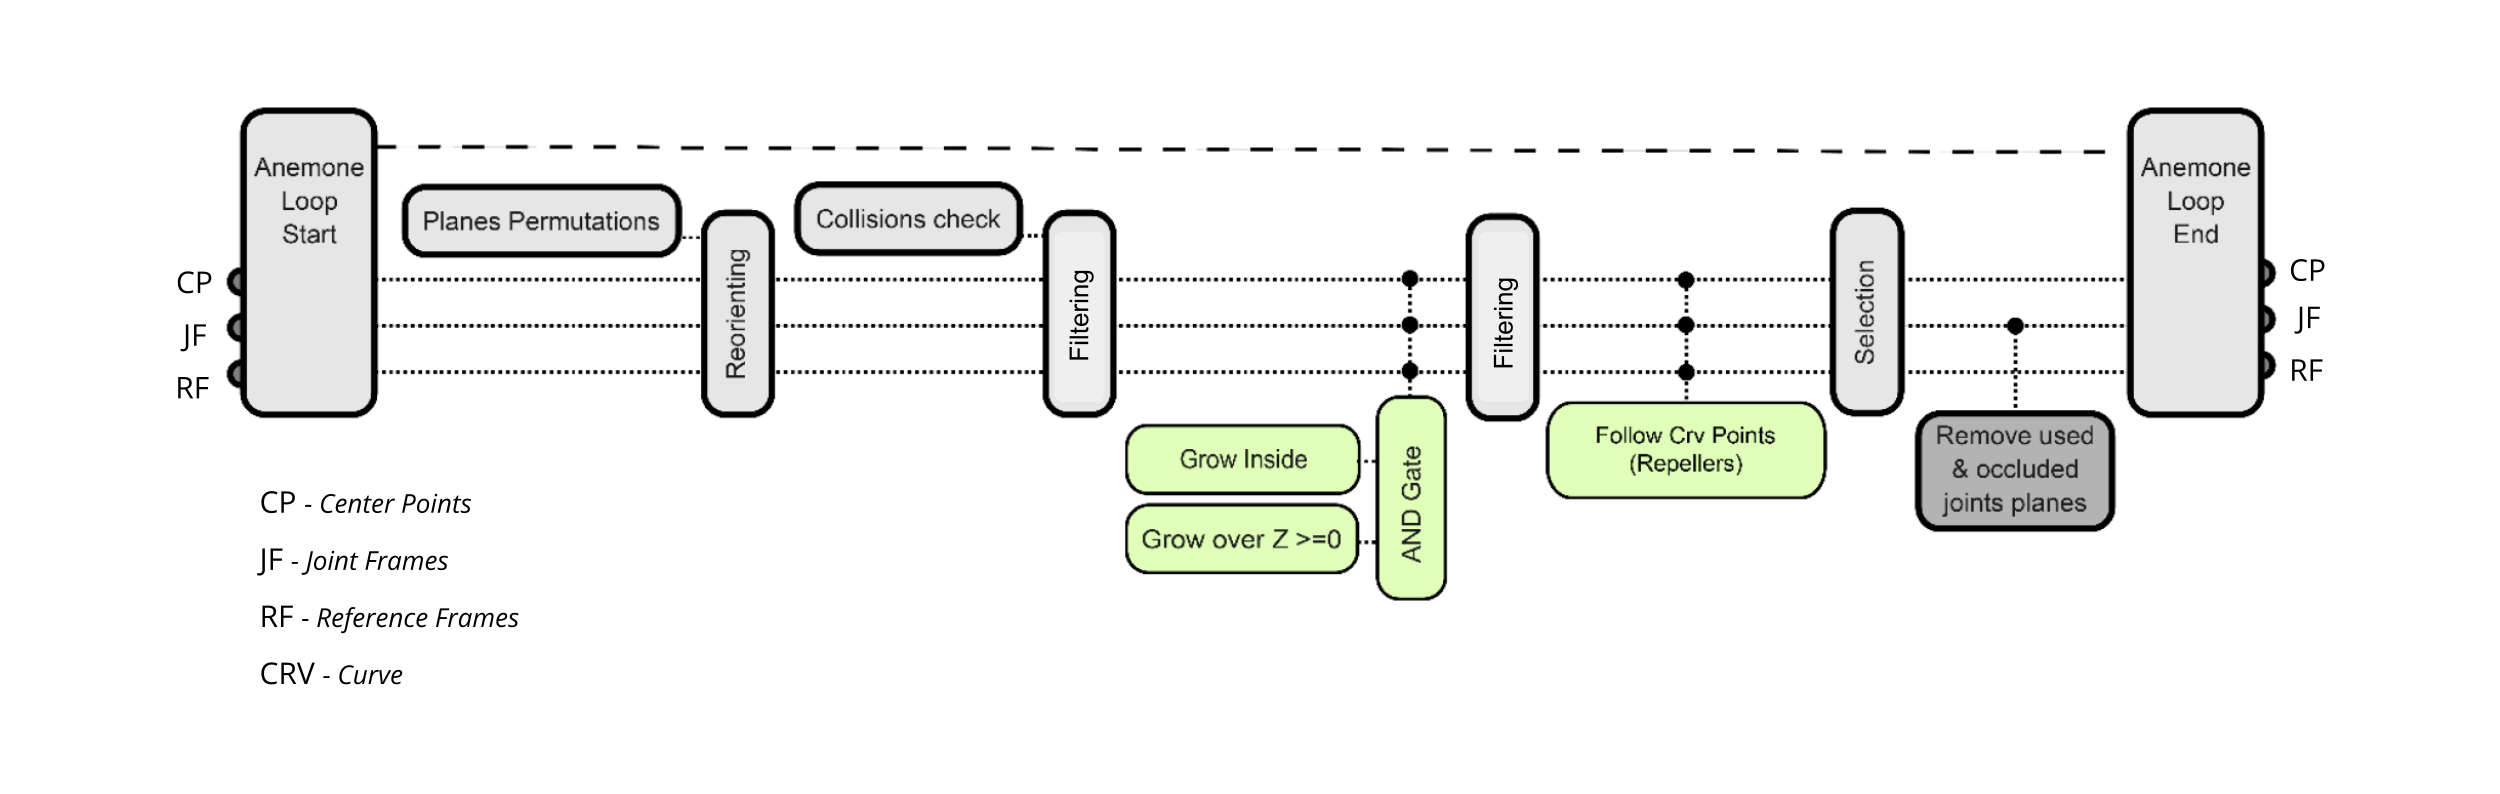
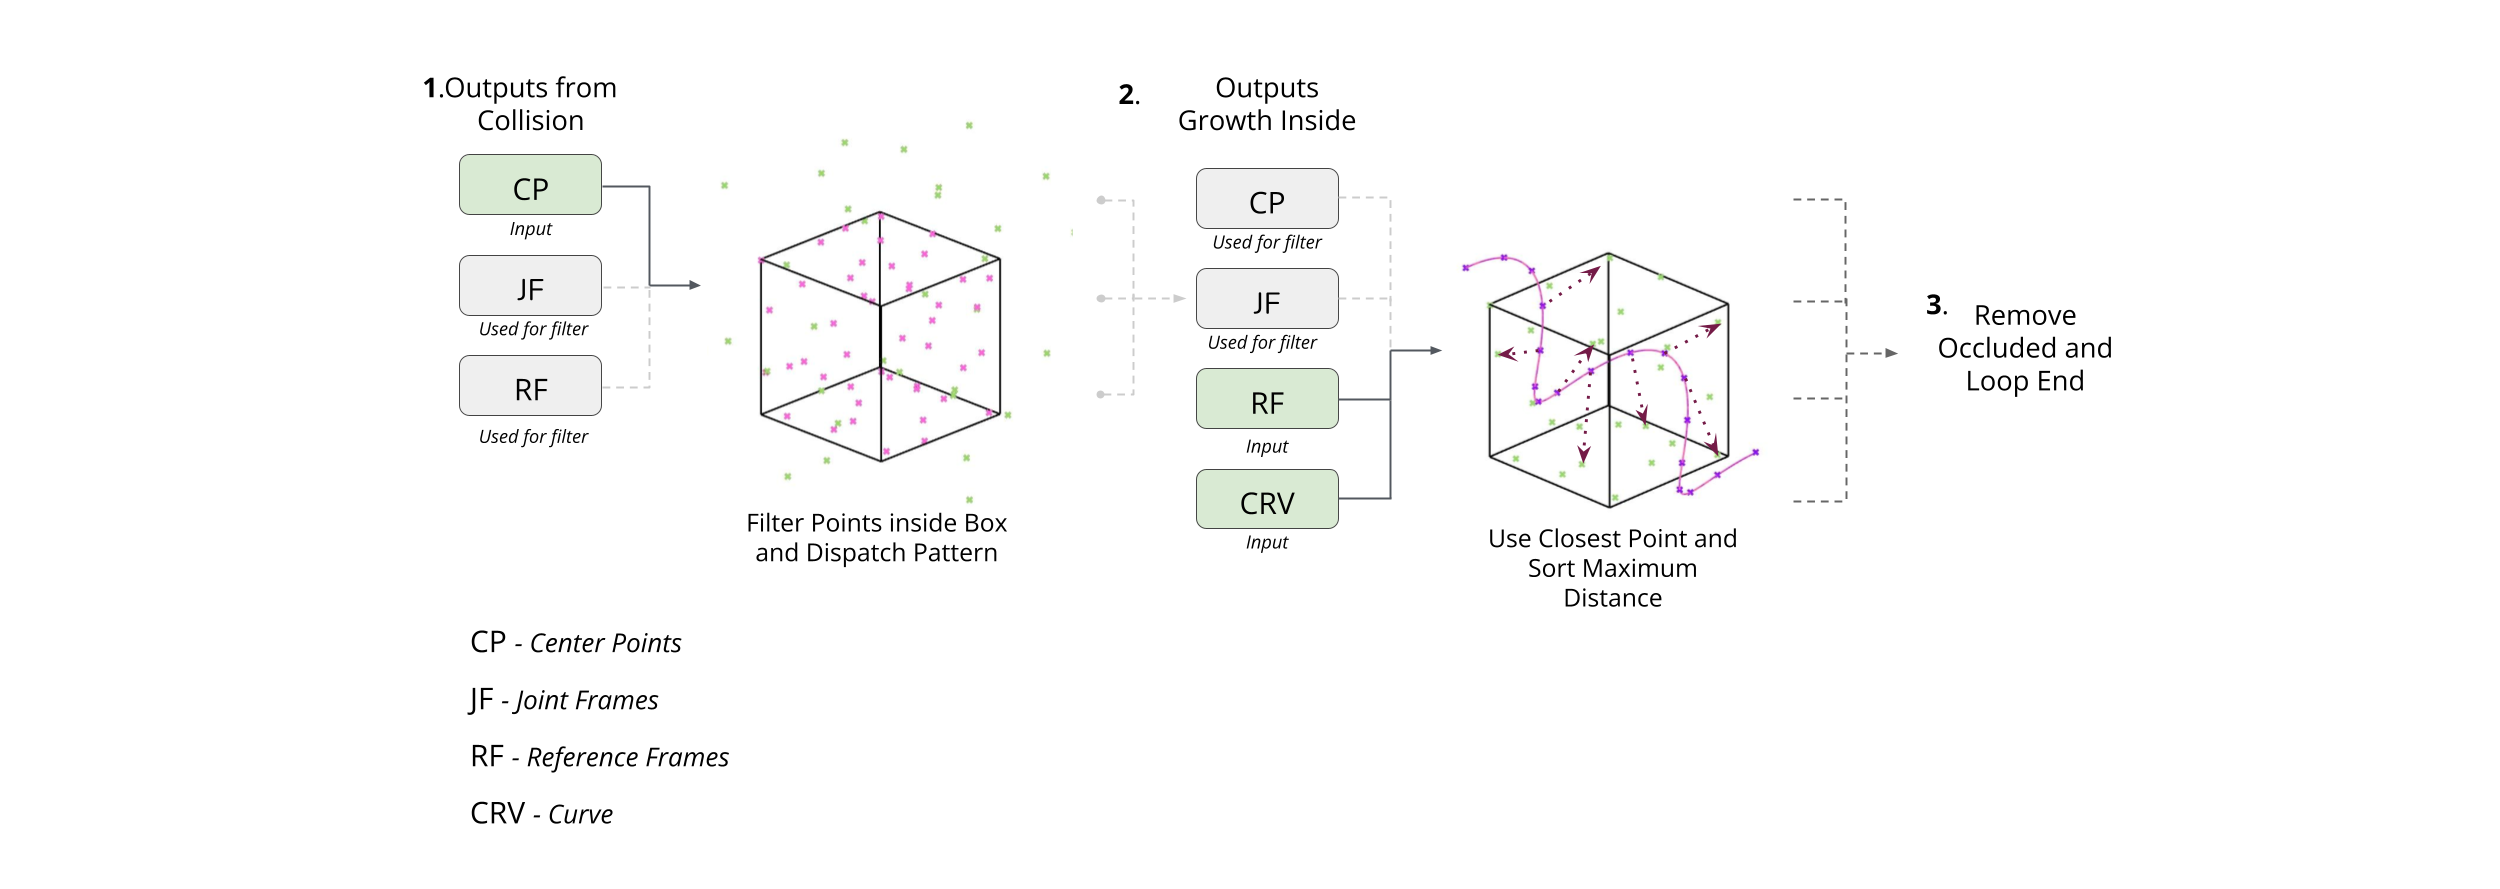
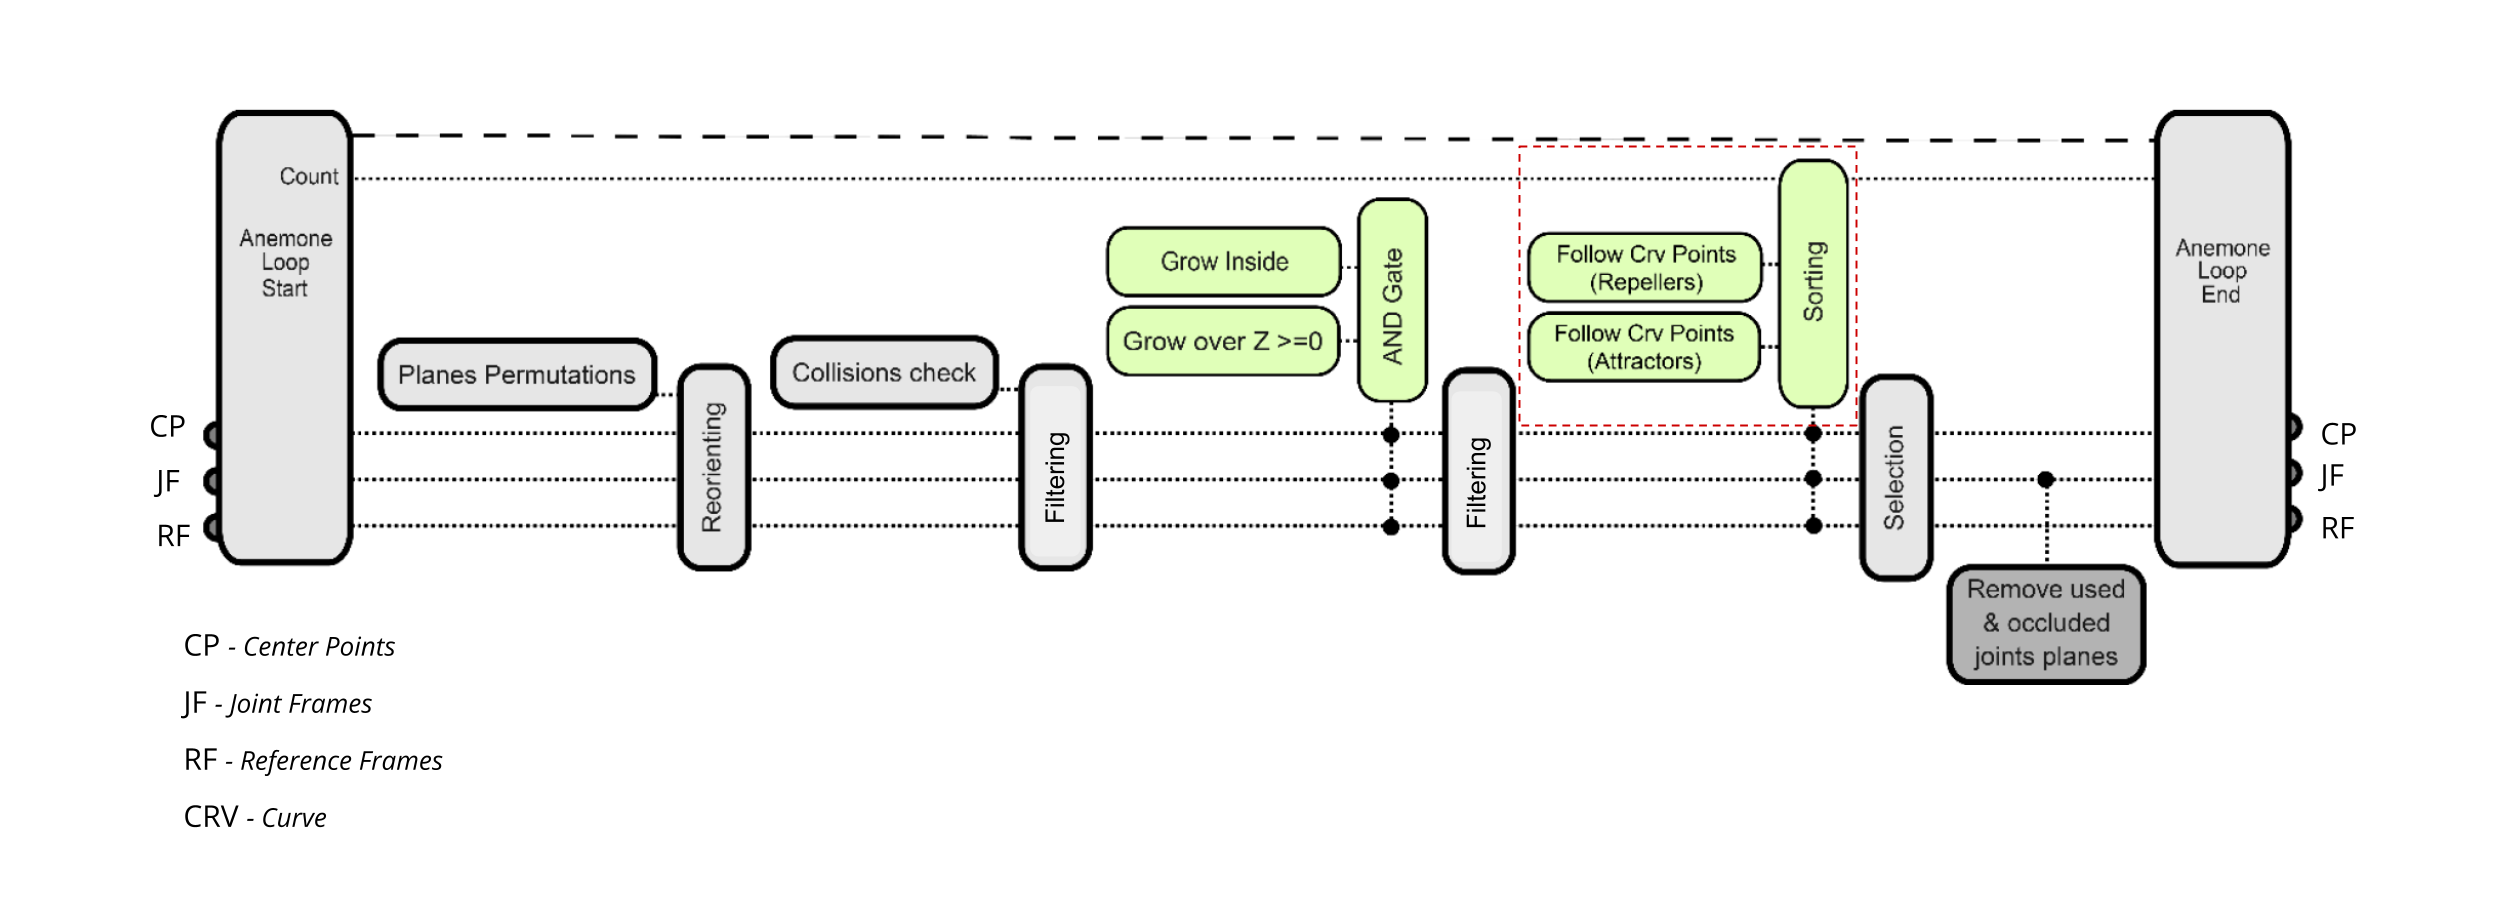
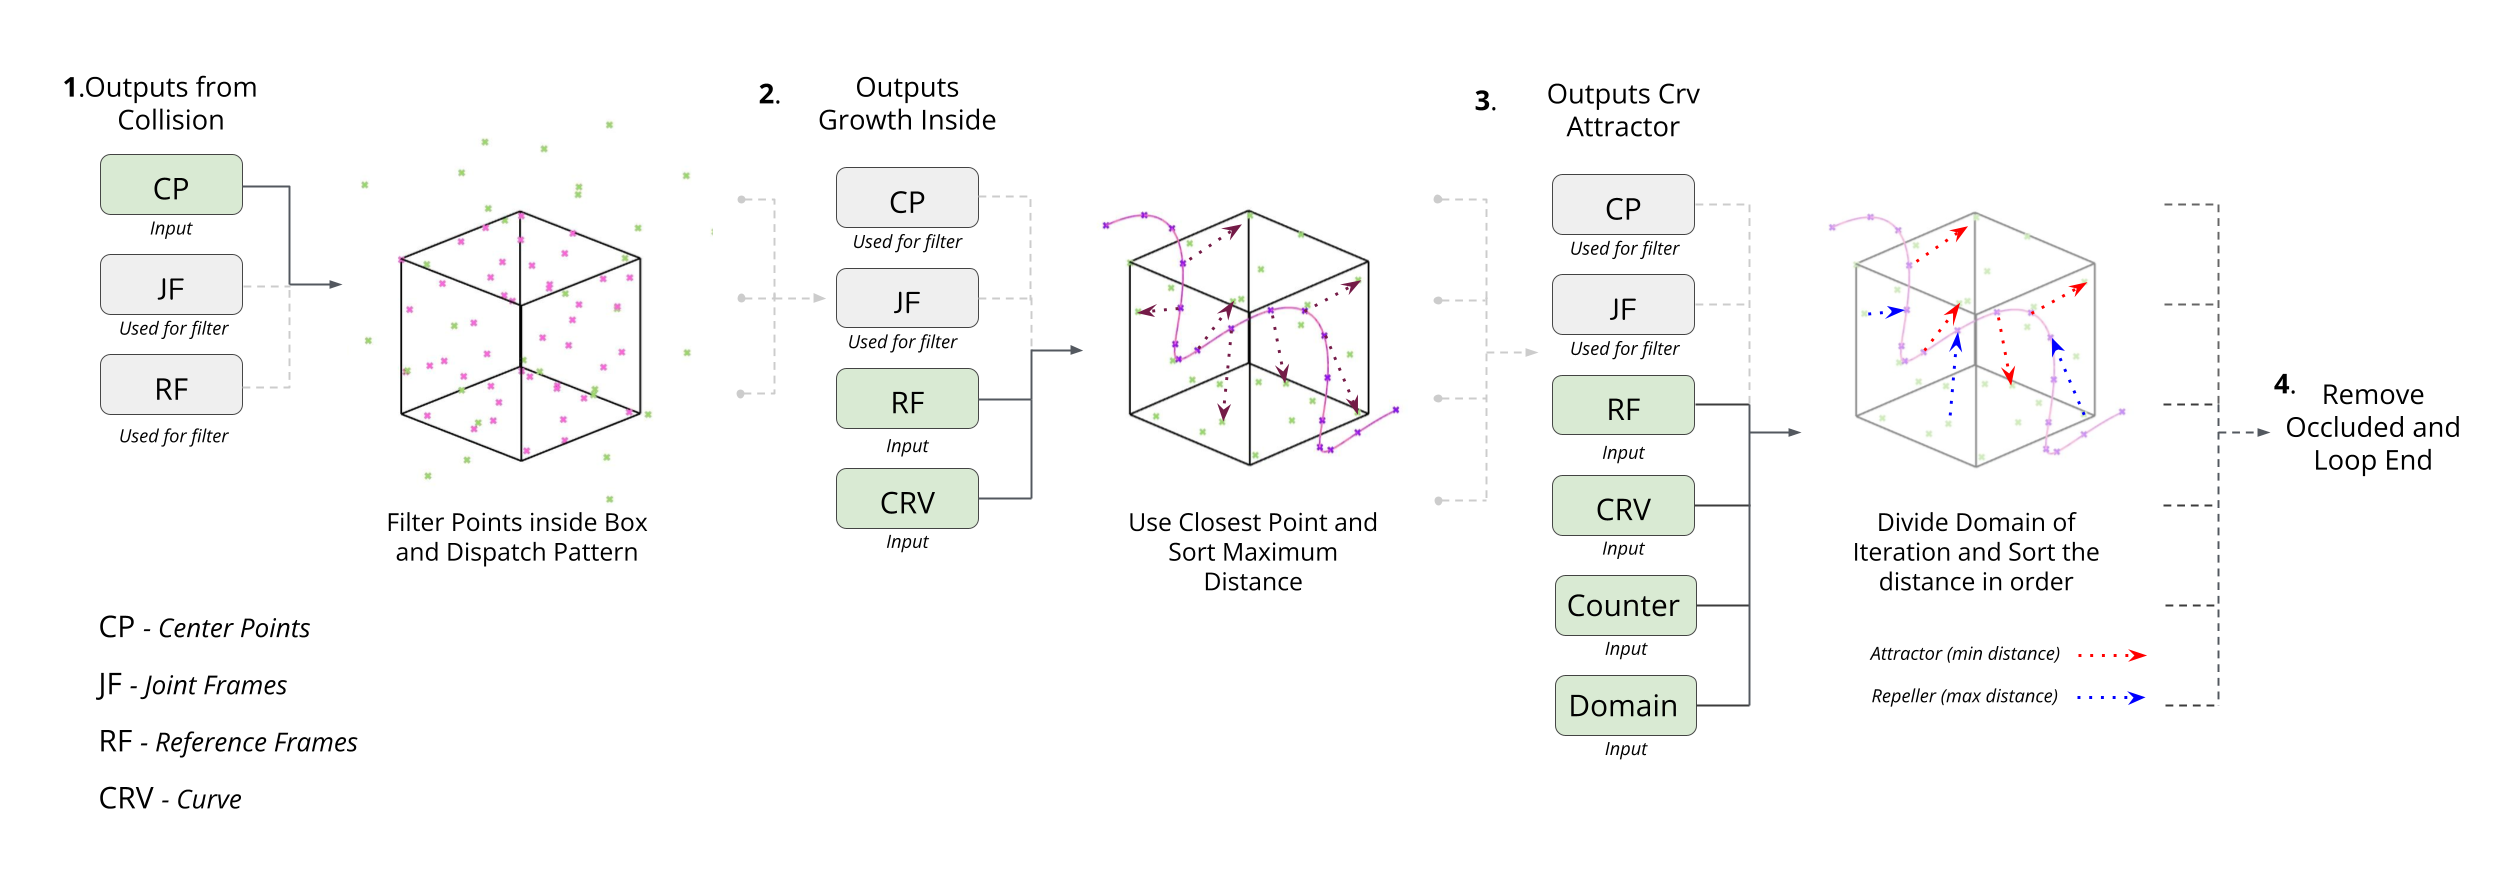
The iterative assemblage logic that is proposed is based on the assemblage behavior of the three components. In order to maintain a control on the growth of the pieces, two filters are applied to constraint it. The first one sets the growth to above zero on Z axis values, this constraint allows the assemblage to be close to the origin and adjust the model to be prepared to a robotic assembly (pick and place strategy). The second constraint puts our iterative assemblage in a boundary of growth, any geometry could be applied to limit the growth. This filter is applied in order to eliminate the possible assemblages that were growing vertically or linearly. Both of these filters utilizes the Center Points of the voxel as an input and with an Gate And it generates as an output new Center Points, Joint Frames and Reference Frames of our assemblage.
Subsequently, a third method of selection is applied in order to guide the growth according to the maximum distance between our Reference Frames and a new Curve applied to the algorithm. This new Curve as an input serves as a repeller of the assemblage of the voxels, orienting the growth to come closer to the boundary geometry. This selection is applied to generate assemblages with a void in the center. The output of this filter creates new Center Points, Joint Frames and Reference Frames that will be used as an input for the removal of occluded faces.
Experiments
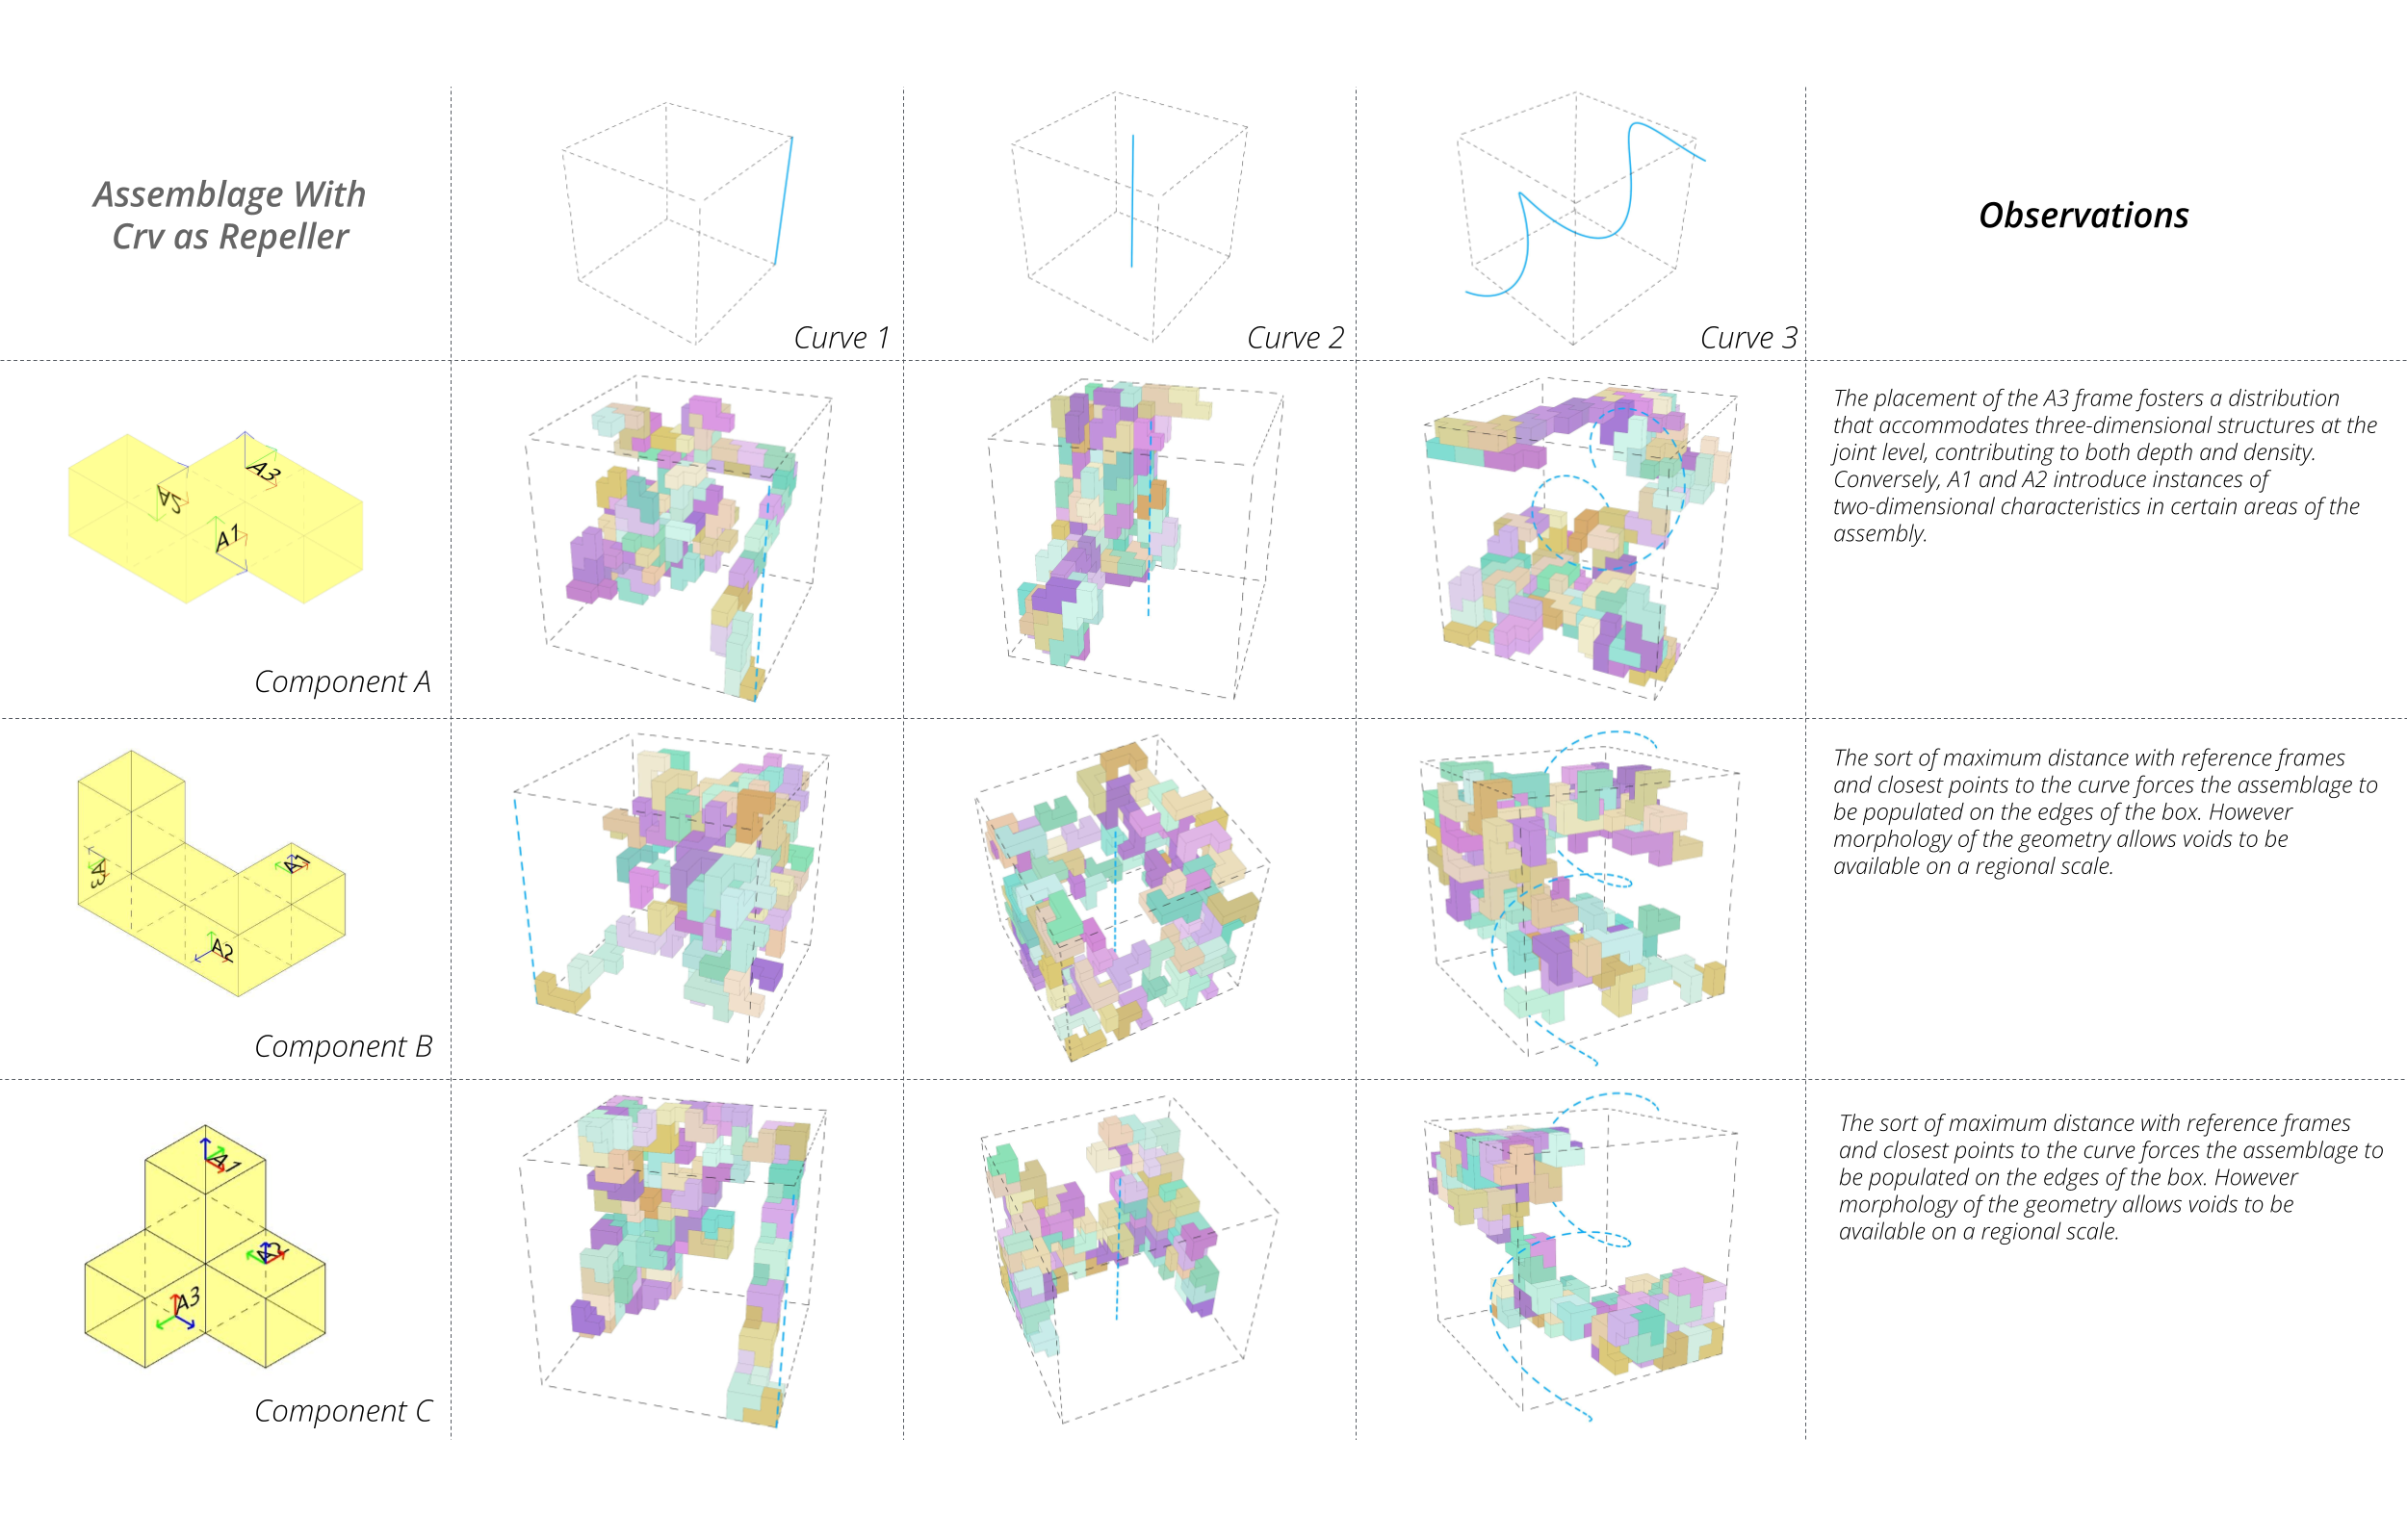
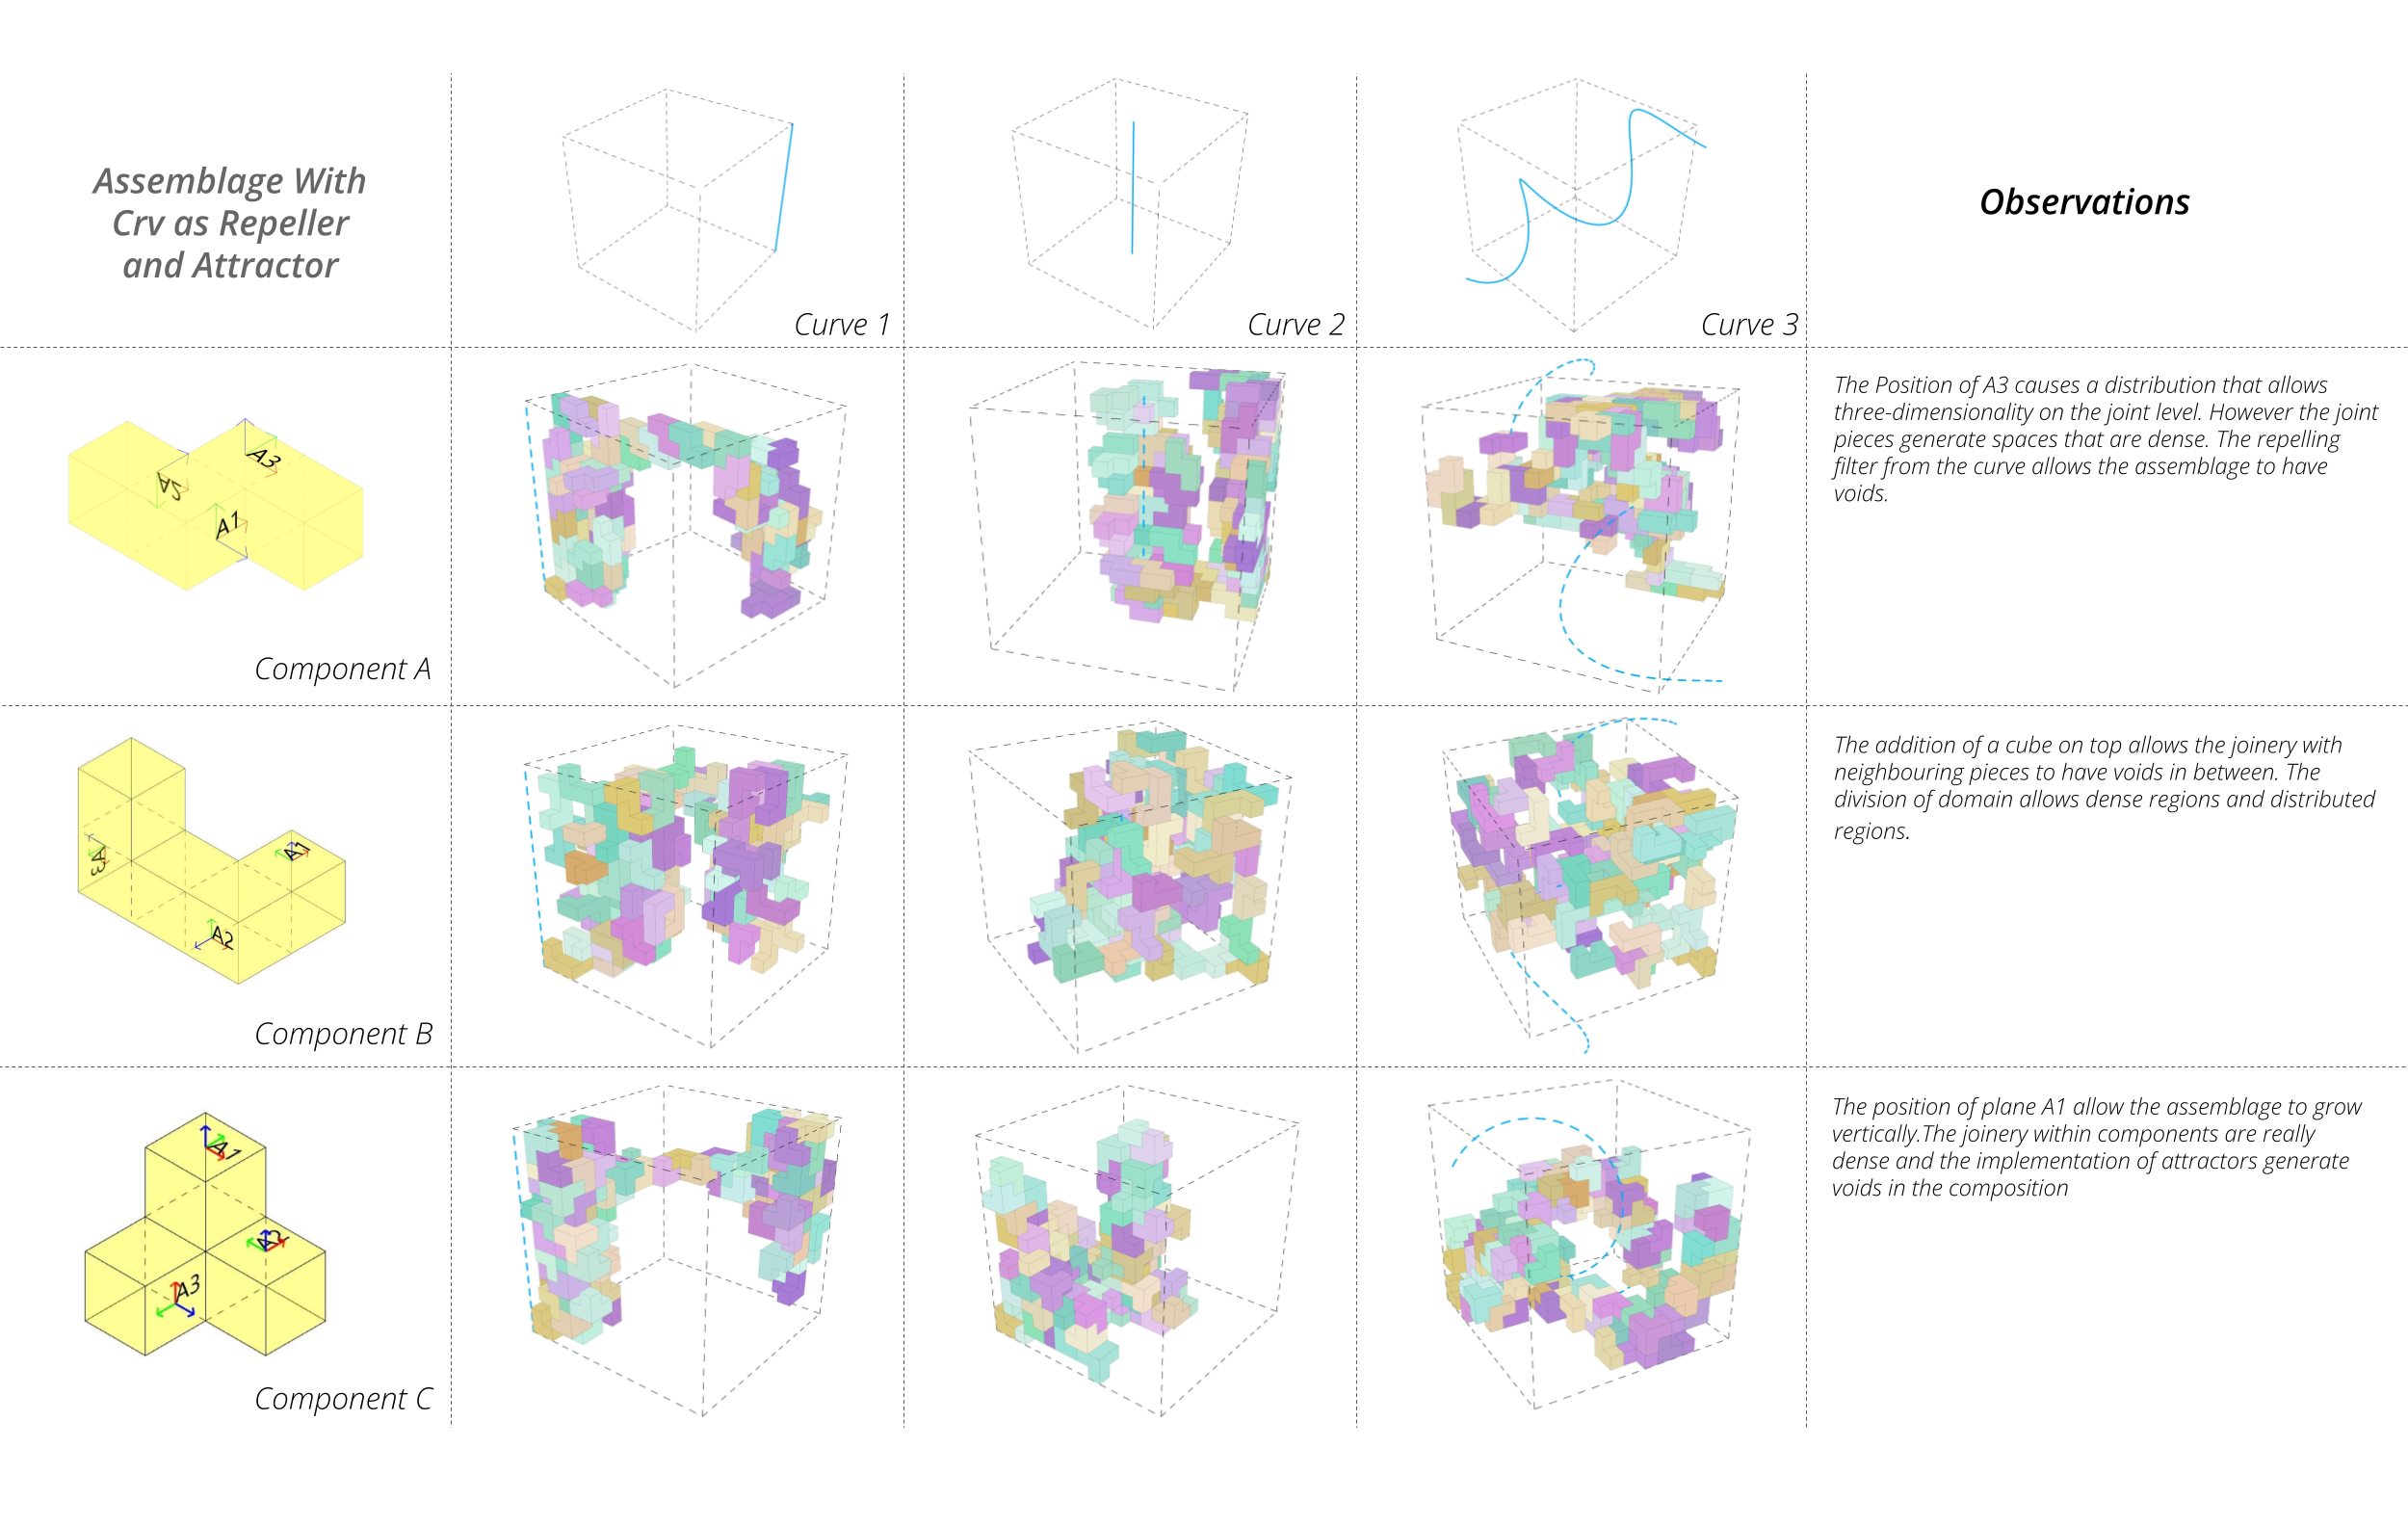
By conducting the experiment with the three components it is possible to observe that all the assemblages have a void on the center as a result of the repeller filter.
For component A, because of the position of the handles and the set of the geometry (not having a third block on top) the assembly on a regional scale is compact. Additionally, it is noticeable that on one of the last iterations the assemblage shifted from populating one area to start branching out to another area of the boundary.
For component B and C it is observable that as a result of the geometry (having one block on top of the geometry) the assembly on a regional scale has a degree of porosity. The position of handles of component B allows the assembly to have a longer path as the loop is being conducted. For component C, a similar behavior of branching out to another area of the geometry is also noticeable.
The position and the type of curve that is being tested is the main parameter that influences the geometrical behavior of the assemblage.
Iterative assemblage strategy – Exploration 2
After conducting the first set of experiments, a new iterative assemblage strategy is proposed in order to generate variation within the behaviors of the assemblage. The new strategy is an extension of the last one, and it divides the domain of iterations (Counter) in four groups. On each group the Reference Frames utilizes the Curve as a Repeller or as an Attractor. This new selection filter uses a Counter and a Domain as added inputs and returns as an output filtered lists of Center Points, Joint Frames and Reference Frames that will be used as an input for the removal of occluded faces.
Experiments
By conducting the experiment with the three components it is possible to observe that all the assemblages have a dual behavior of assembly. The first one being areas that are attracted and closer to the Curve and other areas that are further away from Curve. Considering the different geometries and position of the handles, this dual behavior presents itself distinctively according to geometries, position of curve and type of curve.
For component A, the position of the handles and the set of the geometry (not having a third block on top) the assembly on a regional scale is compact.
For component B and C it is observable that as a result of the geometry (having one block on top of the geometry) the assembly on a regional scale has a degree of porosity.
The assemblage for component B presents a distributed composition because of the position of the handles and the geometry of the component.
Further experimentation
Additional experiments were performed, focusing on the modification of the bounding box shape, particularly exploring the application of a toroidal configuration. Subsequent analysis revealed a notable increase in the assembly’s density when exclusively exposed to repulsive forces.
Conversely, with the introduction of a combined influence of both attractive and repulsive forces within the system, a discernible transformation in the assembly’s dynamics became evident. Significantly, the inclusion of attractive forces introduced a novel dimension to the assembly, leading to the emergence of distinct voids and resulting in a more evenly distributed structure. This shift in force dynamics holds particular research interest, shedding light on the intricate interplay between attractive and repulsive forces within our system and their influence on the overall spatial arrangement of the assembly.
Chosen geometry
Ultimately, after careful consideration, the decision to select the spiral curve and incorporate component C as the designated output was ultimately made. Thanks to the component’s frames’ strategic positioning and its design, this choice serves as a highly illustrative and visually compelling embodiment of the complex interplay between attractive and repulsive forces inherent to the curve. In the following animated GIF, you can witness a step-by-step progression of our assembly’s development. It begins with an initial phase marked by attraction, followed by a subsequent repulsion phase, culminating in a stage where attraction and repulsion interact harmoniously. This visual representation effectively illustrates the complex forces at play within our design.
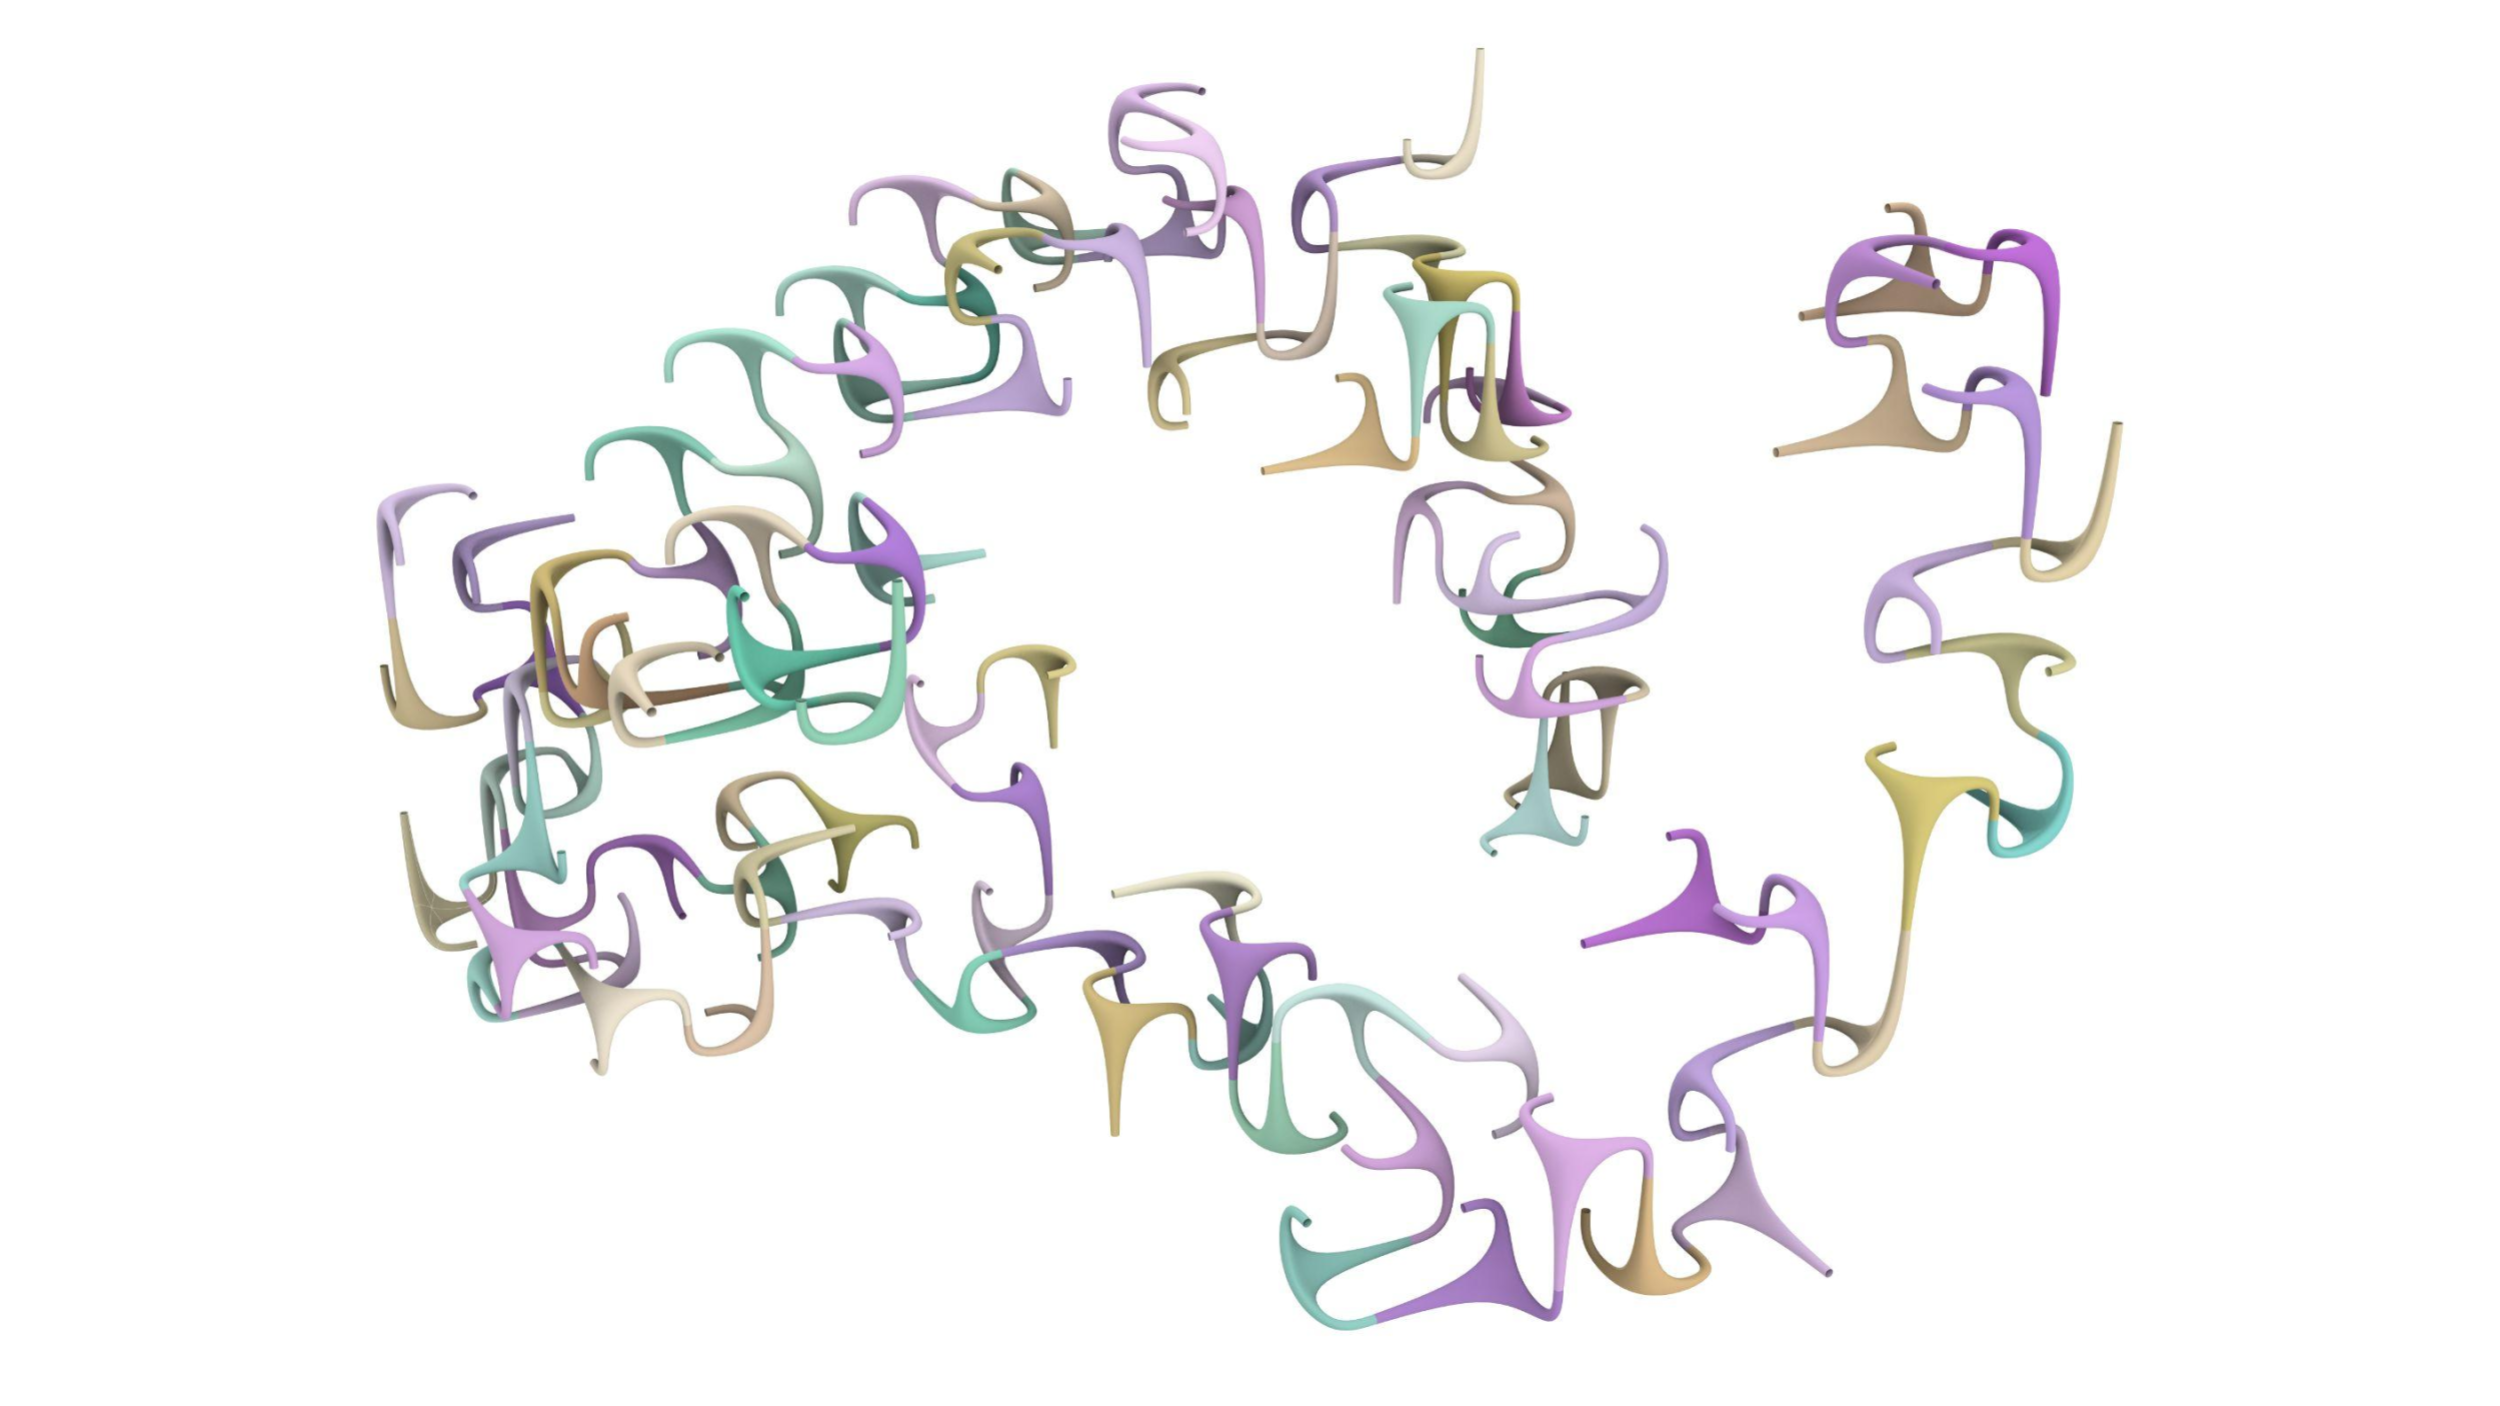
Internal volume replacement
In our proposal of internal volume replacement within the voxel, the aim was a design piece that utilizes the Joint Frames with a circular profile with minimum radius. The subsequent circular profile increases the radius gradually until it reaches its maximum diameter. This strategy allows our design piece to have different volumetric areas and seamlessly interconnected patterns among the components.
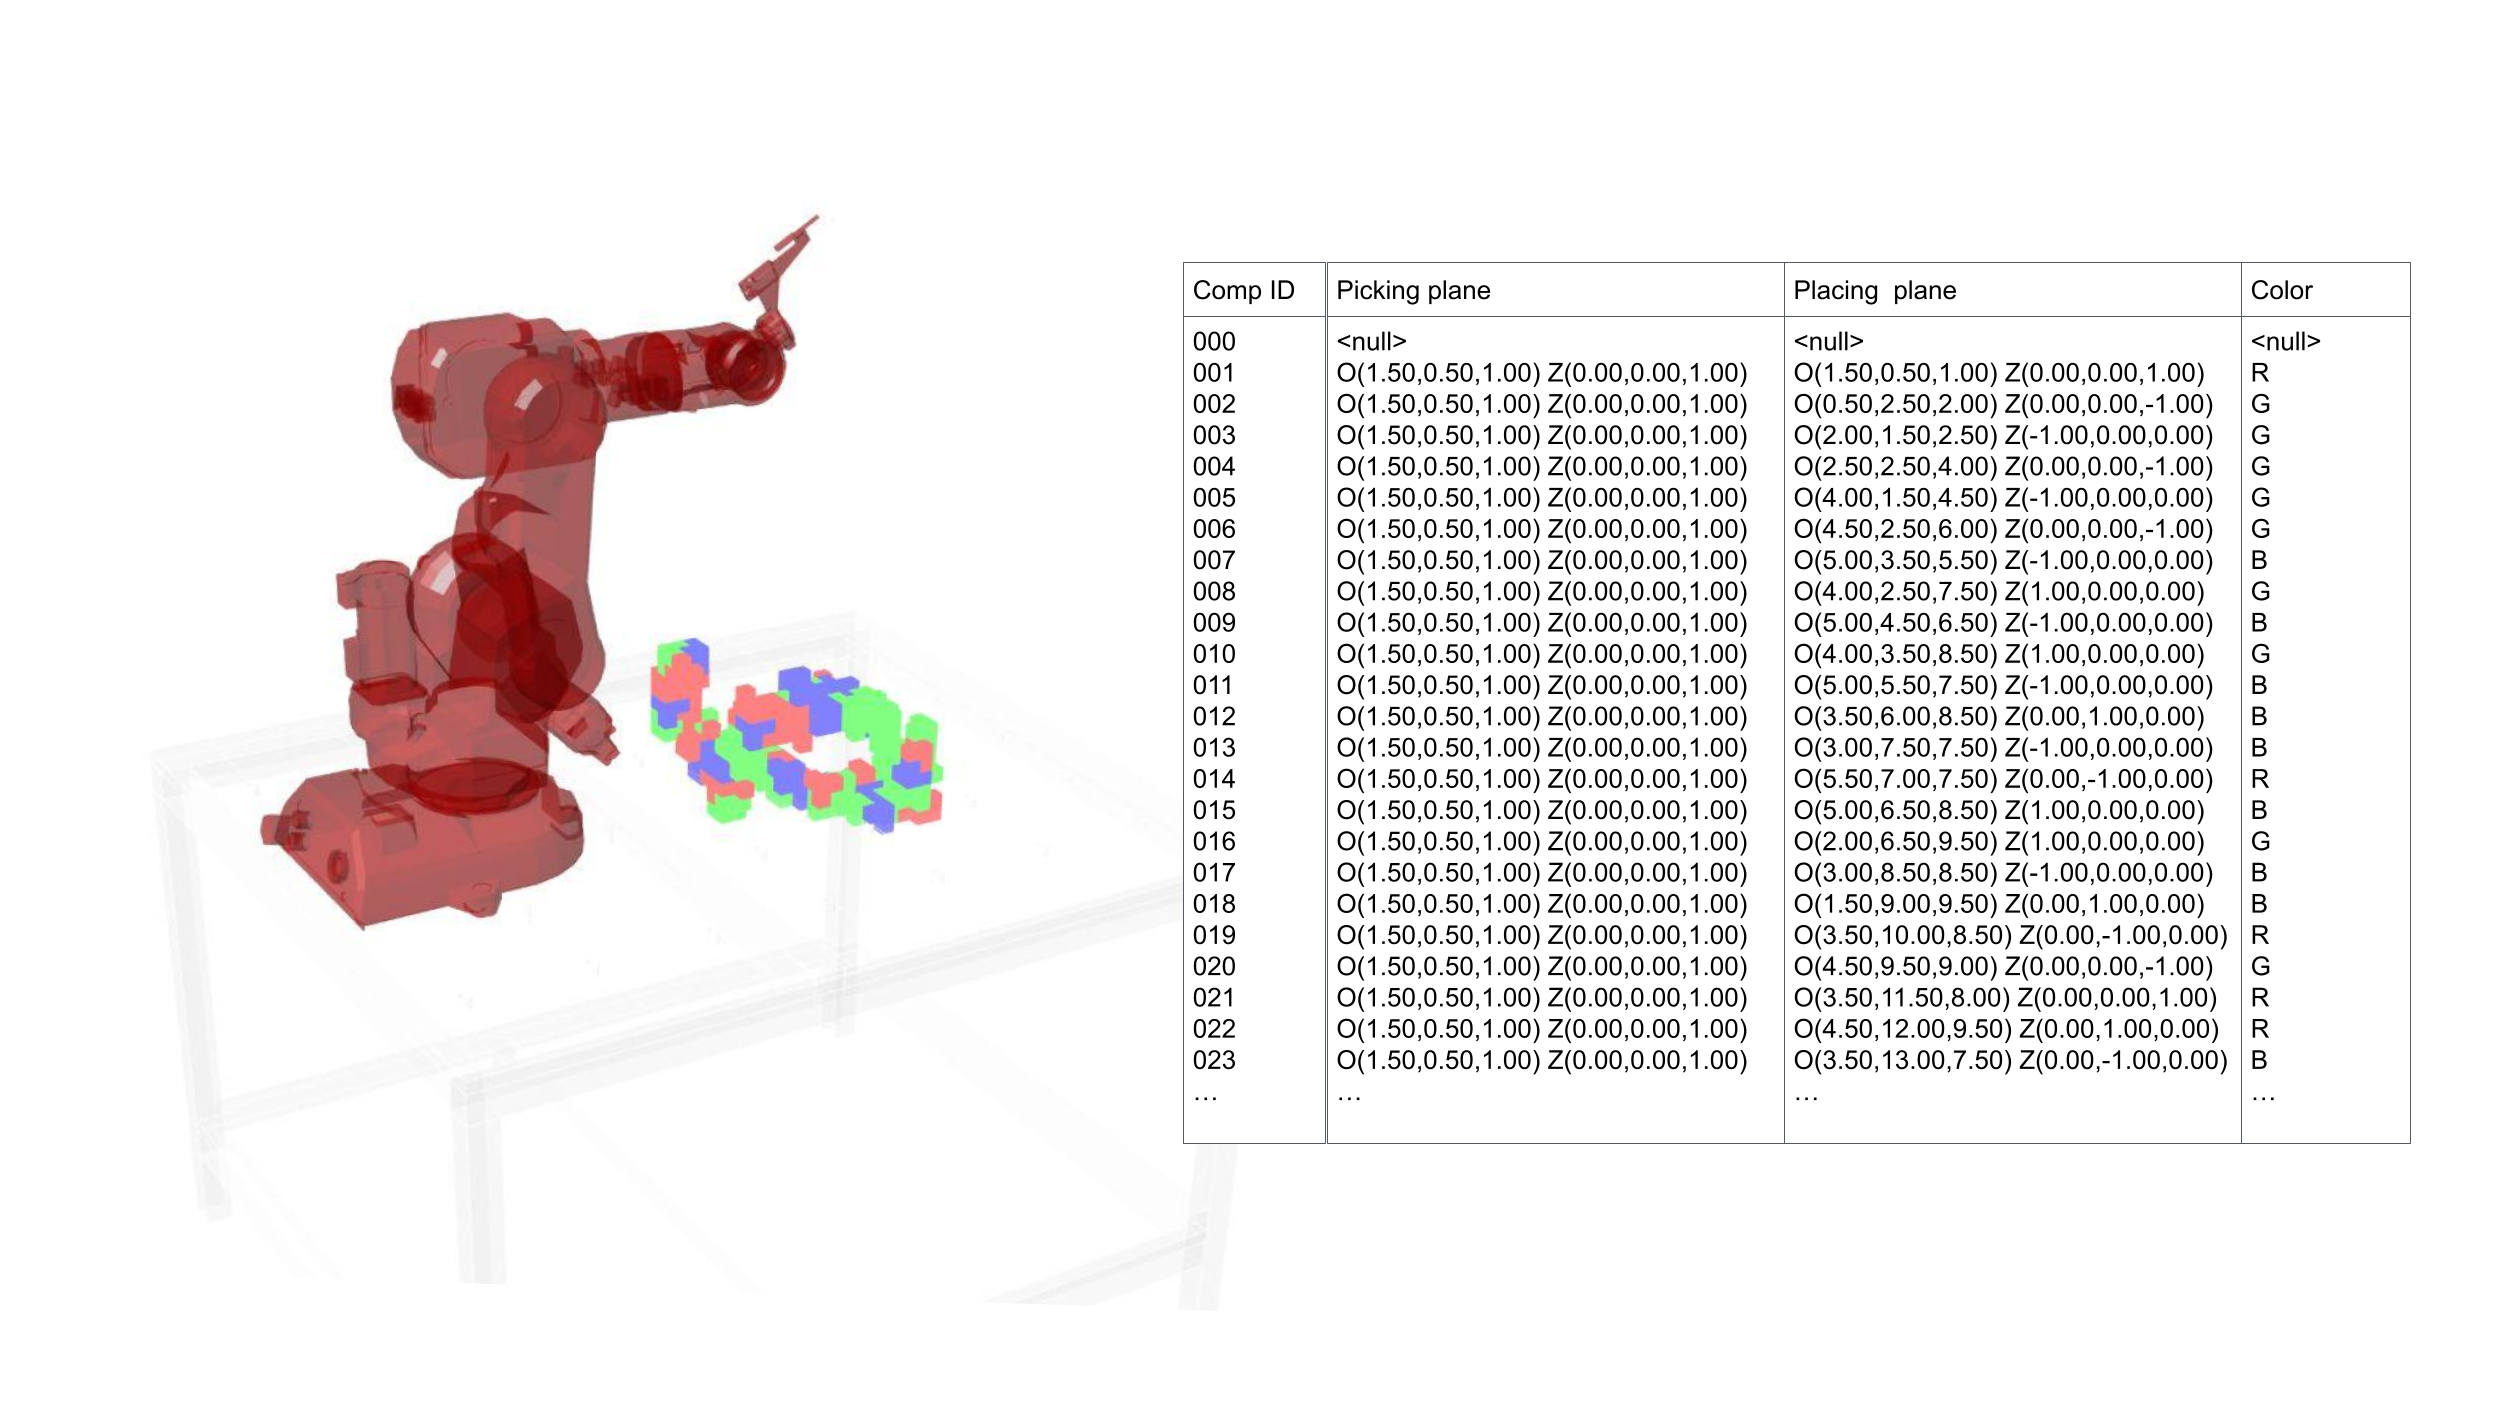
Robotic assembly: Pick and Place
In considering the potential integration of robotics into our assembly, we have pursued a systematic approach aimed at achieving precise component selection and placement to create the desired pattern. To support this effort, we introduced an auxiliary framework labeled “A4”, serving as the dedicated picking frame for all assembly components.
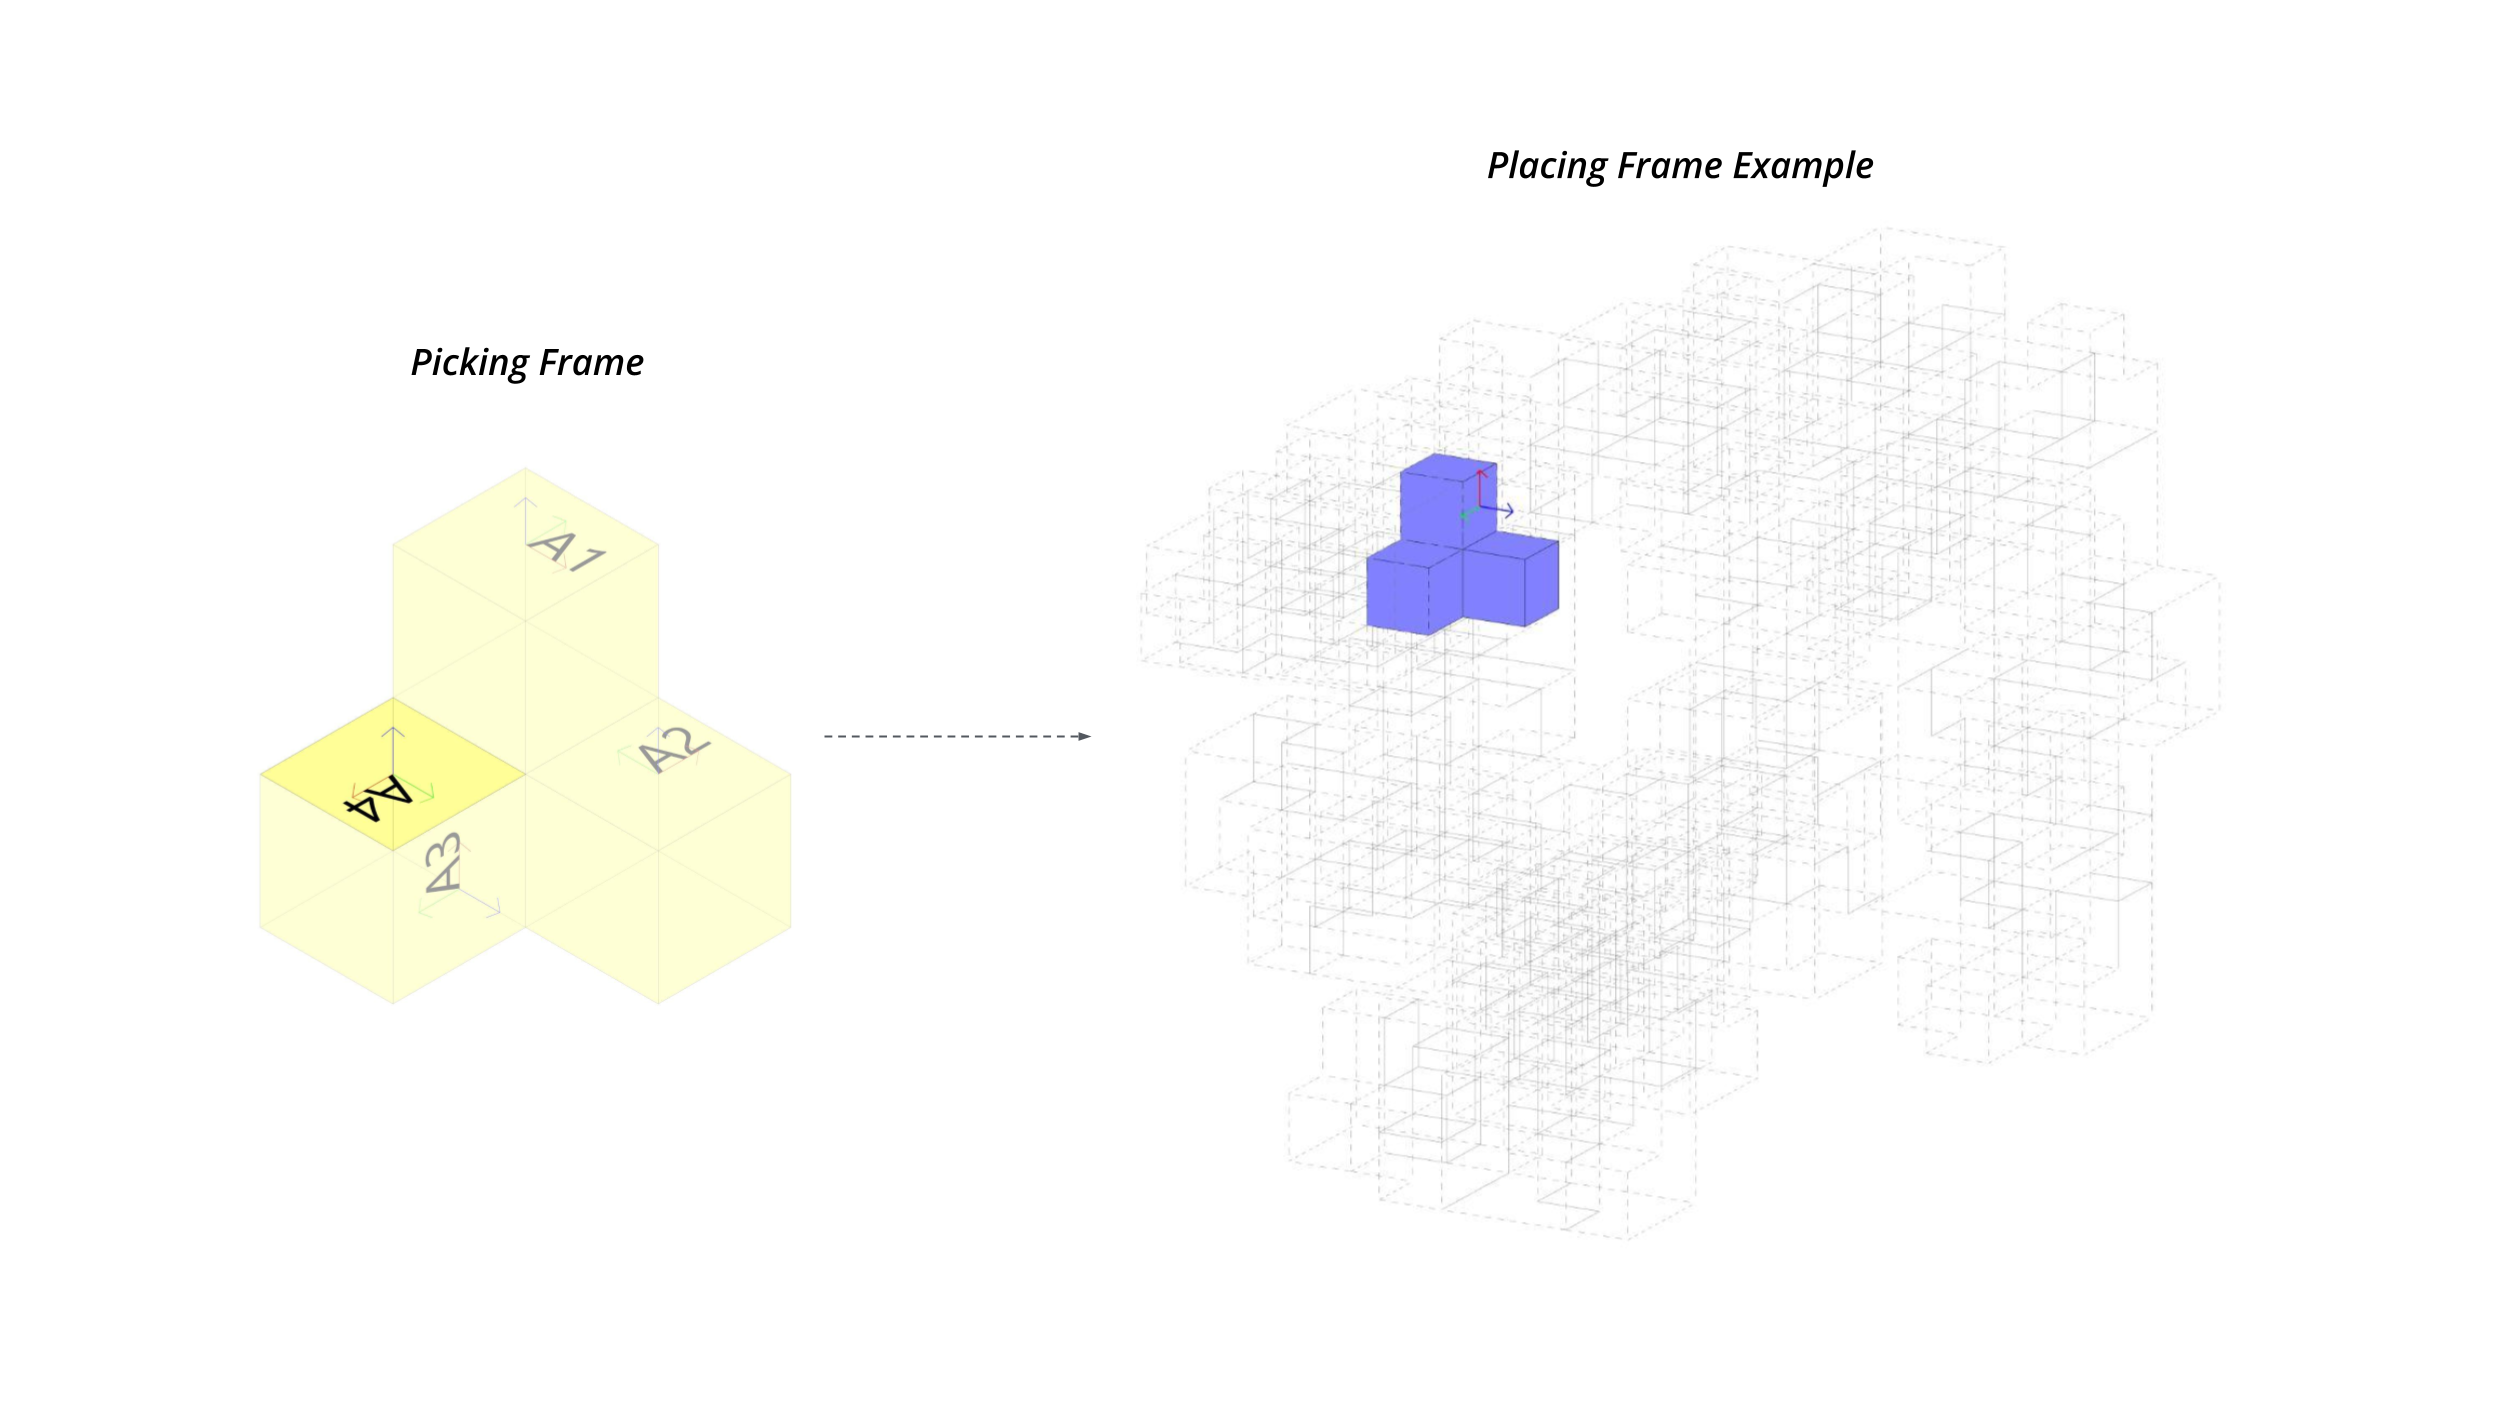
Furthermore, a comprehensive analysis of component orientation concerning the original picking frame (A4) was carried out. This analytical process has led to the systematic color-coding of components based on their respective orientations.