The city of Mumbai, known as the financial and entertainment capital of India, has experienced a significant surge in housing prices and rents in recent years. The demand for residential properties in Mumbai has been steadily increasing due to factors such as population growth, urbanization, and the city’s thriving job market. In the midst of this dynamic housing market, my project aims to explore the relationship between housing prices, proximity to amenities, and rental trends in different neighbourhoods of Mumbai. By analyzing various data sources and employing spatial analysis techniques, the project seeks to provide valuable insights into the factors influencing housing prices and rents, helping individuals make informed decisions about their housing needs in this vibrant city.
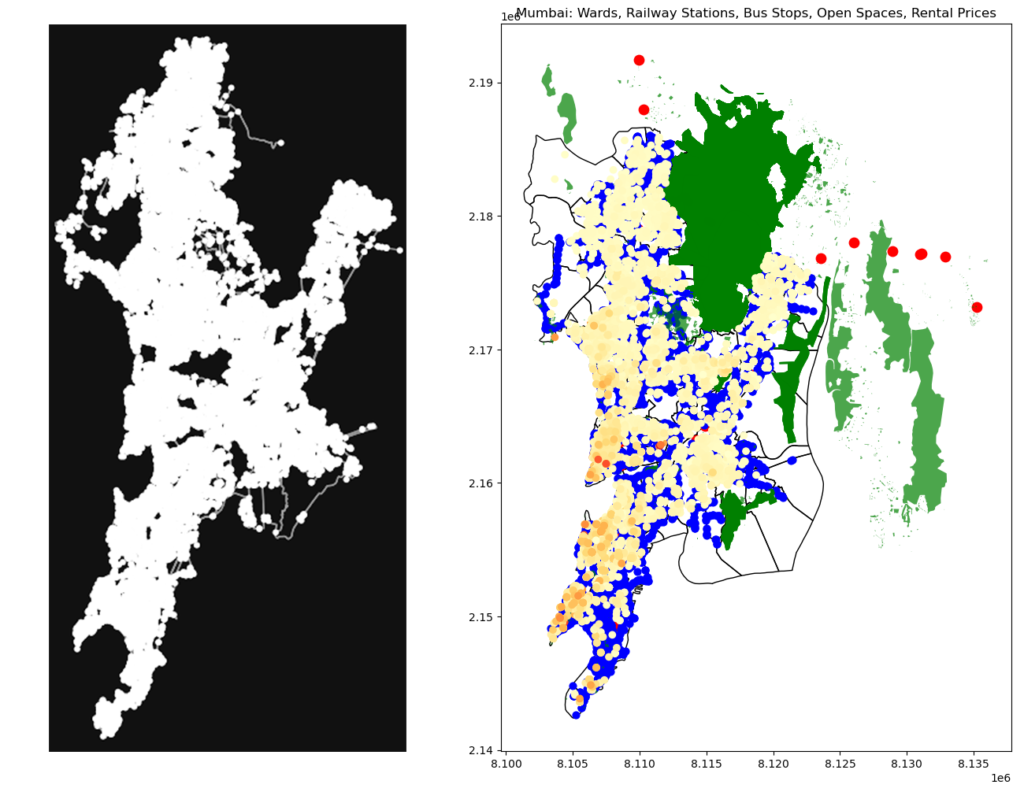
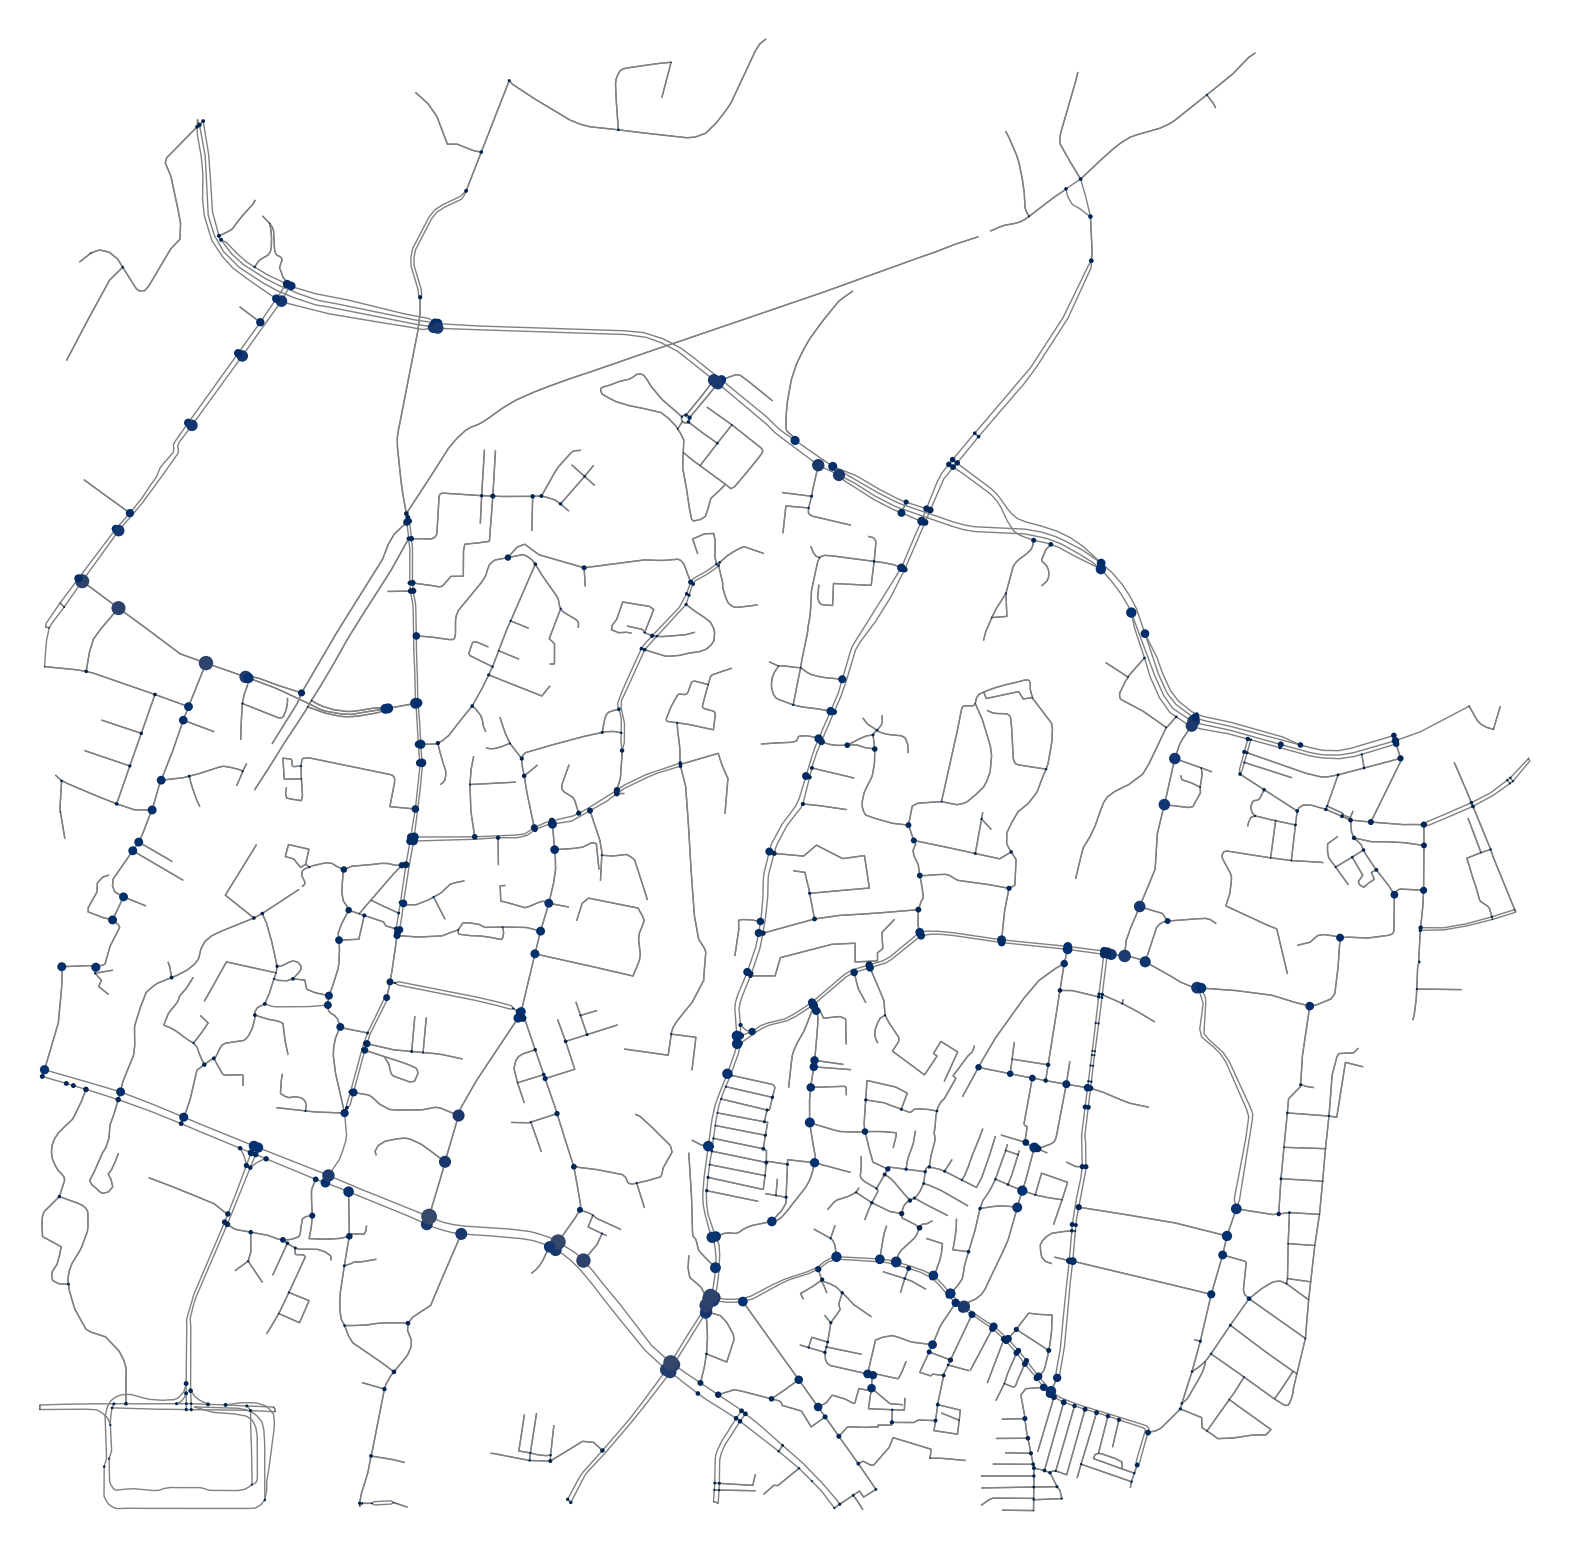
To begin the analysis, I first uploaded all the relevant shape files as geodataframes. These shape files contain spatial data for different aspects of Mumbai, such as ward boundaries, open spaces, bus stops, and railway stations. In order to perform spatial analysis and visualization, it was important to ensure that all the geodataframes were projected in the same projection system. This allowed for accurate overlaying and comparison of the spatial data within Mumbai.
Visualizing the Data
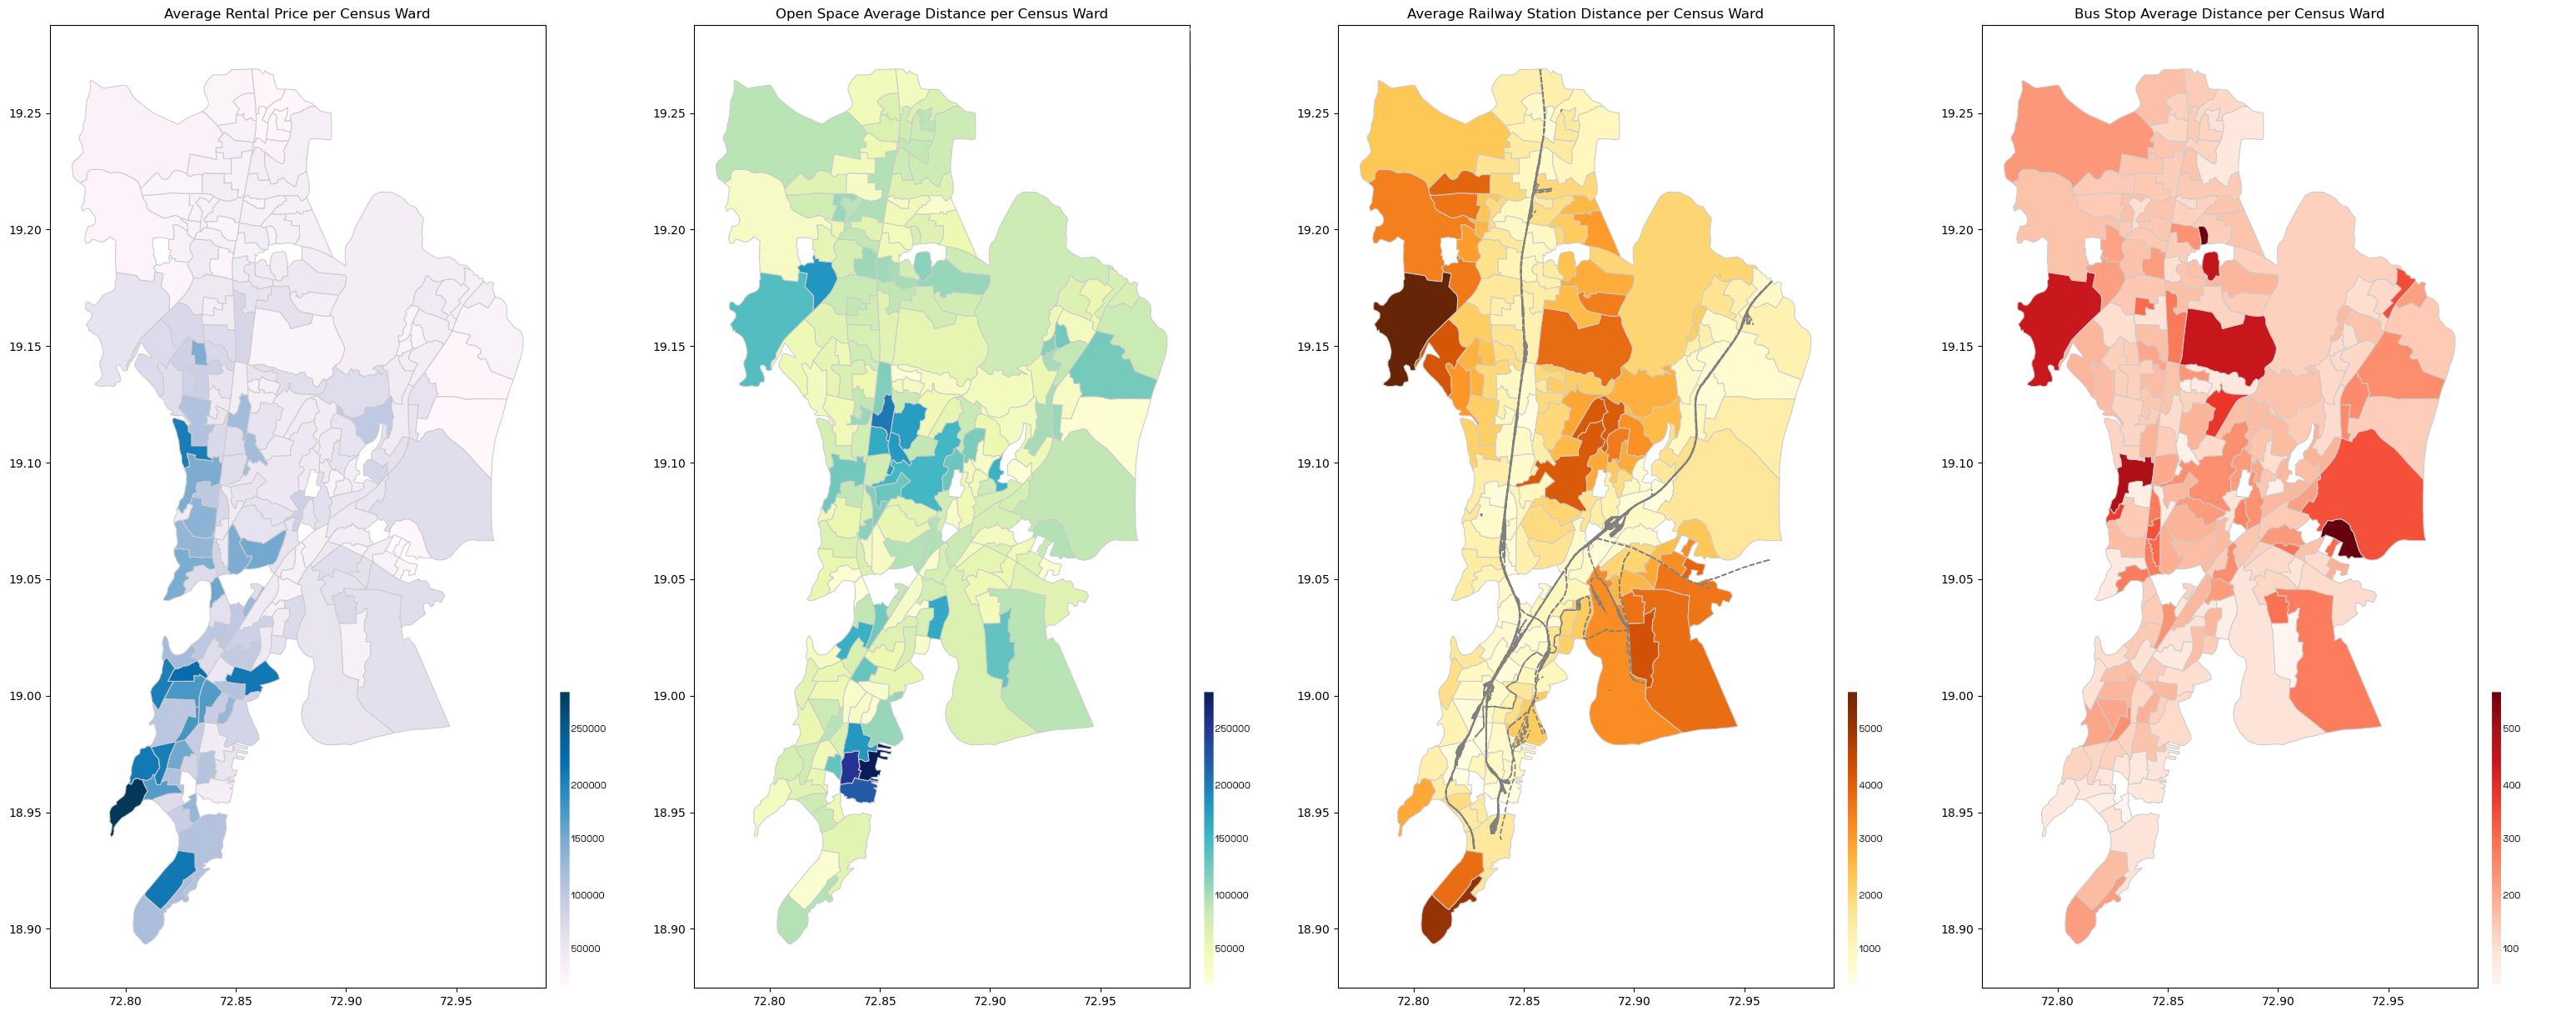
We conducted a detailed analysis by measuring the closest distances from building points to railway stations, bus stops, and open spaces. This analysis aimed to compare and gain insights into the preferences of potential renters and their willingness to spend based on the proximity to various amenities. Additionally, we incorporated average rental prices into the analysis to assign a value to each ward in terms of overall accessibility. By averaging the distances and considering rental prices, we aimed to provide a comprehensive assessment of the accessibility and desirability of each census ward, taking into account both proximity to amenities and affordability. This value-based approach provided valuable insights into the relative attractiveness of different wards in terms of their overall accessibility and rental market conditions.
K-means Clustering
K-means clustering algorithm was employed to identify distinct clusters within the dataset. By grouping similar data points together, we aimed to uncover general trends and patterns within each cluster. After clustering, we conducted further analysis by creating scatter plots and bar graphs for each cluster to examine their respective performances. We also visualise each cluster on the map to understand the clusters better.
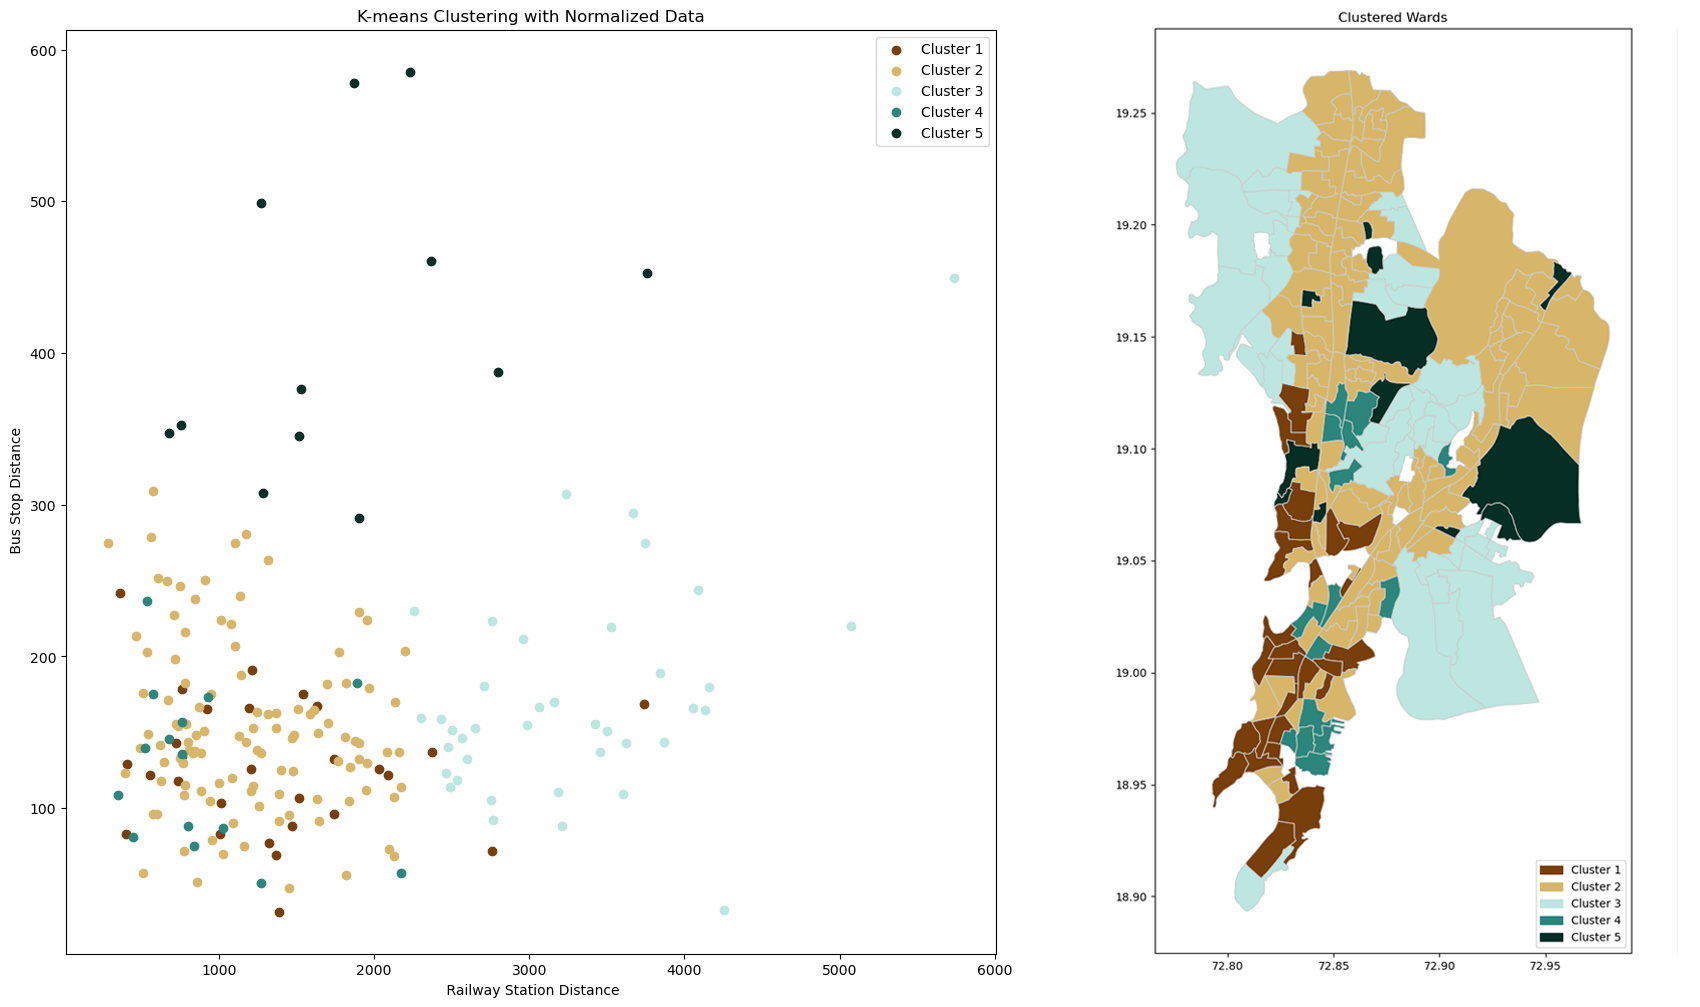
The scatter plots allowed us to visualize the relationship between different variables within each cluster, providing insights into how various factors interacted and contributed to the overall performance. We could identify correlations, trends, and outliers within the clusters, which helped us gain a deeper understanding of the data.
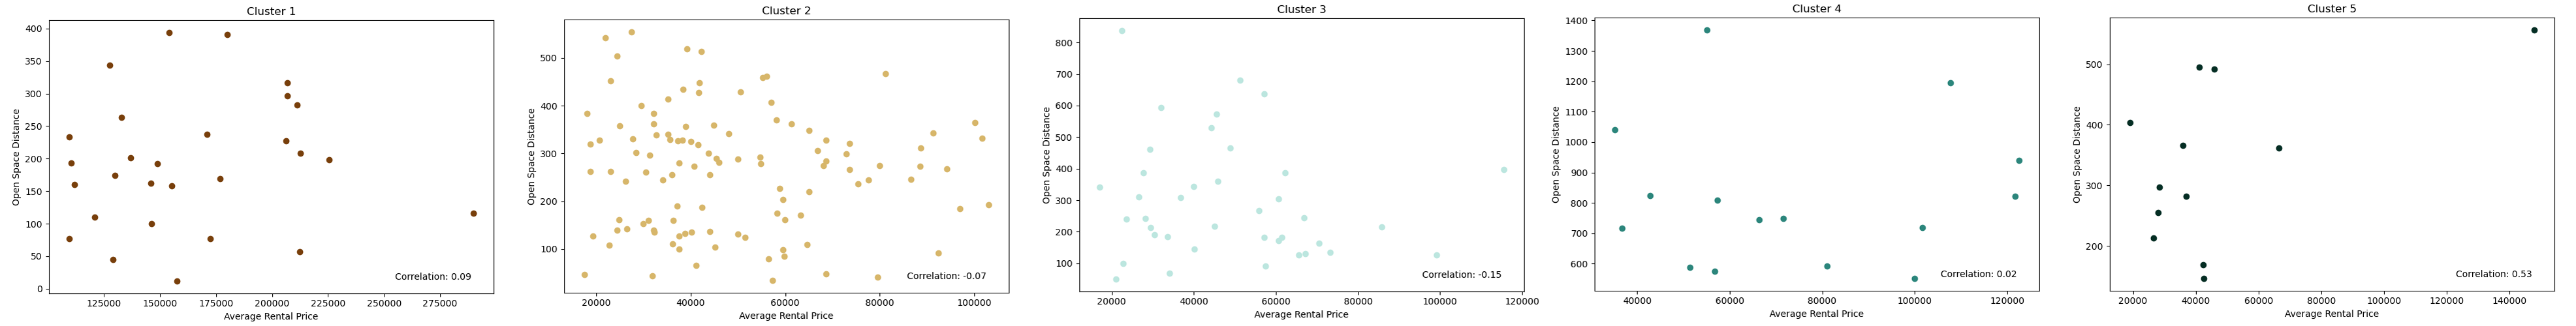
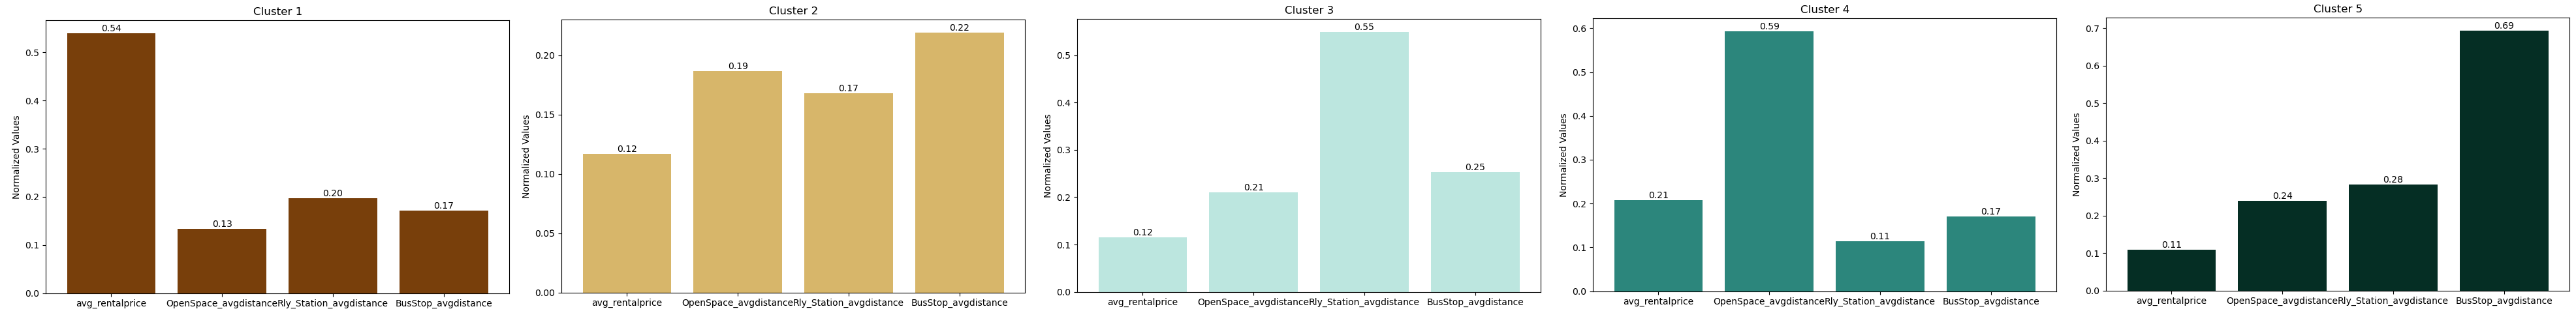
Additionally, the bar graphs provided a comparative analysis of key metrics across the clusters. By examining metrics such as average rental prices, accessibility to amenities, and other relevant factors, we could assess the performance and characteristics of each cluster. This analysis helped us uncover unique attributes and differences among the clusters, providing valuable insights for further decision-making and planning.
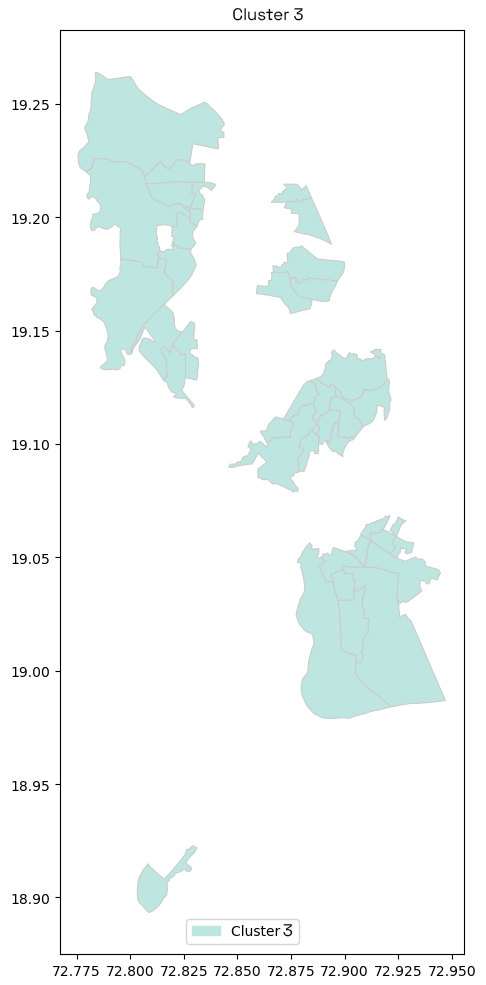
Cluster 3: G North Ward 188
By narrowing down our focus to a specific ward within Cluster 3, we could provide more targeted and specific recommendations or insights tailored to the needs and preferences of individuals interested in that particular area. This approach helps potential buyers make informed decisions and ensures that their chosen ward aligns with their priorities and requirements. The chosen wards was GN 188 that G North ward
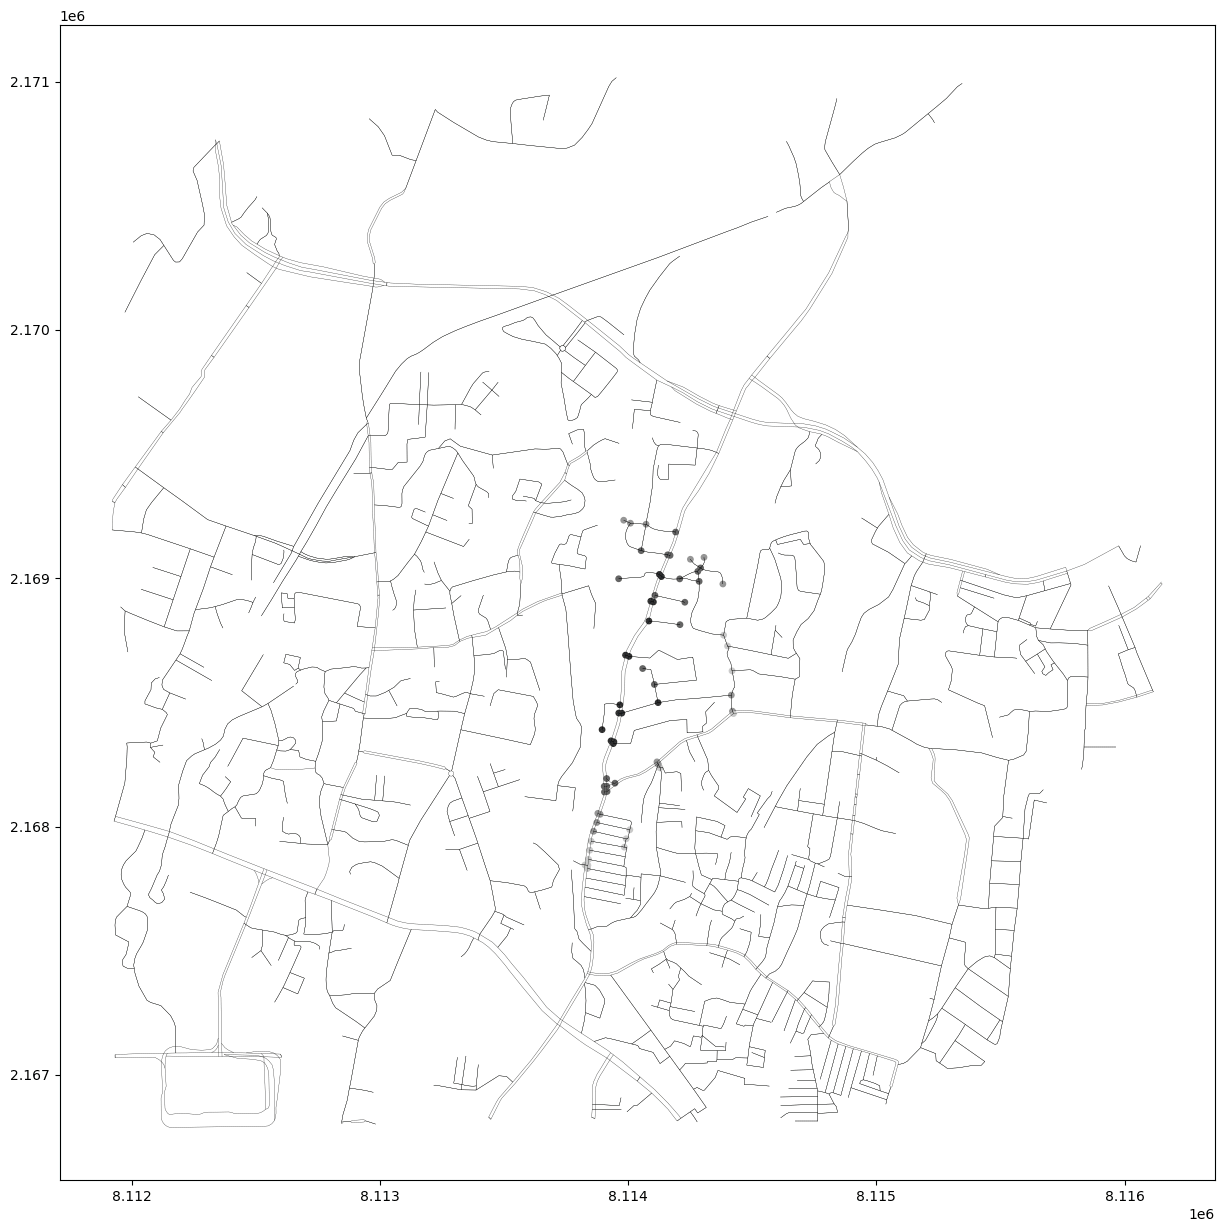
In Ward GN 188, we proceeded with additional analyses, such as calculating the betweenness centrality and conducting isochrone analysis. These techniques provided us with further insights into the ward’s transportation network and accessibility.
By calculating the betweenness centrality, we were able to identify the key routes or streets within Ward GN 188 that act as critical connectors or bottlenecks in the overall transportation network. This measure helps us understand the importance of different road segments in terms of facilitating the movement of people and goods within the ward.
Isochrone analysis, on the other hand, allowed us to visualize and assess travel times or distances from various points within Ward GN 188. By creating isochrone maps, we could delineate areas that are reachable within specific time or distance thresholds, providing valuable information about accessibility and potential commuting patterns within the ward.
By conducting such analyses in Ward GN 188 and other wards of interest, we can gain a comprehensive understanding of the city’s transportation infrastructure, connectivity, and accessibility. These insights can inform decision-making processes, urban planning strategies, and the identification of suitable neighbourhoods for various purposes, such as residential, commercial, or recreational.
By expanding our studies to other wards and repeating similar analyses, we can create a holistic picture of the city, identify common trends or patterns, and provide valuable information to individuals or stakeholders interested in different parts of the city. This approach allows for targeted and localized recommendations, tailored to the unique characteristics and requirements of each ward.
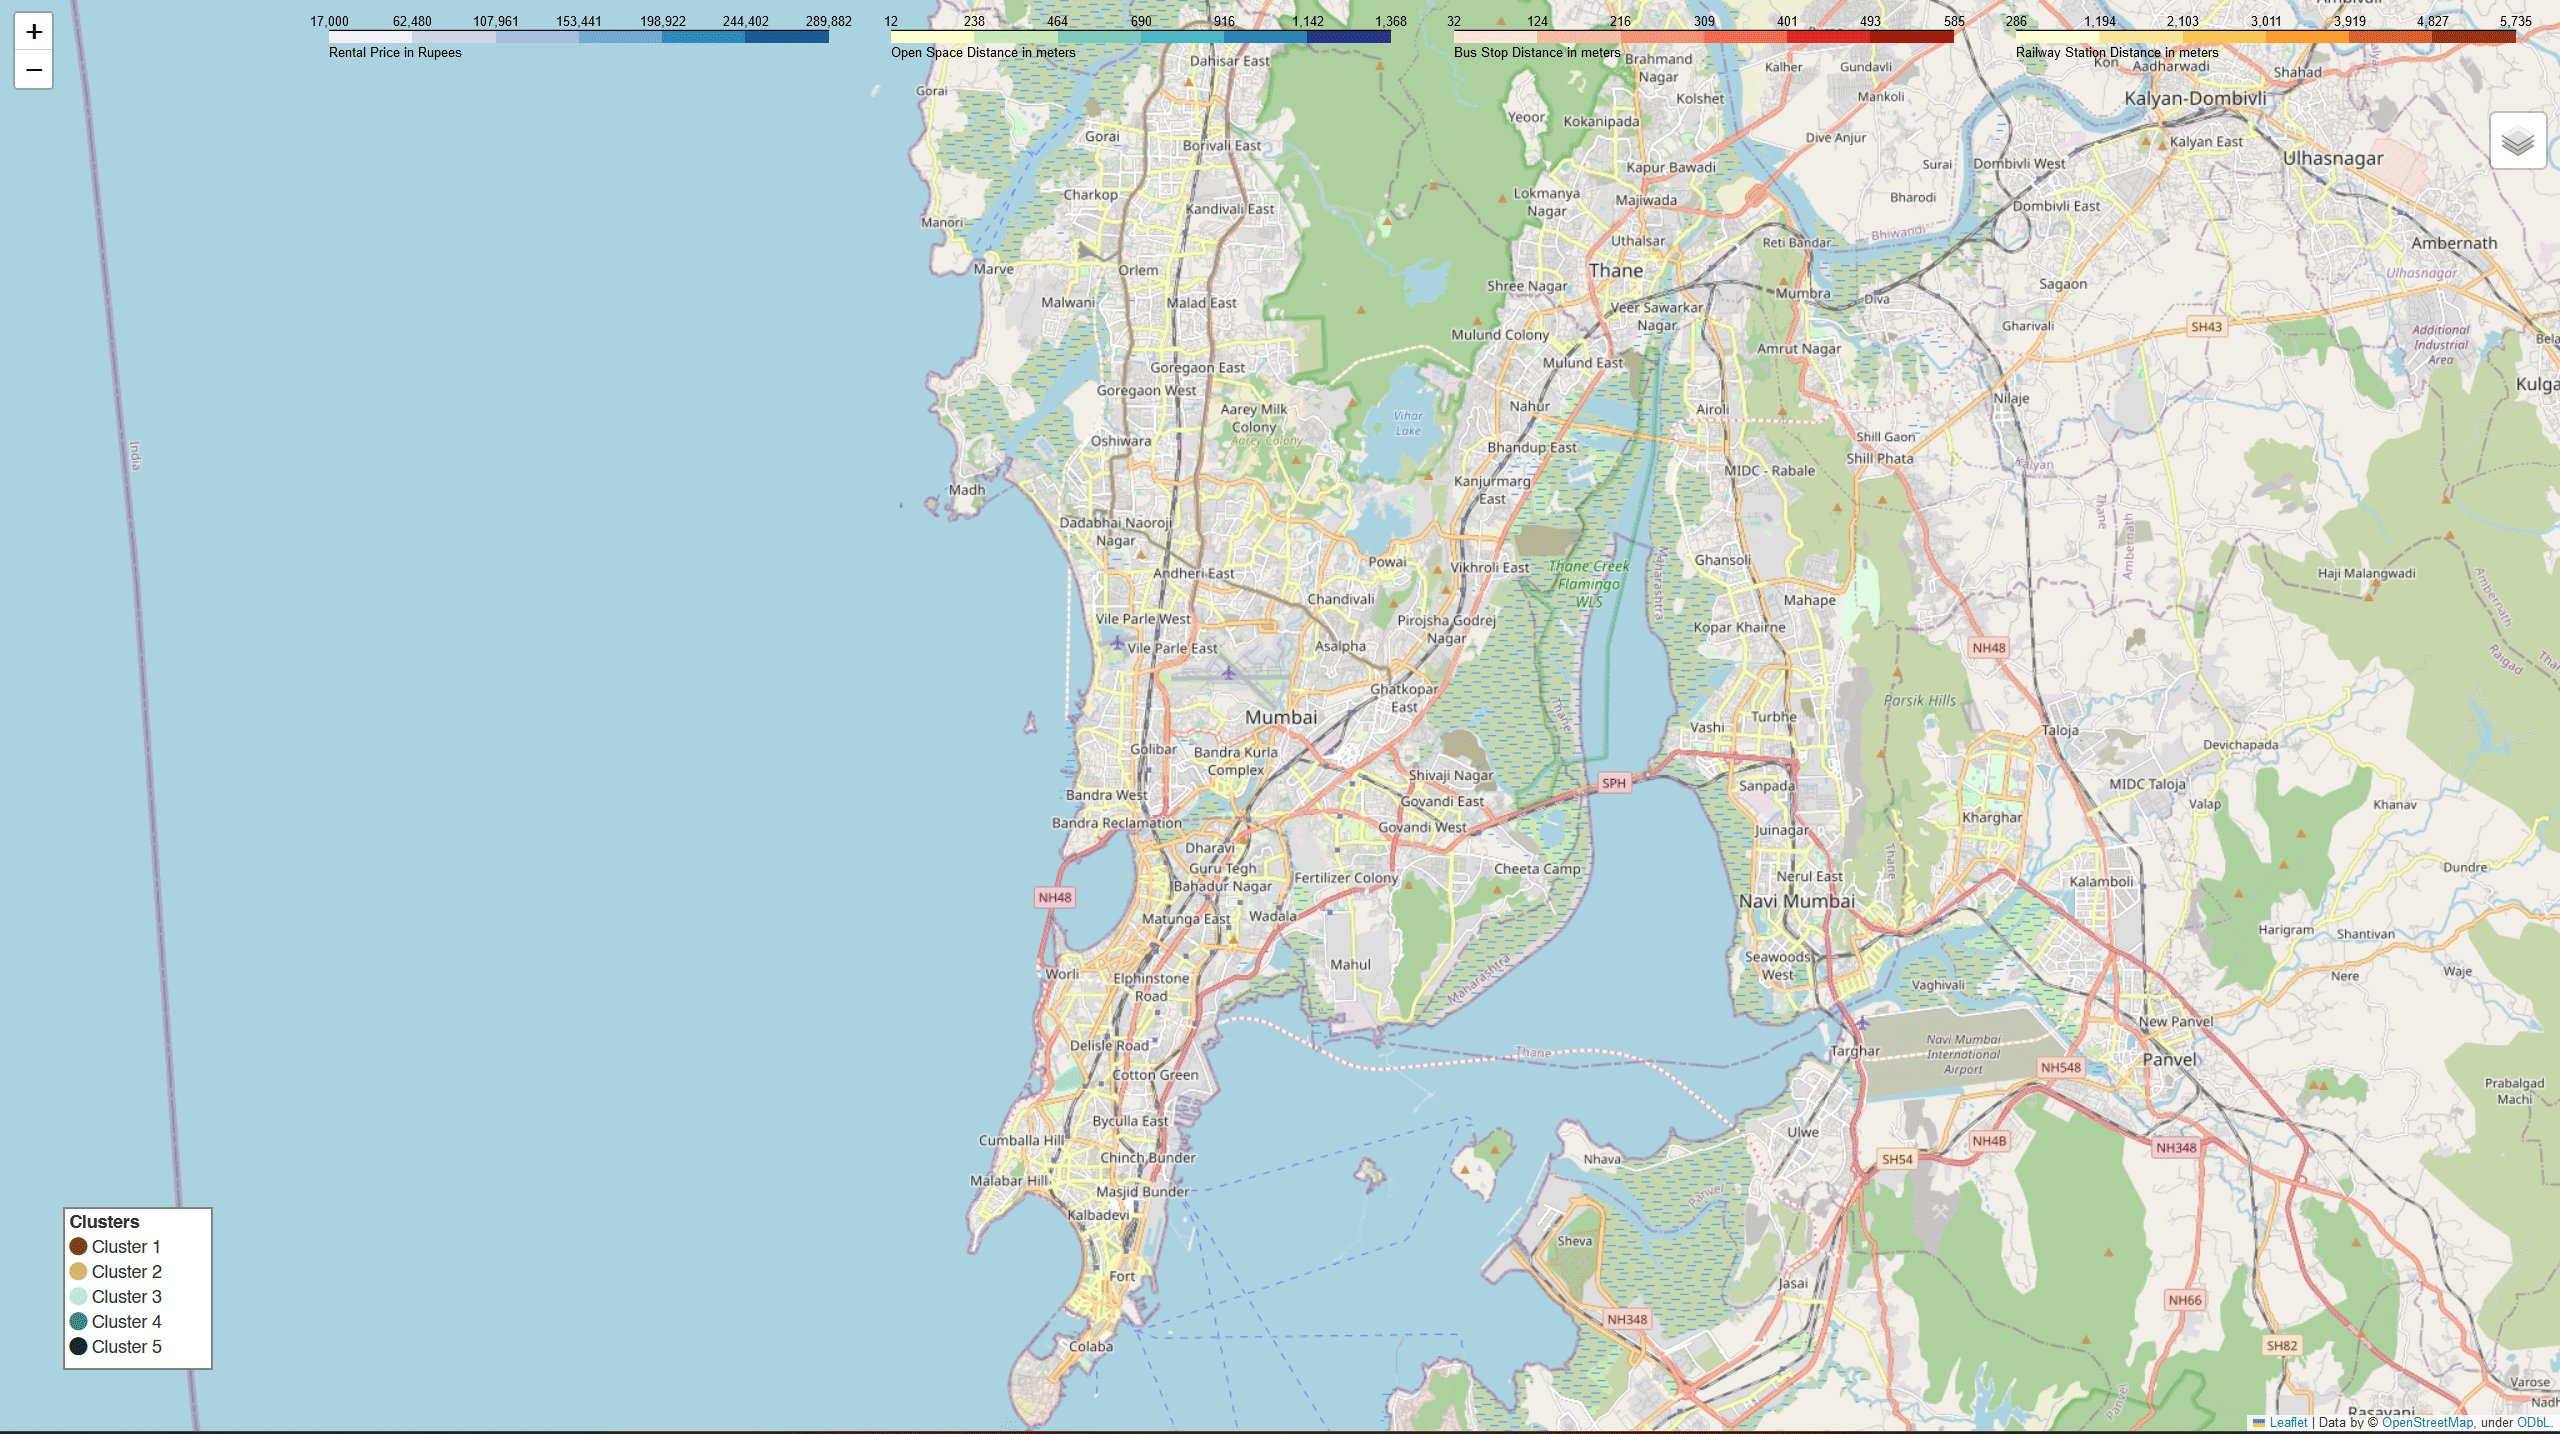
Future Steps: Interactive Map
Additionally we aimed to provide an interactive map on a city scale, allowing potential buyers to explore and choose their preferred neighbourhoods based on their specific needs and preferences. By visualizing various factors such as accessibility to amenities, rental prices, and cluster analysis results, the map provides valuable information for decision-making.
By leveraging this type of interactive map, buyers gain access to valuable information that can guide their choices, save time, and ultimately help them find a neighbourhood that best suits their needs and preferences.