Microcontrollers
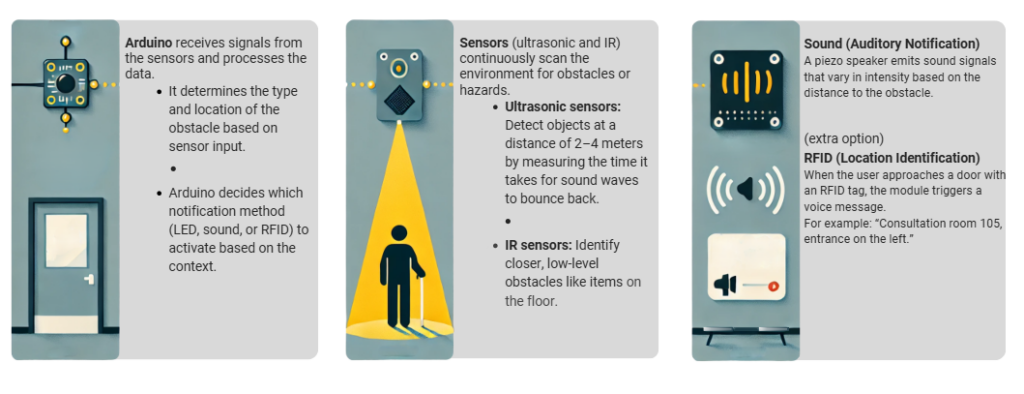
This project focuses on creating an automated door system designed to enhance accessibility, particularly in healthcare environments such as hospitals and clinics. Using an ultrasound sensor to detect distance, the system provides auditory guidance and ensures safe and efficient door operation for users, including those with visual impairments. The system is programmed to announce the user’s proximity, open the door automatically, and ensure safety during closing based on real-time distance data.
. SOLUTION CONCEPT

. SYSTEM PLACEMENT .

. TECHNOLOGY & COMPONENTS .
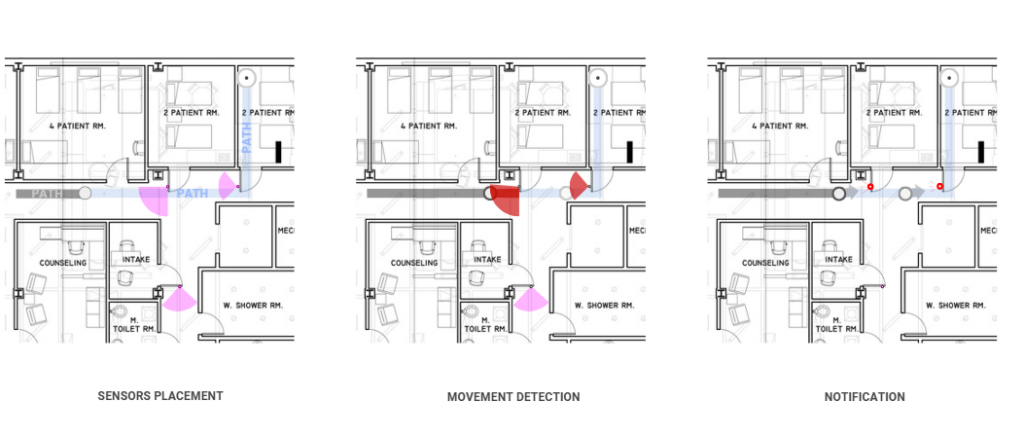
The core of this project relies on an ultrasonic sensor for accurate distance measurement and proximity detection. The ultrasonic sensor is a widely used device for measuring distances in a non-contact manner, making it ideal for accessibility-focused systems like this automated door.
How the Ultrasonic Sensor Works

The ultrasonic sensor operates by emitting ultrasonic sound waves from its transmitter. These sound waves travel through the air and reflect back when they hit an obstacle. The sensor’s receiver detects the reflected waves, and by calculating the time it takes for the sound waves to return, the system determines the distance between the sensor and the object. This precise measurement ensures the door system operates accurately and safely in real-time.
Key Features of the Ultrasonic Sensor
- High Accuracy: The sensor provides precise distance readings, which are crucial for detecting users at various ranges and triggering appropriate actions.
- Wide Range: It can detect distances up to 5 meters, allowing the system to prepare early for a user’s approach.
- Non-Contact Measurement: Since it uses sound waves instead of physical contact, it ensures hygiene and durability, especially in healthcare environments.
- Real-Time Feedback: The sensor provides continuous distance monitoring, enabling the system to respond dynamically to the user’s position.
Why the Ultrasonic Sensor is Ideal for This Project
- Safety: By accurately detecting proximity, the sensor prevents the door from closing on users or objects within range.
- Accessibility: Its ability to detect users and provide feedback through auditory announcements ensures ease of use for visually impaired individuals.
- Efficiency: The sensor’s quick response time allows the system to operate seamlessly, ensuring smooth door opening and closing mechanisms.
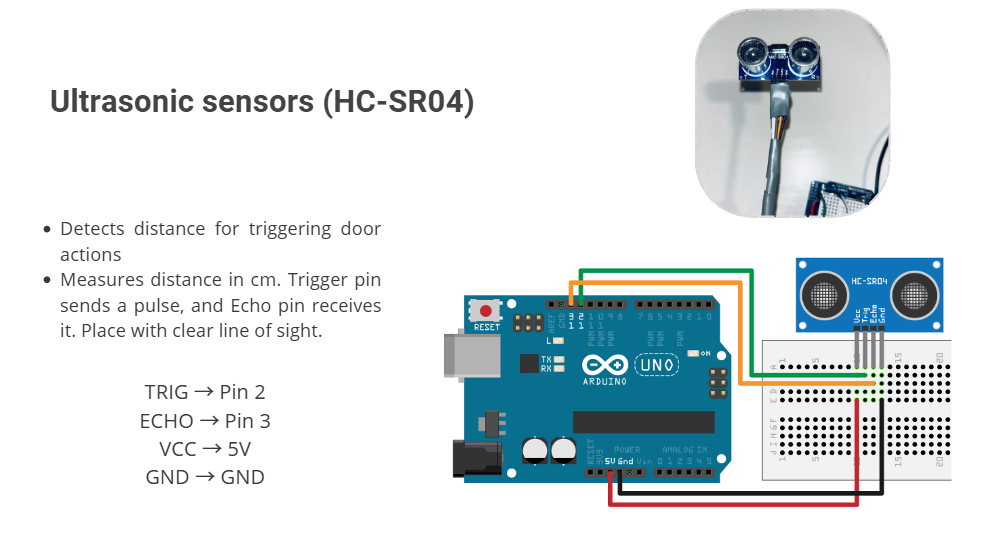
The ultrasonic sensor plays a vital role in this project, bridging the gap between the user’s position and the automated system’s actions. Its integration into this accessible door system showcases how smart sensing technology can create a safer and more inclusive environment.
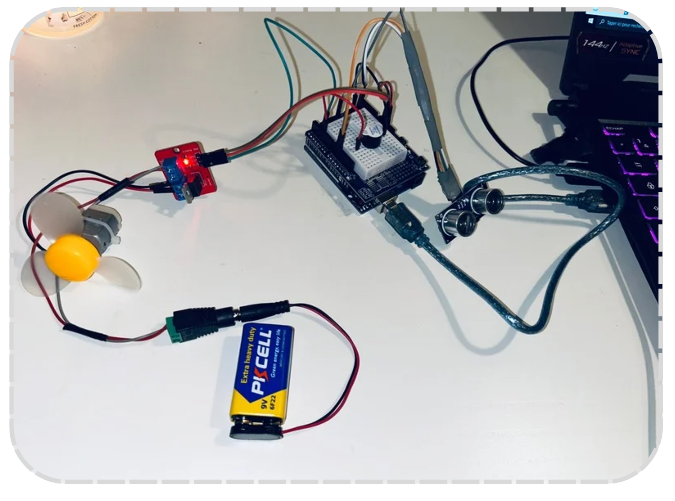
. CONNECTION SET .
. CODE LOGIC .
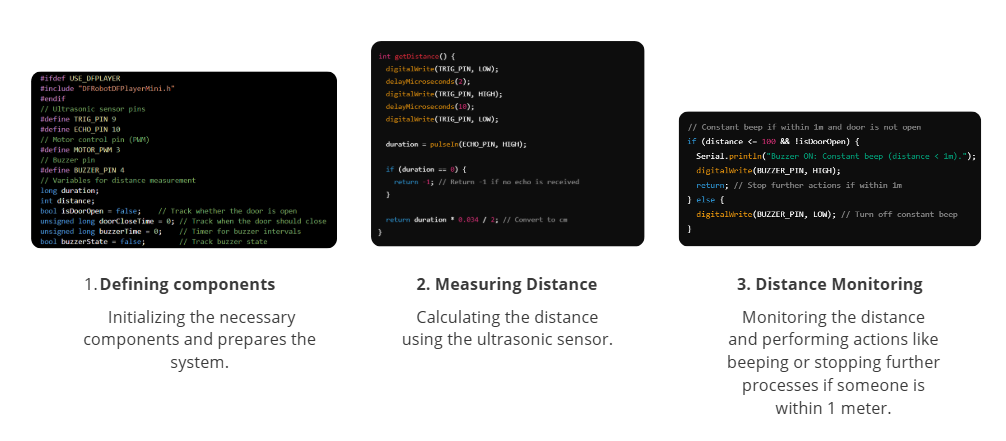
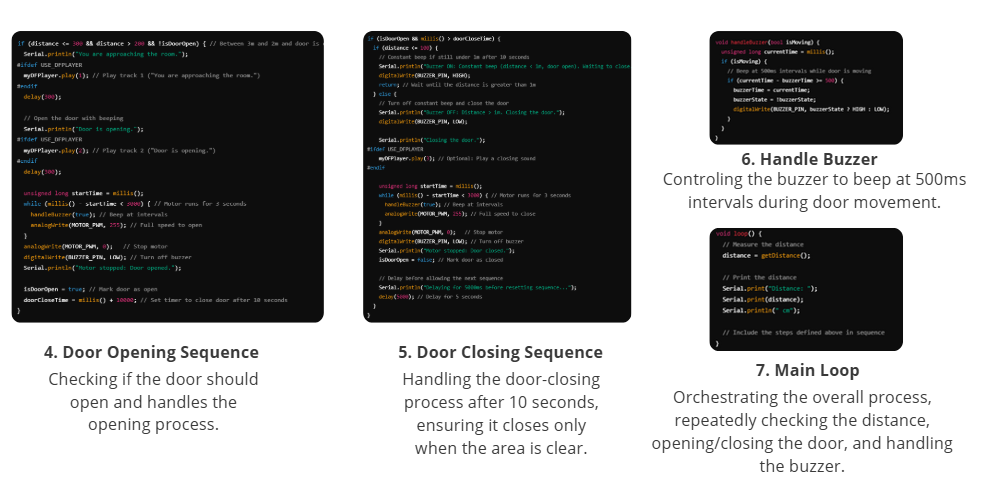
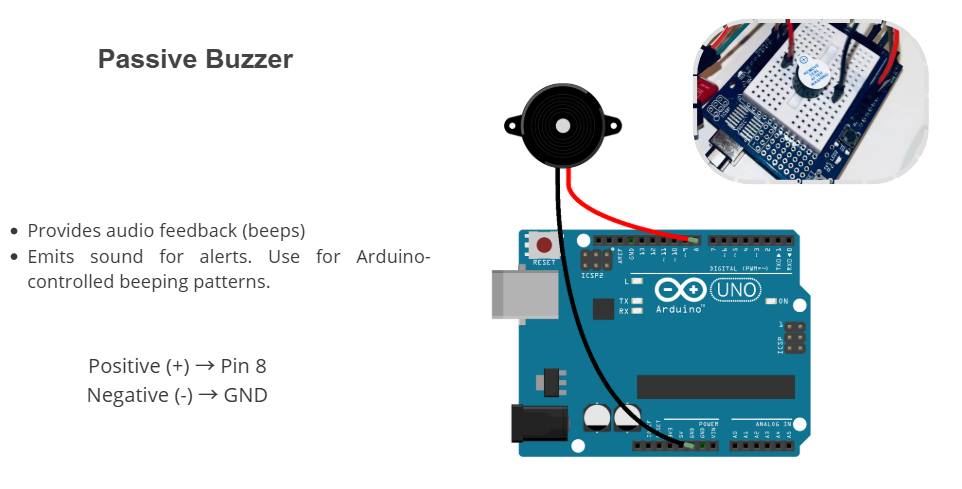
The project utilizes an ultrasound sensor as an input to measure distance and trigger specific actions. When a user is detected within 3 meters of the sensor, a speaker announces, “You are approaching the [room name]” (e.g., “You are approaching the examination room”) to provide clear auditory guidance. If the user moves closer and is within 2 meters, the system announces, “Door is opening,” or waits for 3 seconds before making the announcement.
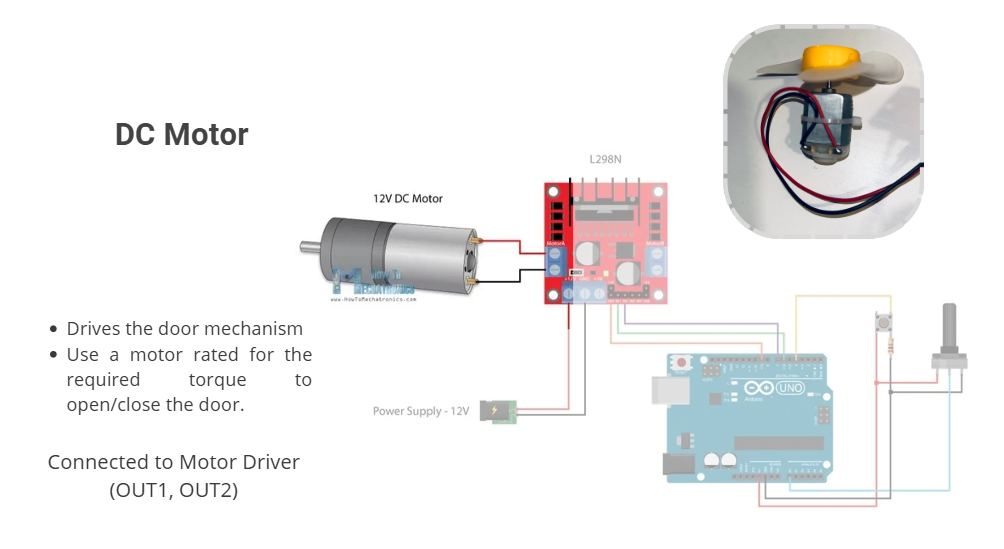
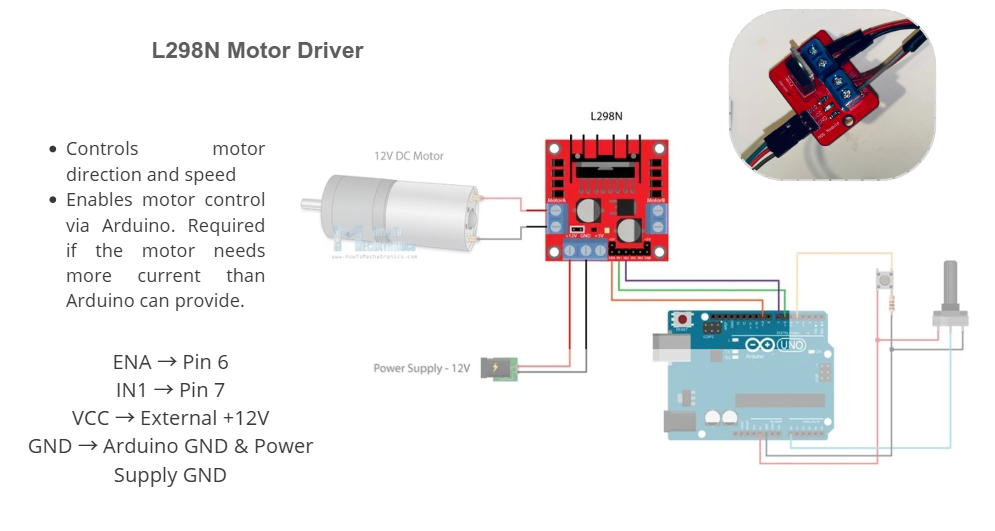
The system then activates a DC motor to open the attached door, running the motor for 8 seconds. Once the door is fully open, the system enters a 10-second waiting phase. After this, it attempts to close the door by reversing the motor. However, if the sensor detects an object within 5 meters, the motor will not engage, ensuring user safety. Once the area is clear, the system waits another 10 seconds before closing the door and announcing, “Door is closing.”
This design prioritizes accessibility and safety, making it ideal for healthcare facilities to accommodate diverse user needs, including visually impaired individuals.
CODE RUNNING
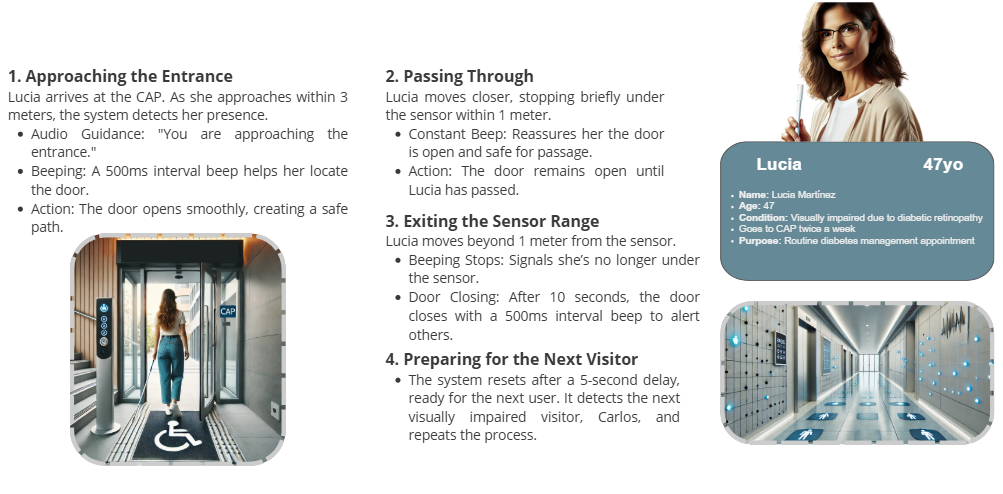
EXAMPLE SCENARIO
. WHY ARDUINO? .
This project demonstrates how technology can be integrated into daily environments to improve accessibility, safety, and convenience. By combining distance measurement, auditory feedback, and automated door mechanisms, the system ensures that users, particularly those with visual impairments, can navigate spaces more independently and comfortably. Its application in healthcare facilities highlights its potential to enhance user experience while maintaining a high level of safety and efficiency. This innovative solution represents a step forward in creating inclusive and user-friendly environments.
Robotic Fabrication
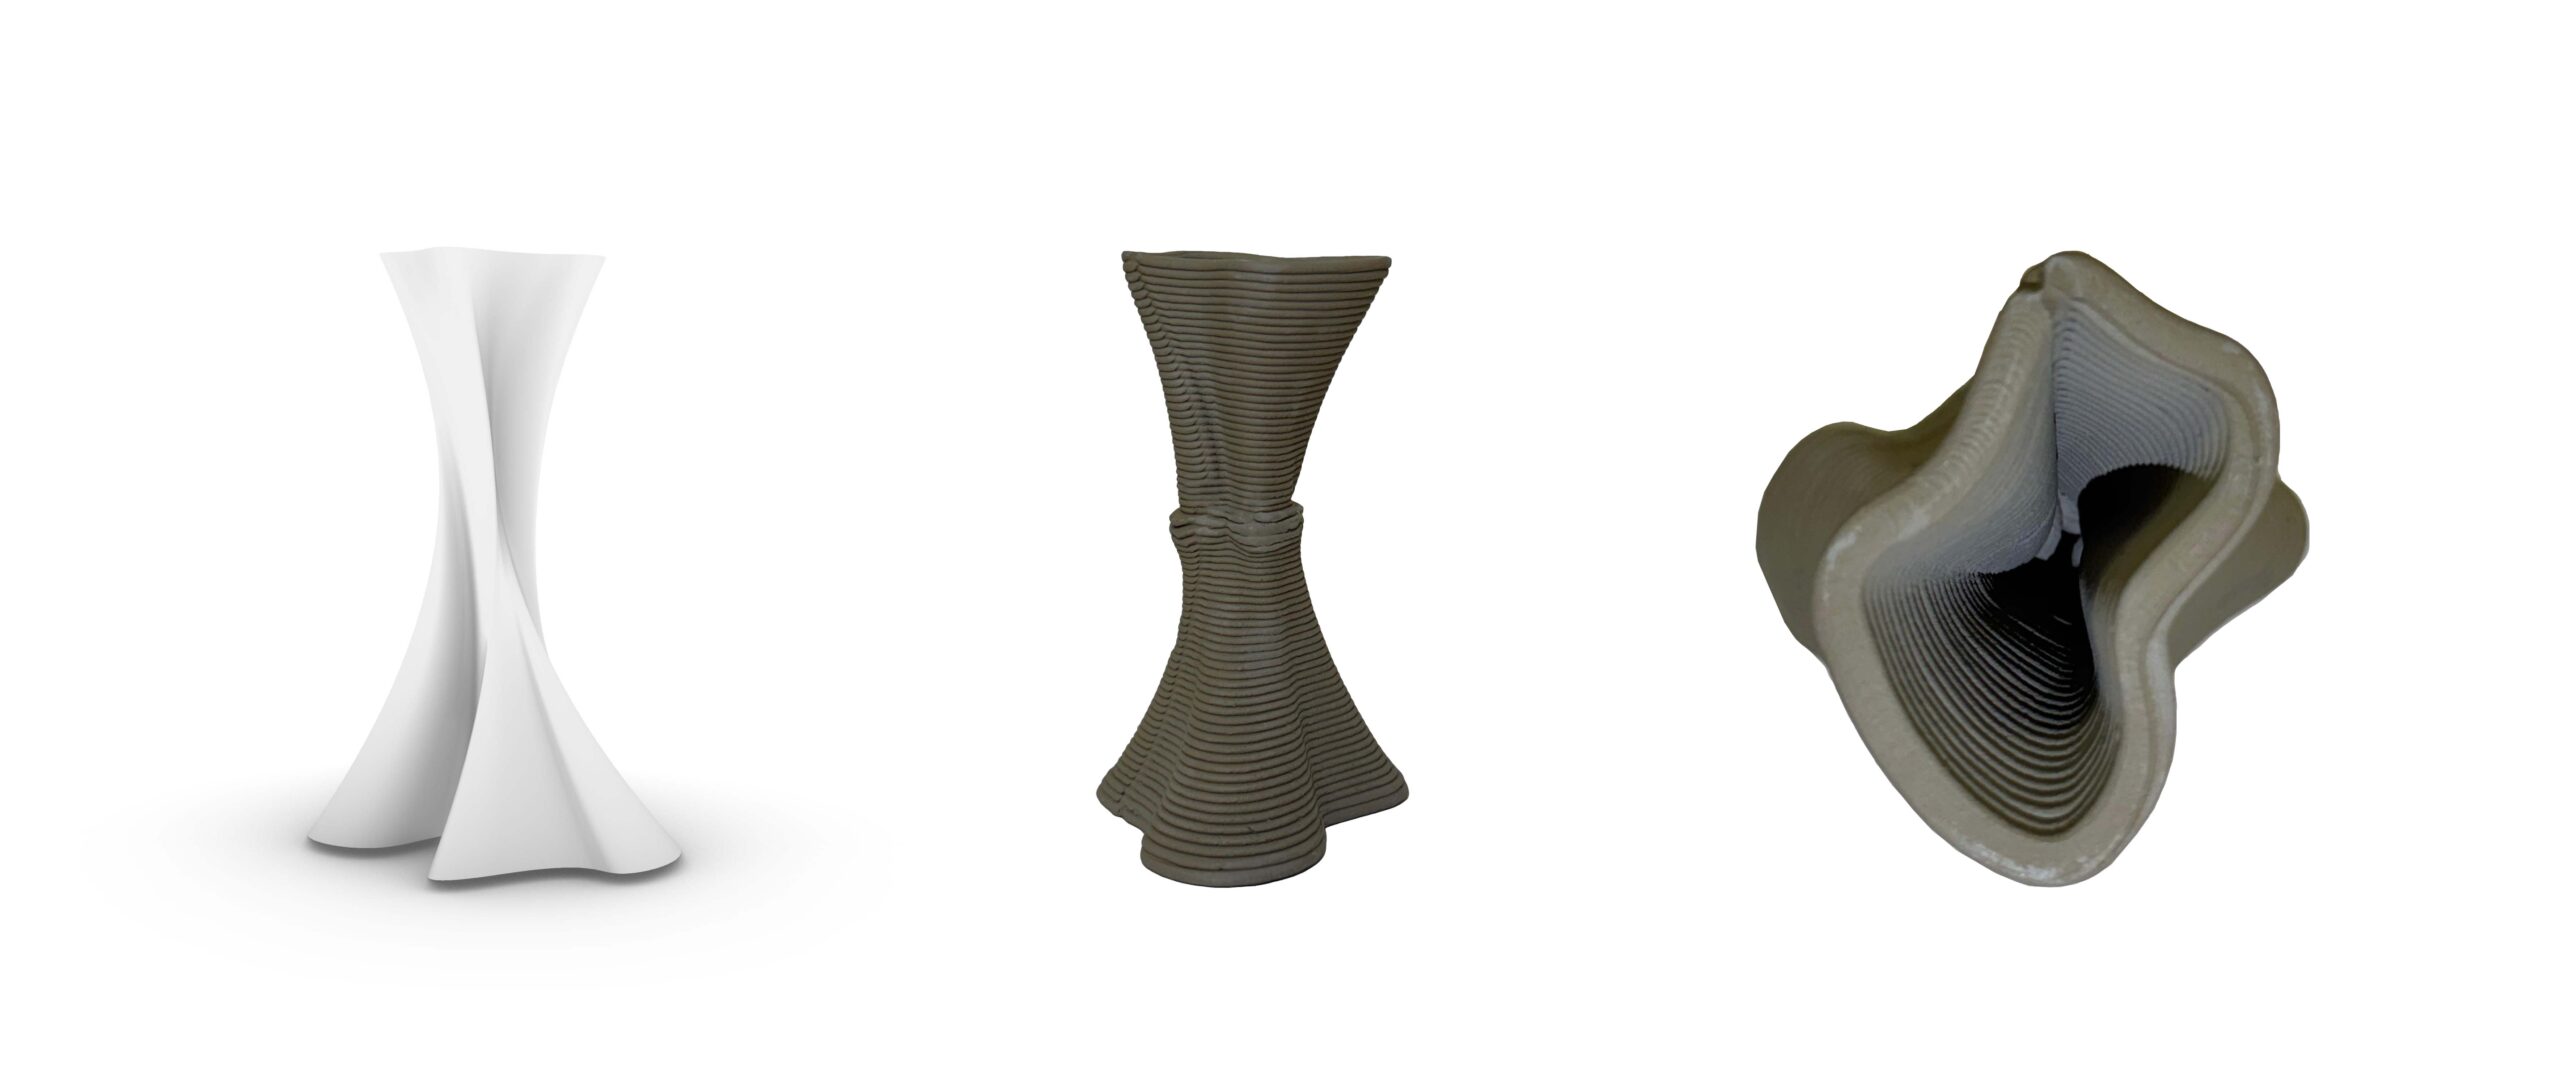
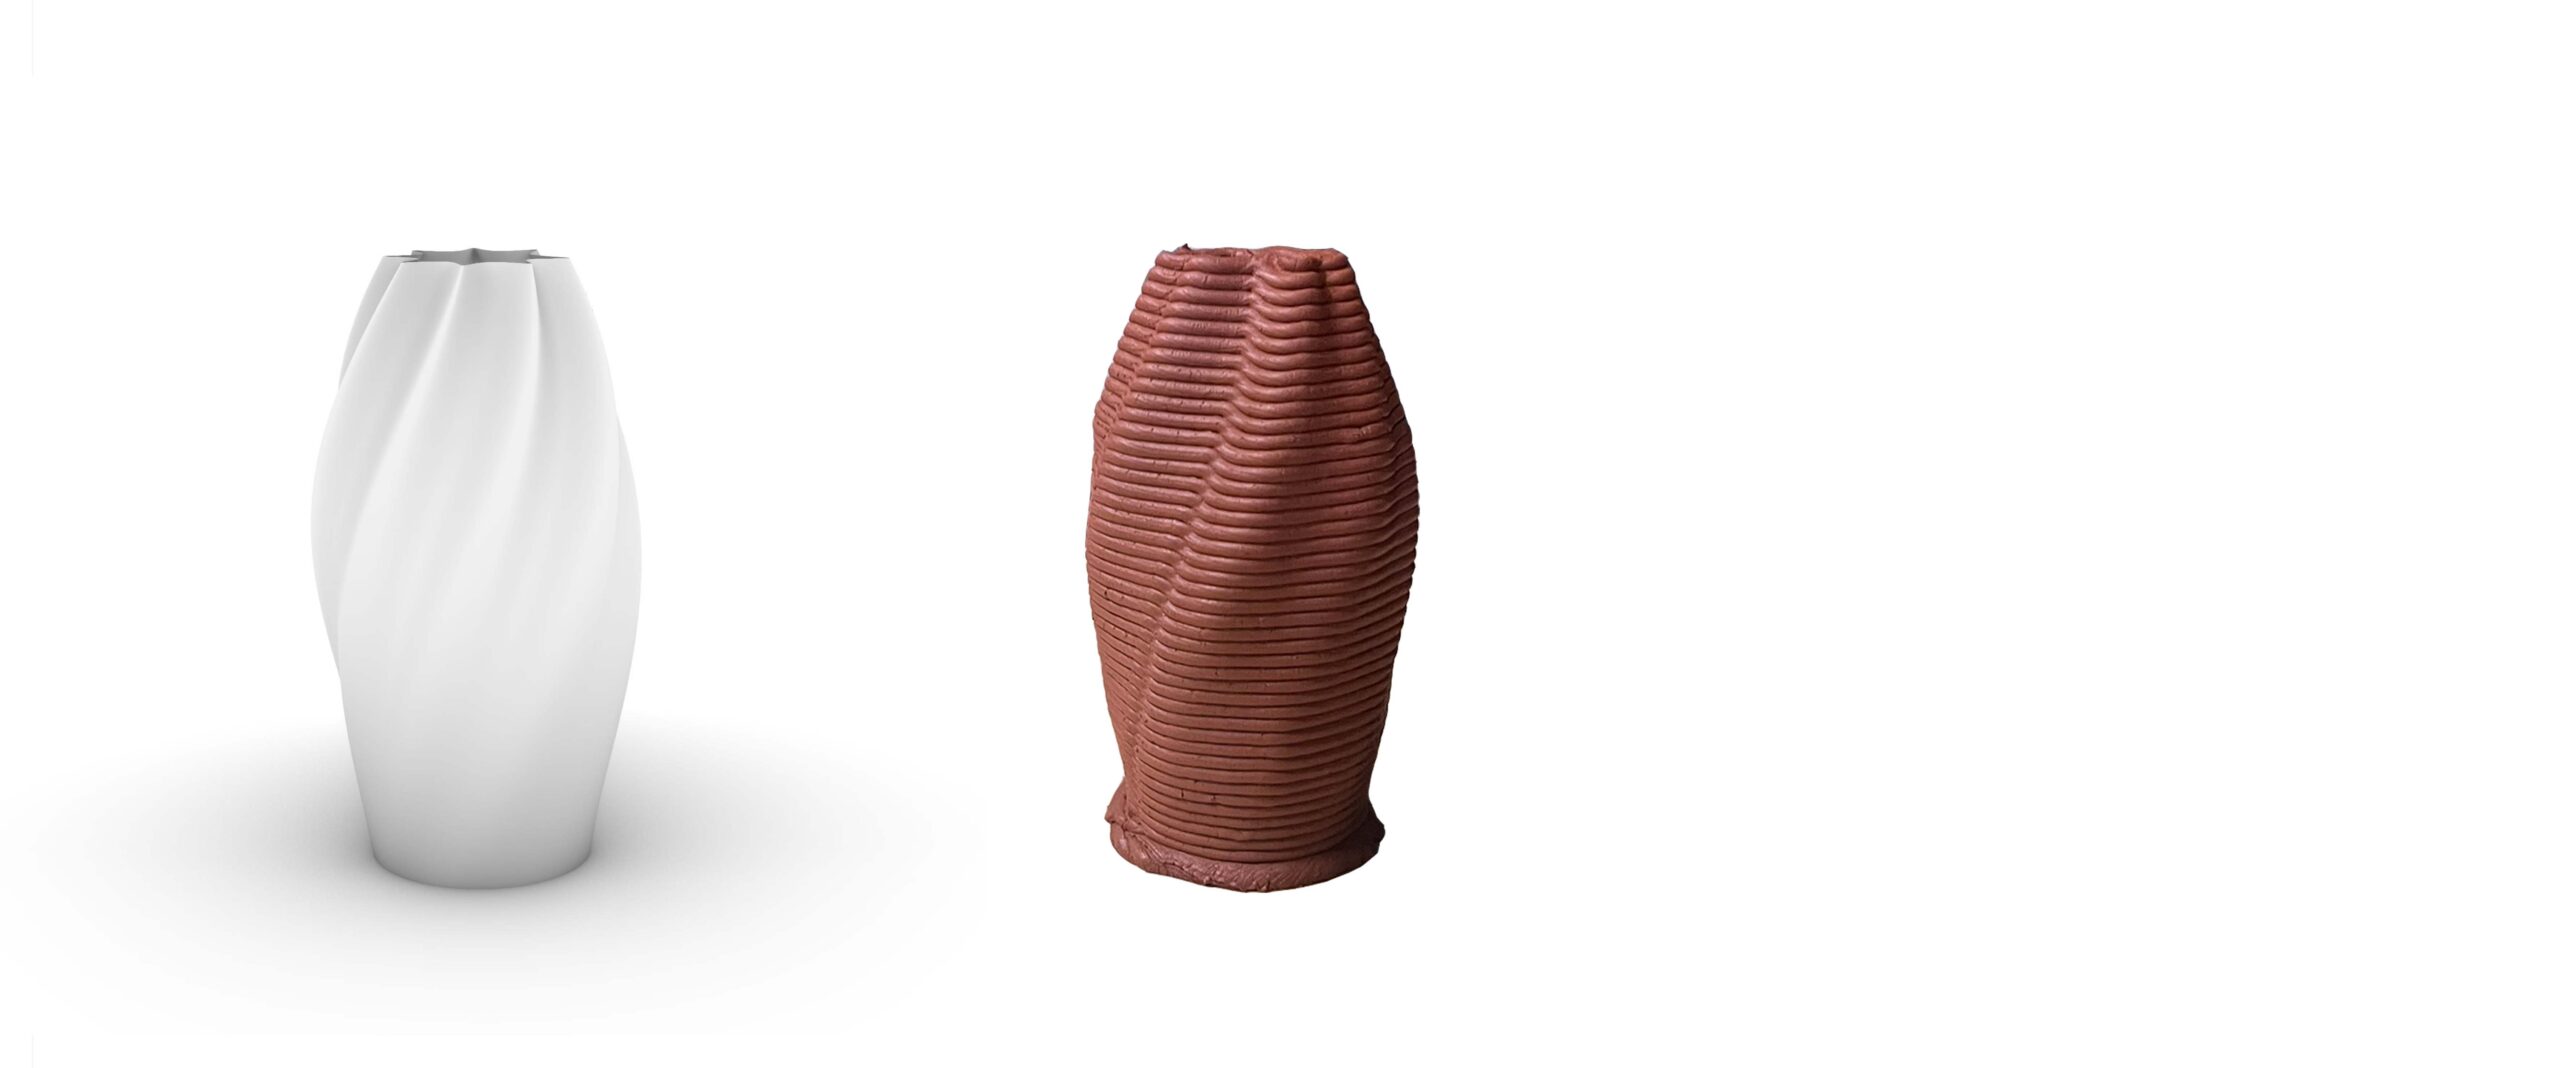
This project provided our group with an in-depth exploration of robotics through a step-by-step process of printing clay pots. We began by designing a series of parametric vases in Grasshopper, enabling us to create diverse geometric structures. Subsequently, we utilized 3D printing robots to fabricate the vases while capturing the robot’s performance data in Robot Studio. The graphs below present an analysis and comparison of the behavior observed in the offline simulation and the robotic execution.
Prototype 01 - The Dancing Pillar
Digital Documentation
Graph Analysis
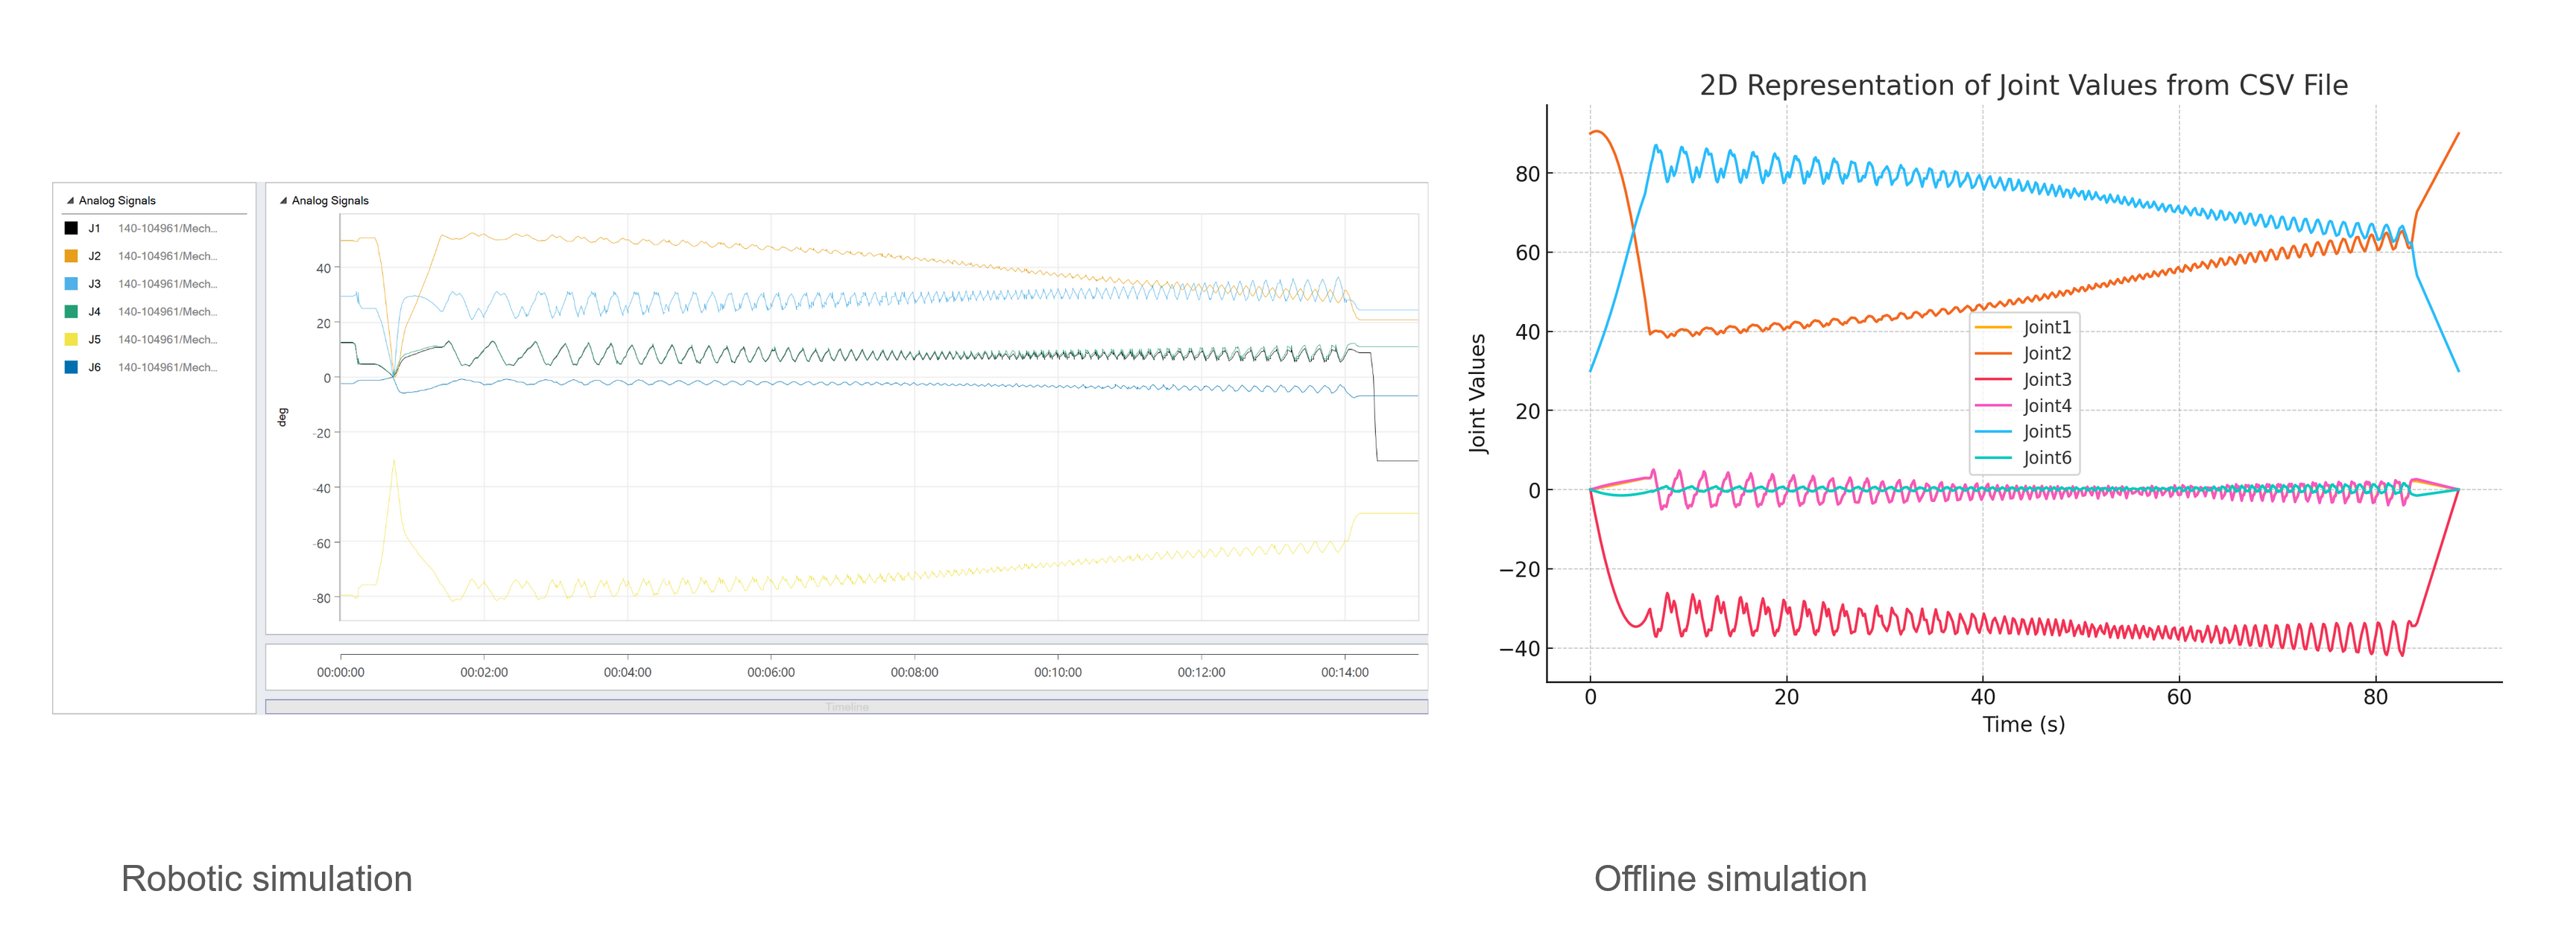
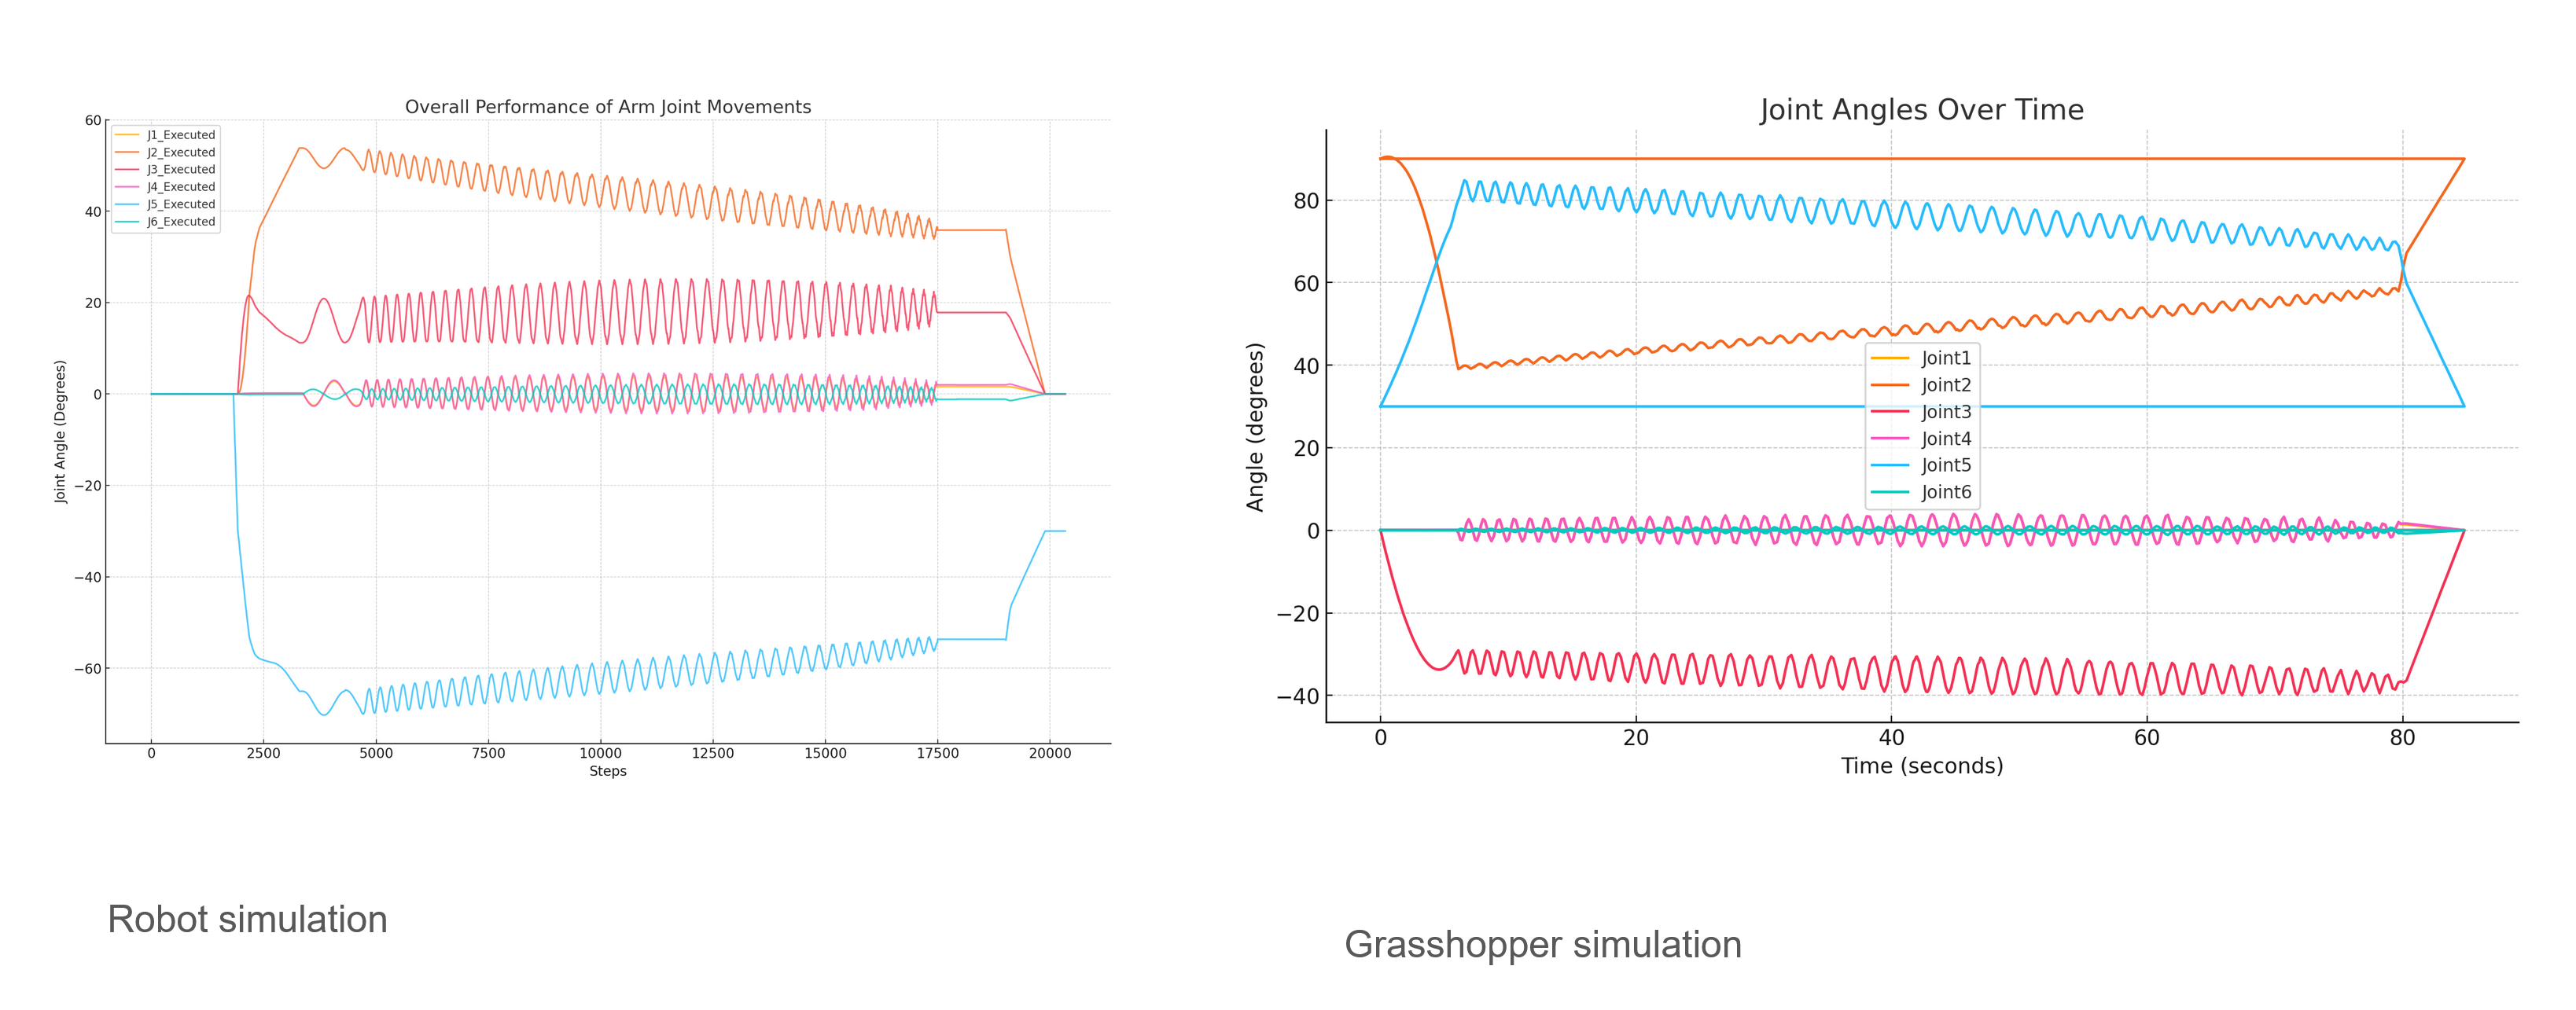
The data was collected from the offline simulation using Grasshopper and from ABB Robot Studio during real-time prototype printing.
The graphs below illustrate the joint movements in both scenarios. The first graph depicts the joint movements as recorded in Robot Studio, while the second graph represents the joint movements from the offline simulation. The latter was generated by ChatGPT using the following prompt: “Create a graph showcasing the overall performance of the arm joint movements.”
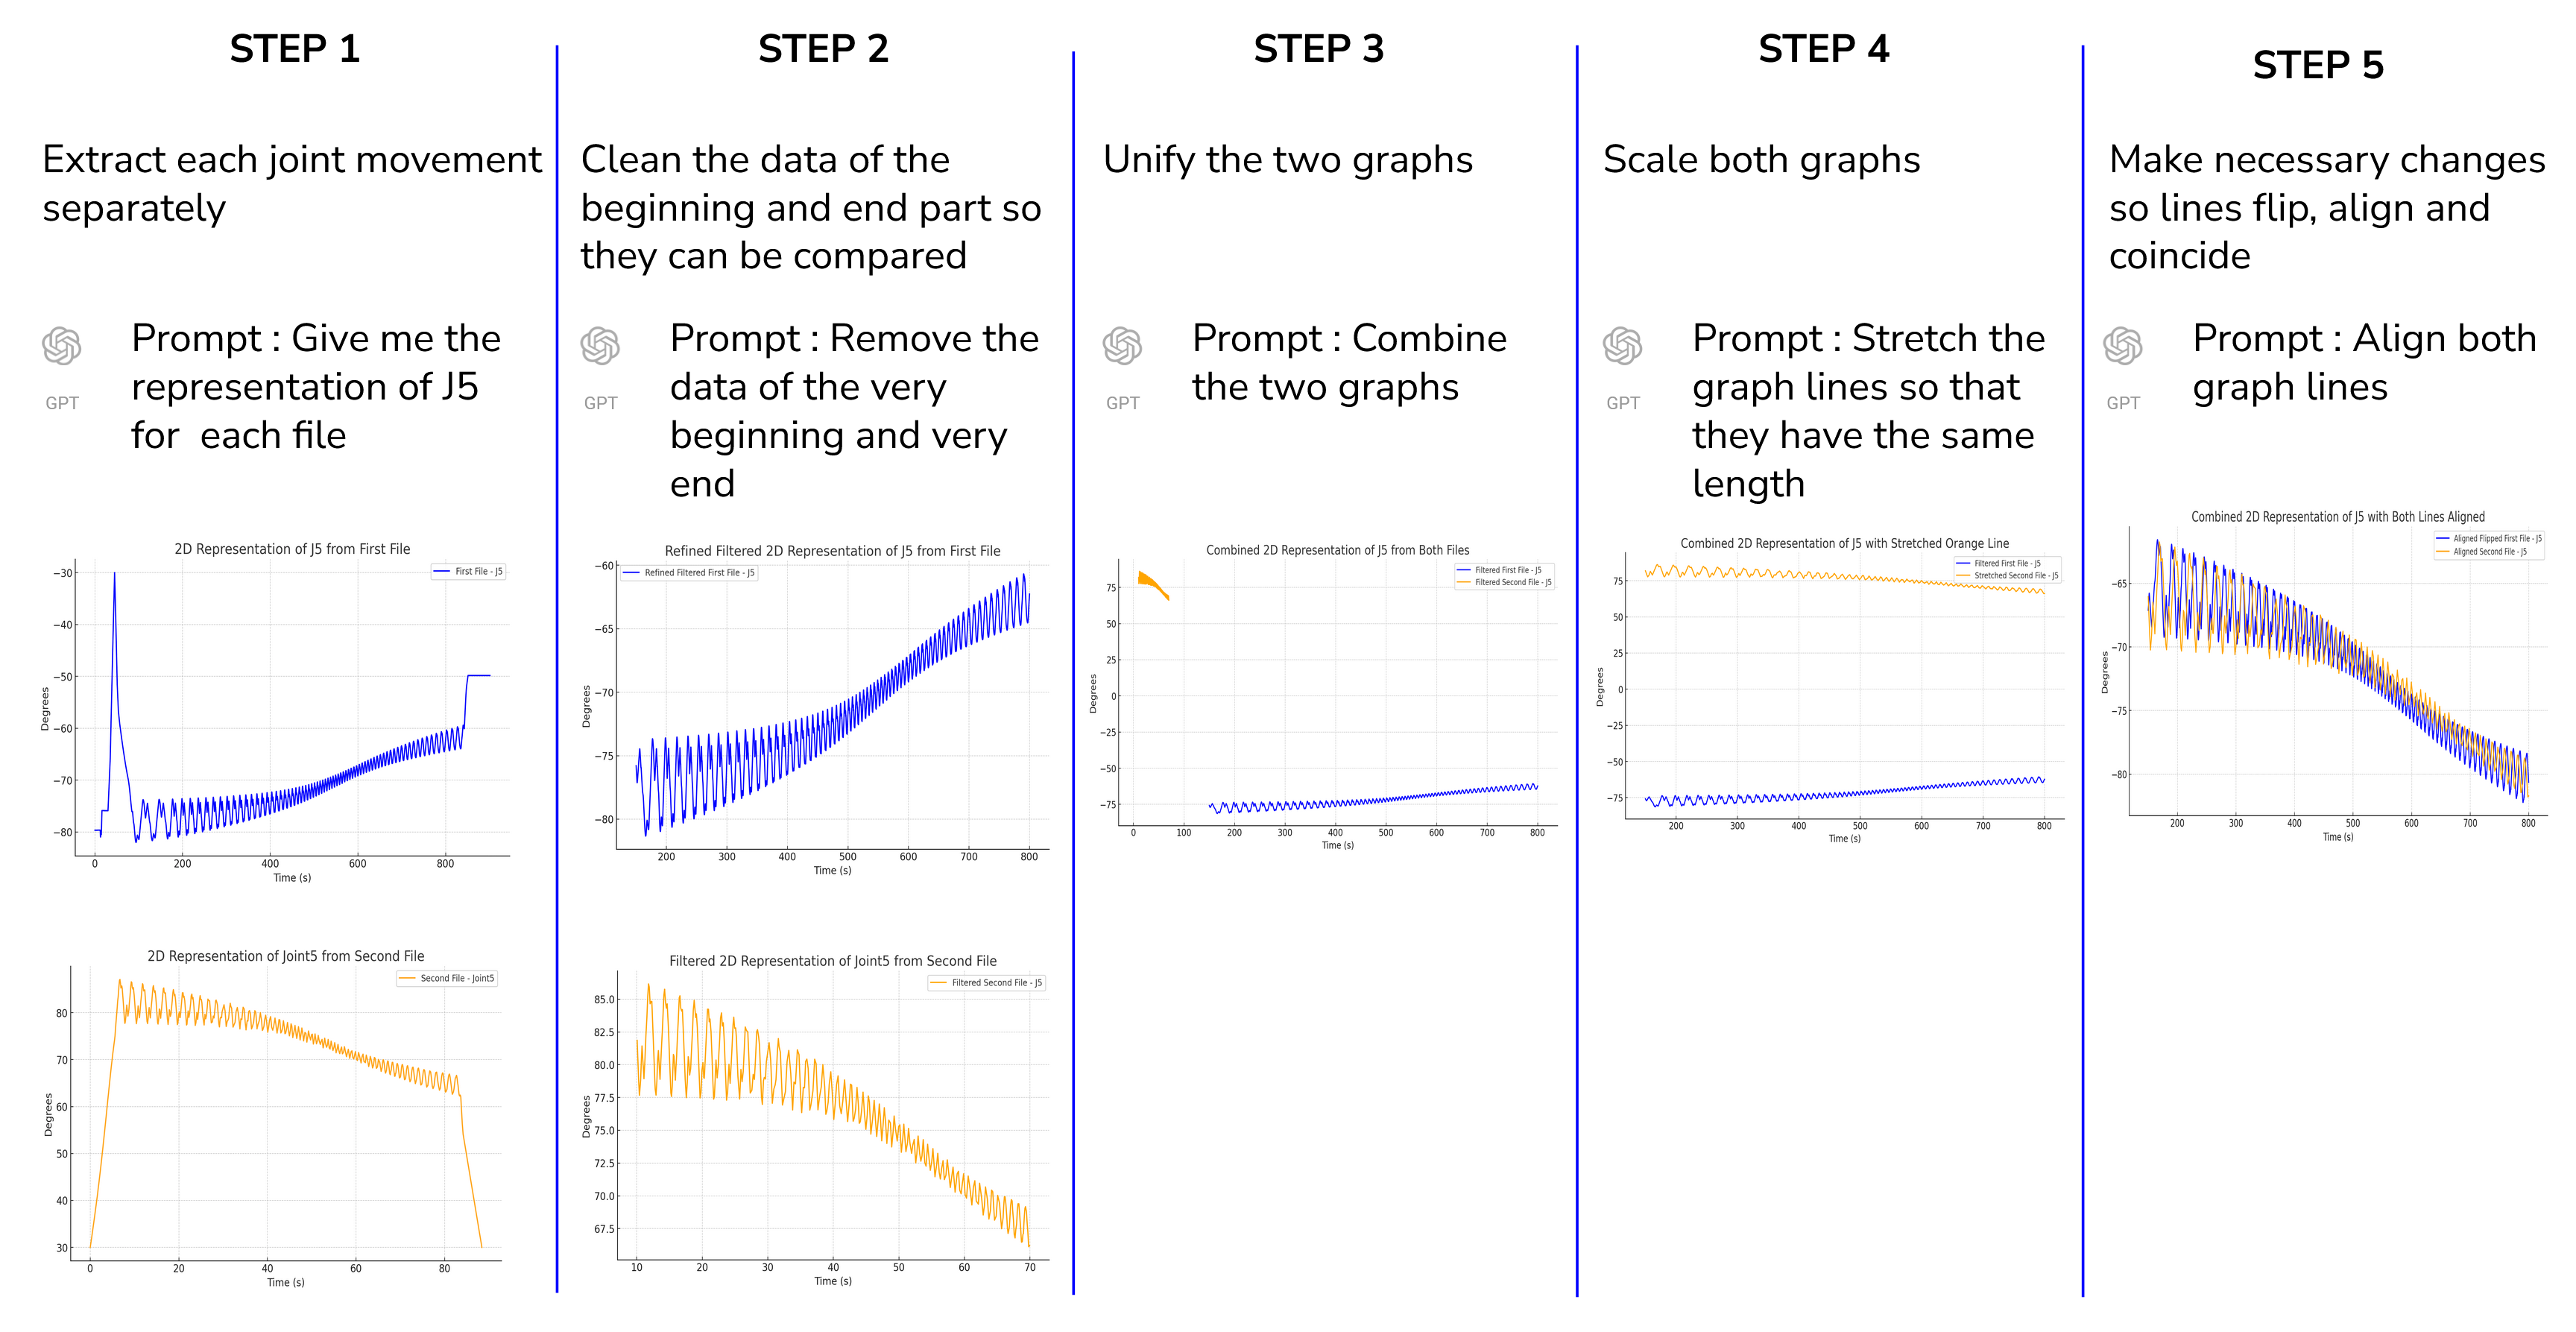
After conducting a comprehensive analysis of the overall graphs, a comparison of each joint individually was then proceeded to gain a deeper understanding of their specific movements. To achieve this, five steps were executed.
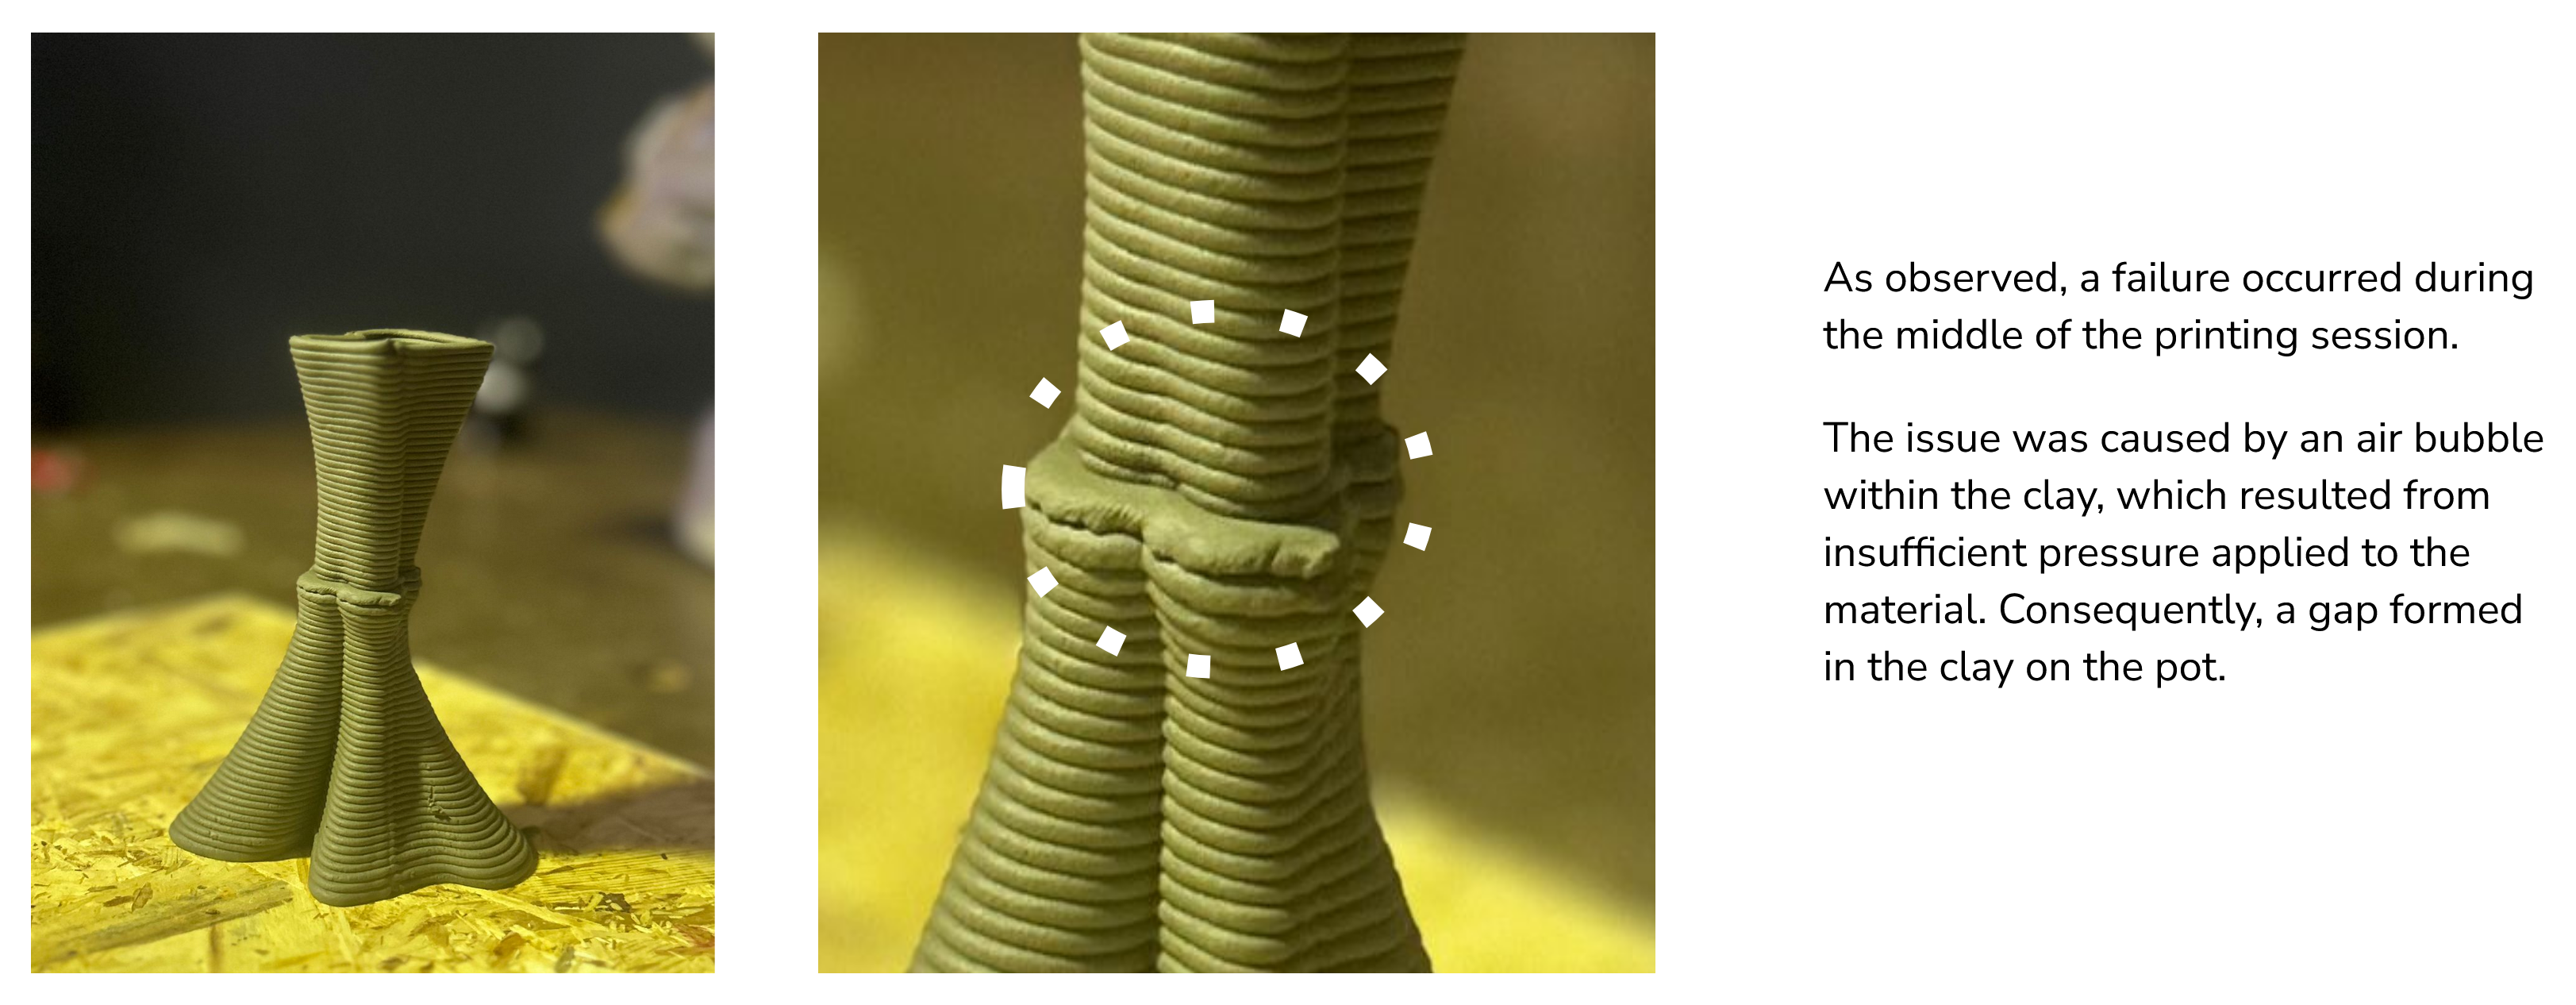
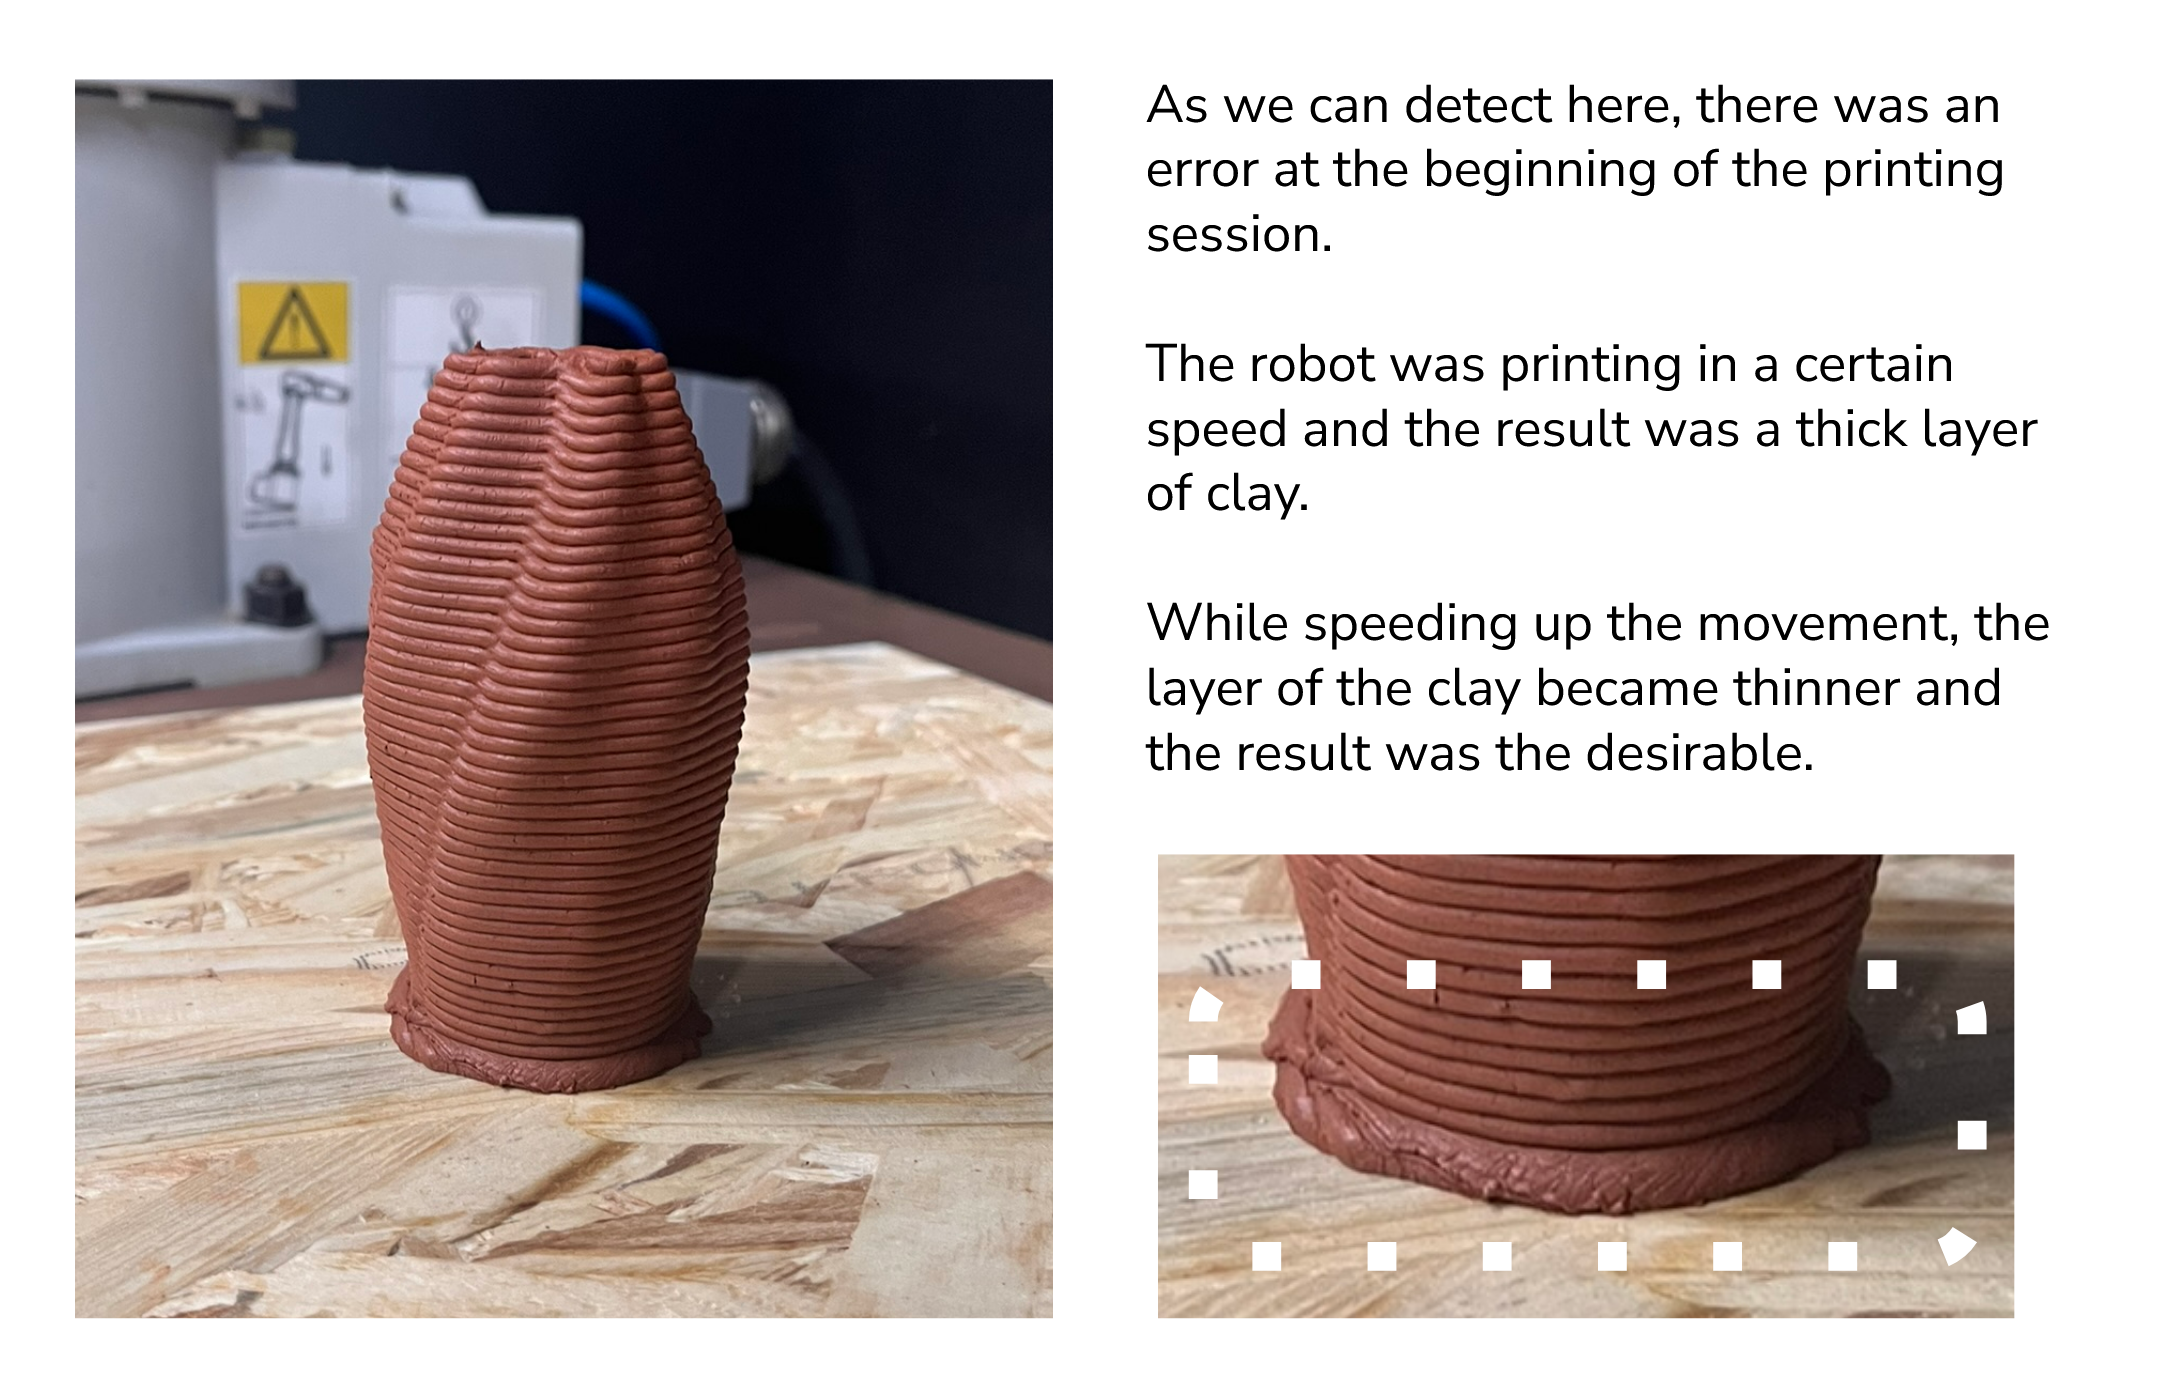
Error and Failures
Prototype 02 - The Fusion Column
Digital Documentation
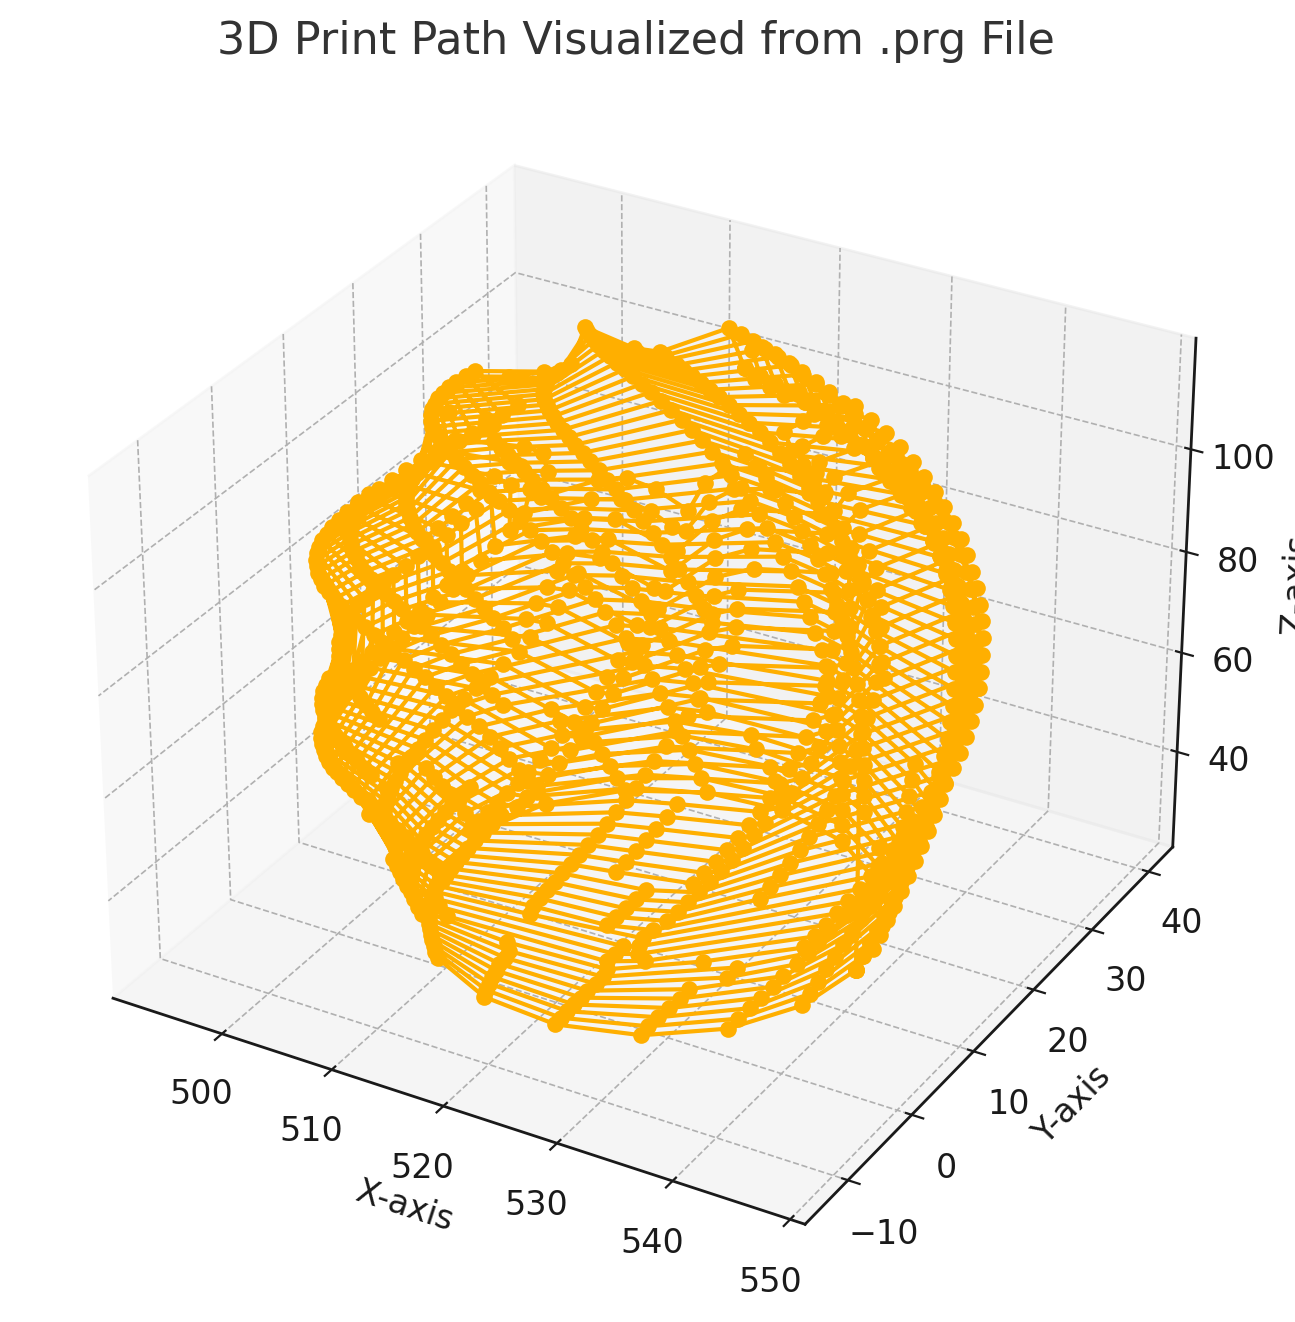
Graph Analysis
The same procedure was applied to analyze the joint movements in both the offline and real-time simulations.
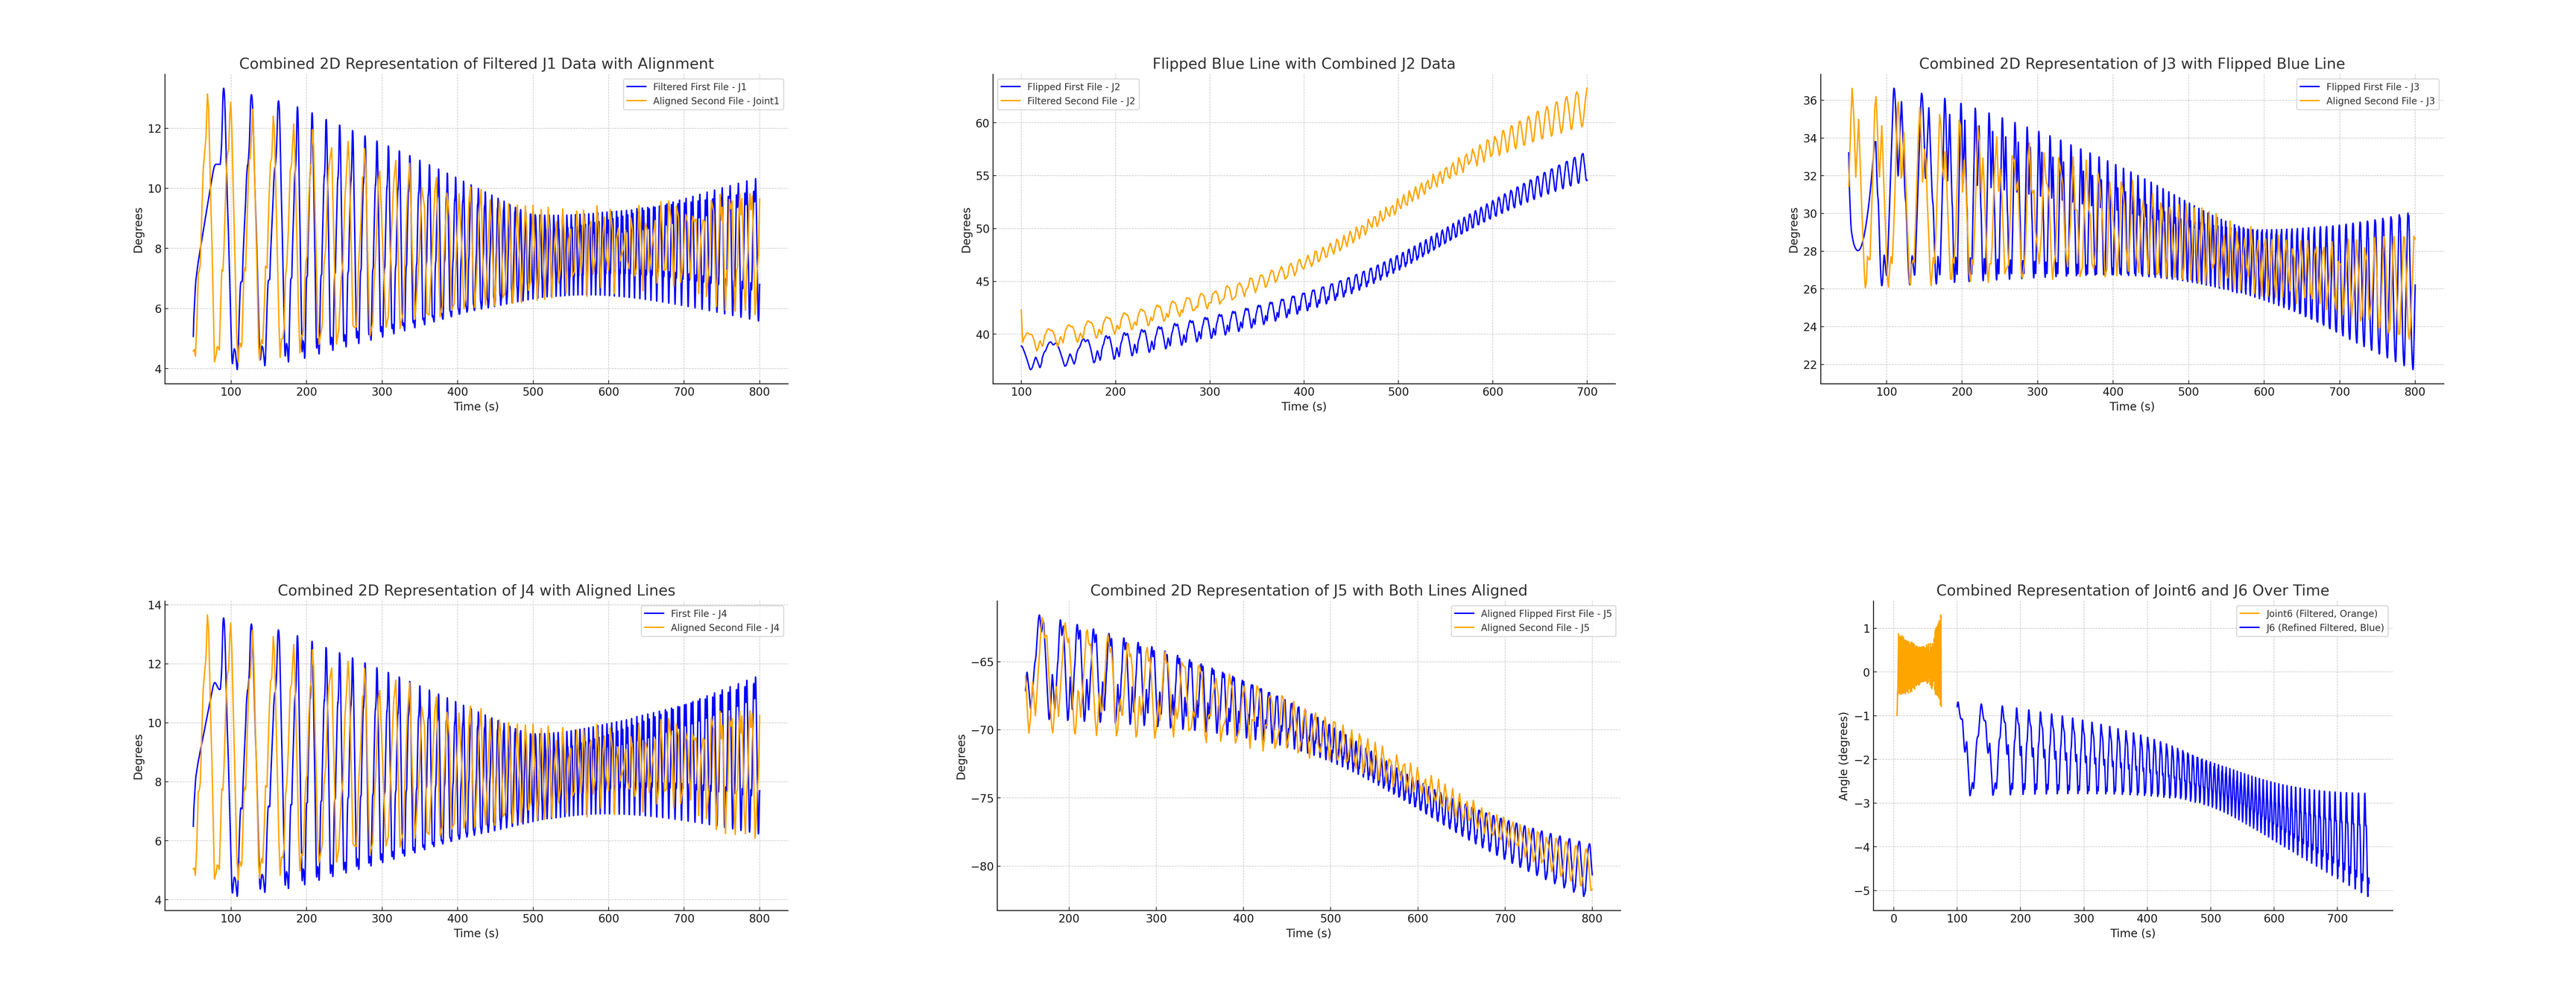
At this stage, however, a different approach was taken to compare the movement of each joint. Python code was utilized to read the data, perform the analysis, and generate the corresponding graphs.
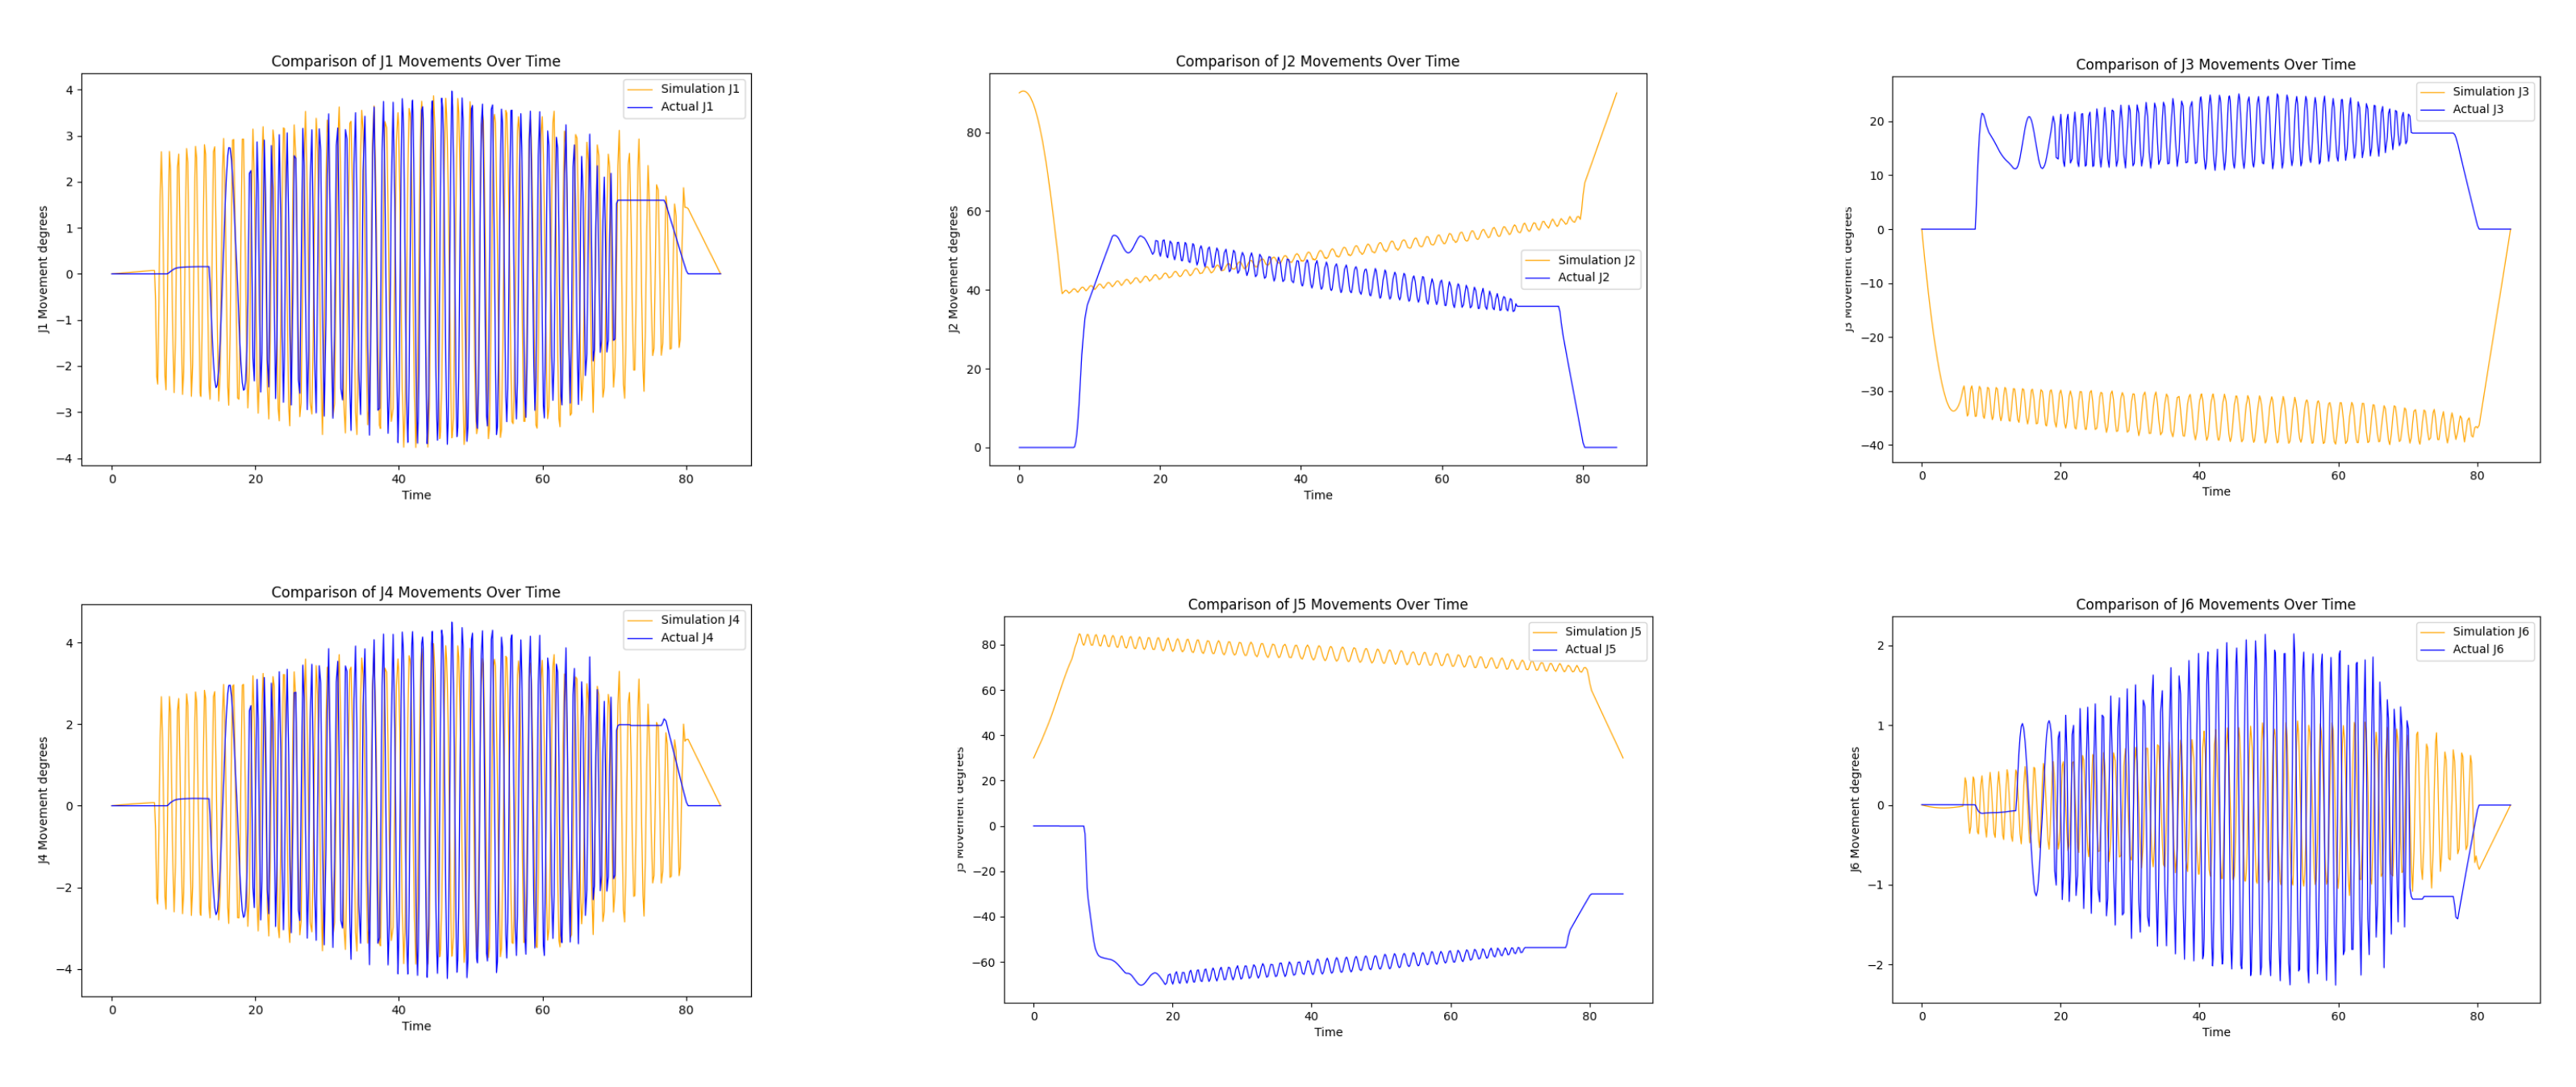
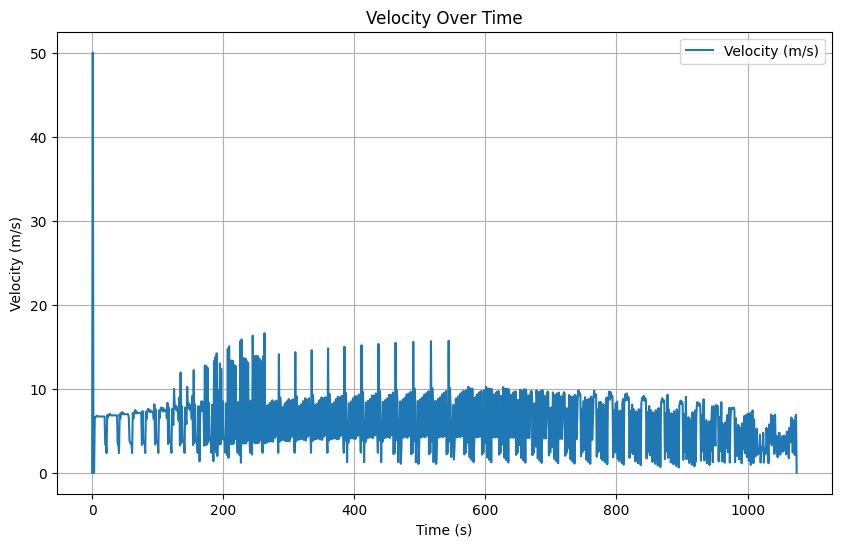
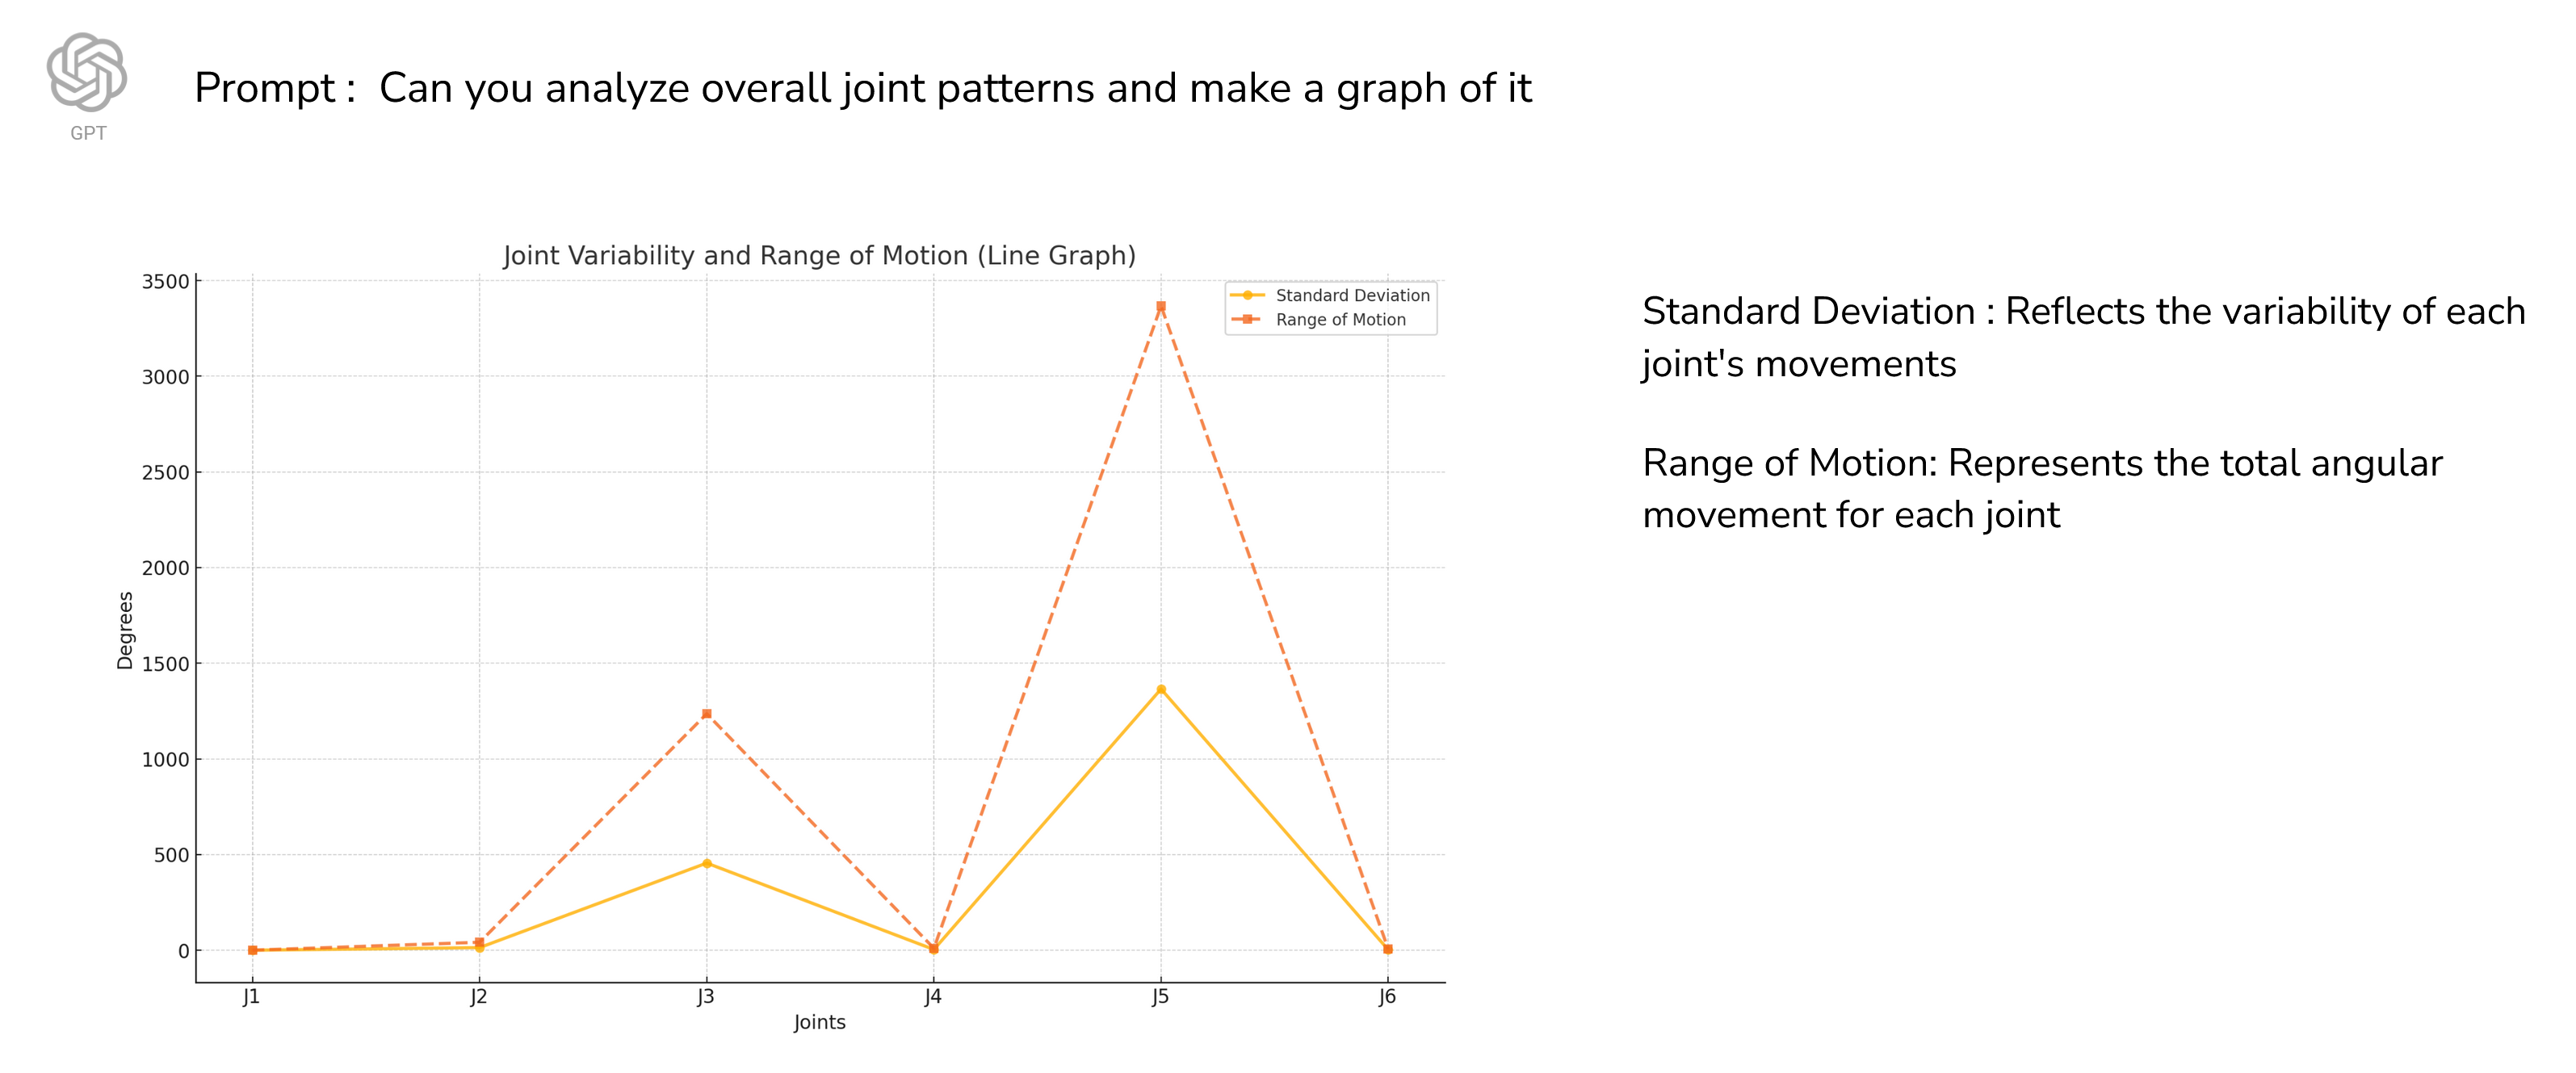
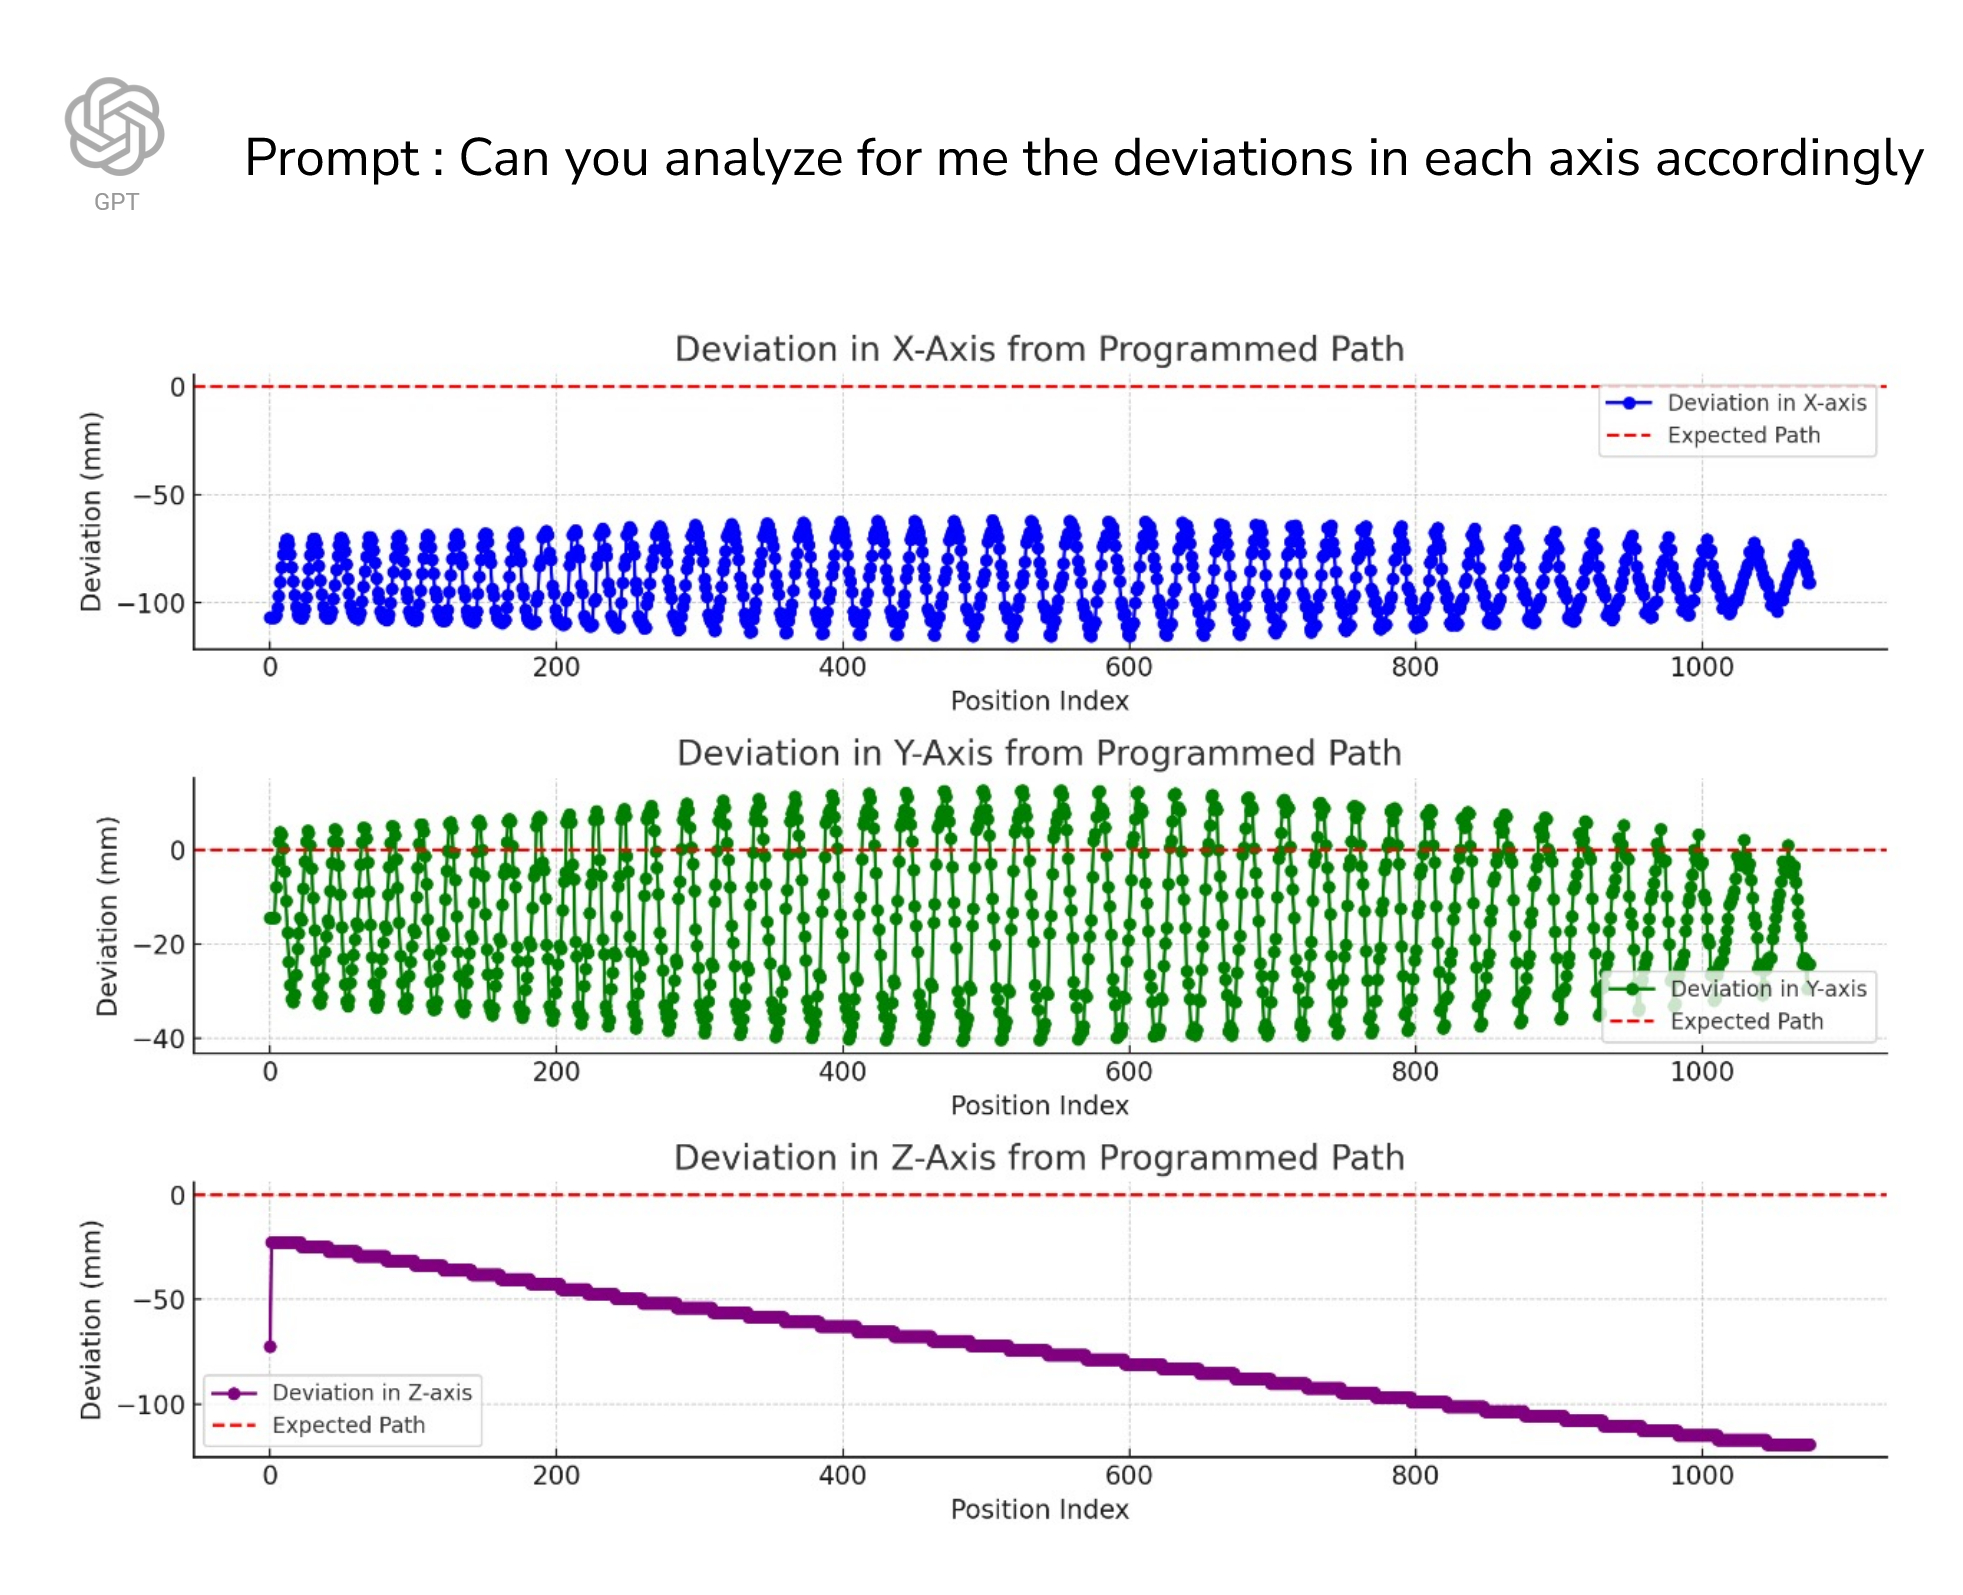
The following series of graphs analyze various parameters in detail.
Error and Failures
Video Documentation
AI-Driven Applications
