The exploratory analysis performed by Josefina Ovalle, Maja Mawusi and Michał Modelski
We present you an exploratory analysis on the New York City’s Citi Bike network in New Jersey. We chose the latest dataset, from October 2024, that gives us data on bike stations, bike types, bike users, and bike usage over time. The choice seemed relevant for our personal preferences – we are all eager public bike riders, as well as MaCT course – as it includes geospatial data. We also looked for a well categorized and clean data and the one we used seemed to match all of the criteria.
The dataset consists of 118308 records. Each one corresponds to one full rental cycle – the rental starts and finishes over time.
The research involved studying:
- Relationship between bike rentals and types of bike and customer.
- Spatiotemporal analysis.
- Station popularity ranking.
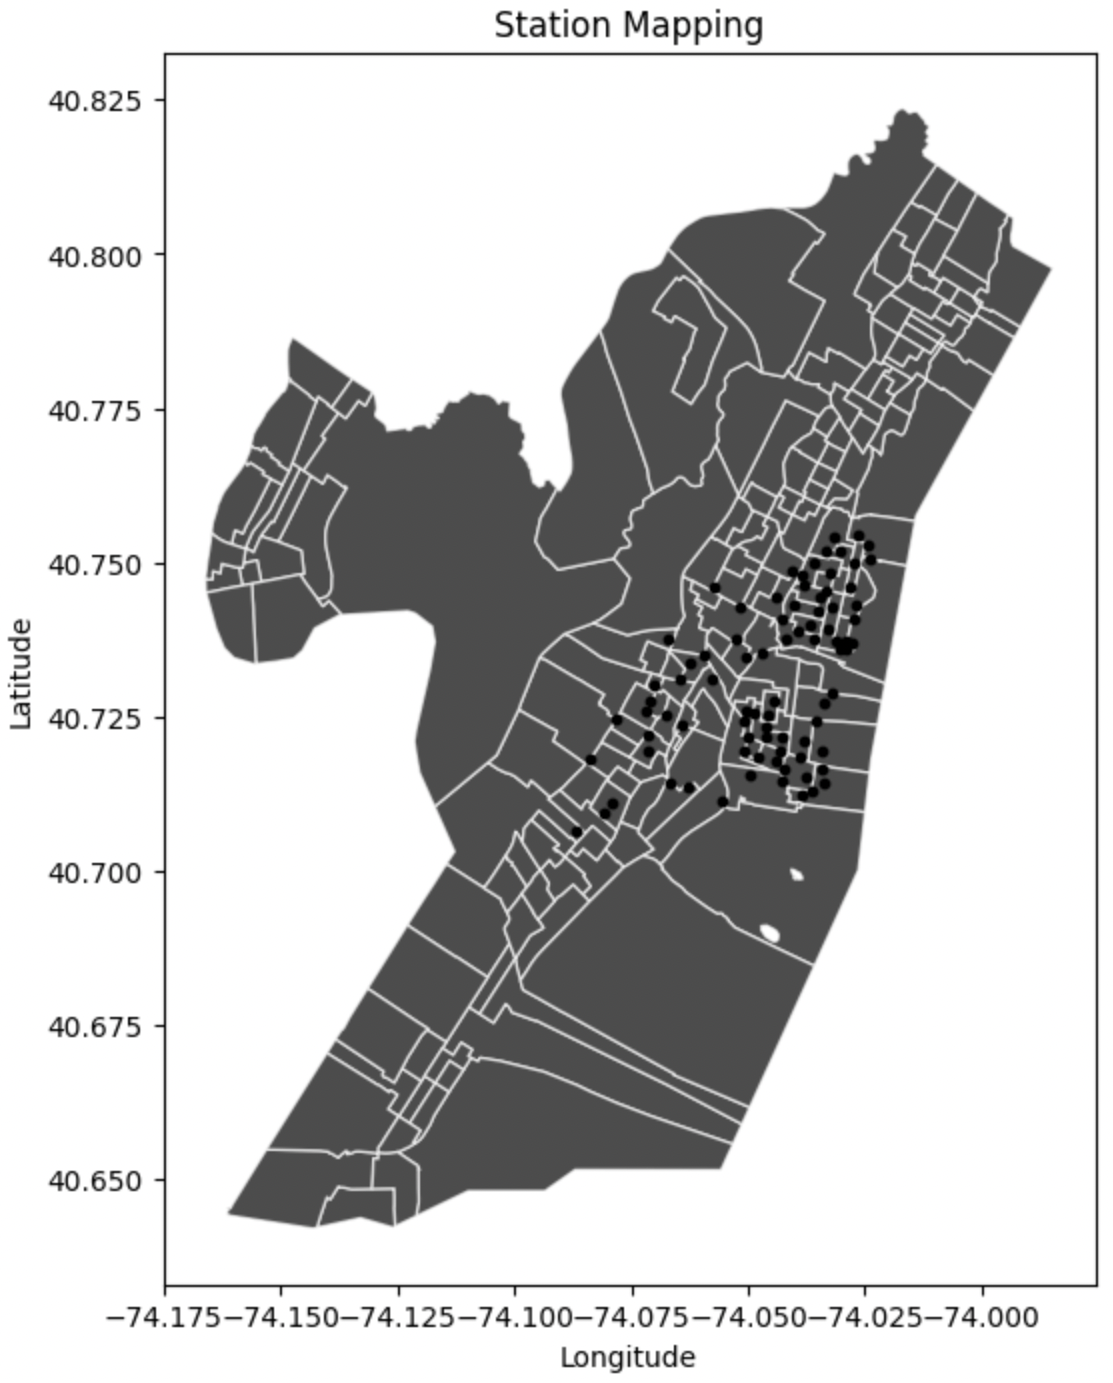
- Station mapping over a map of Jersey City.
- Relations between stations.
- Mobility patterns.
- Length of bike rentals.
The analyses performed in the following research notebook rely mostly libraries like Pandas, GeoPandas, Plotly and Matplotlib that allowed us to explore the data found in a dataset to the fullest. Each analysis involves cleaning used data and visualising it.
Exploring the relation between bike stations and ride times.

Temporal analysis.


Analysis of relationship between bike rentals and types of bike and customer.

Analysis of relationship between trip lengths and types of customer.

Analysis of average times spent on a bike.

The Geospatial Analysis
Station Mapping – Plotting stations according to their coordinates

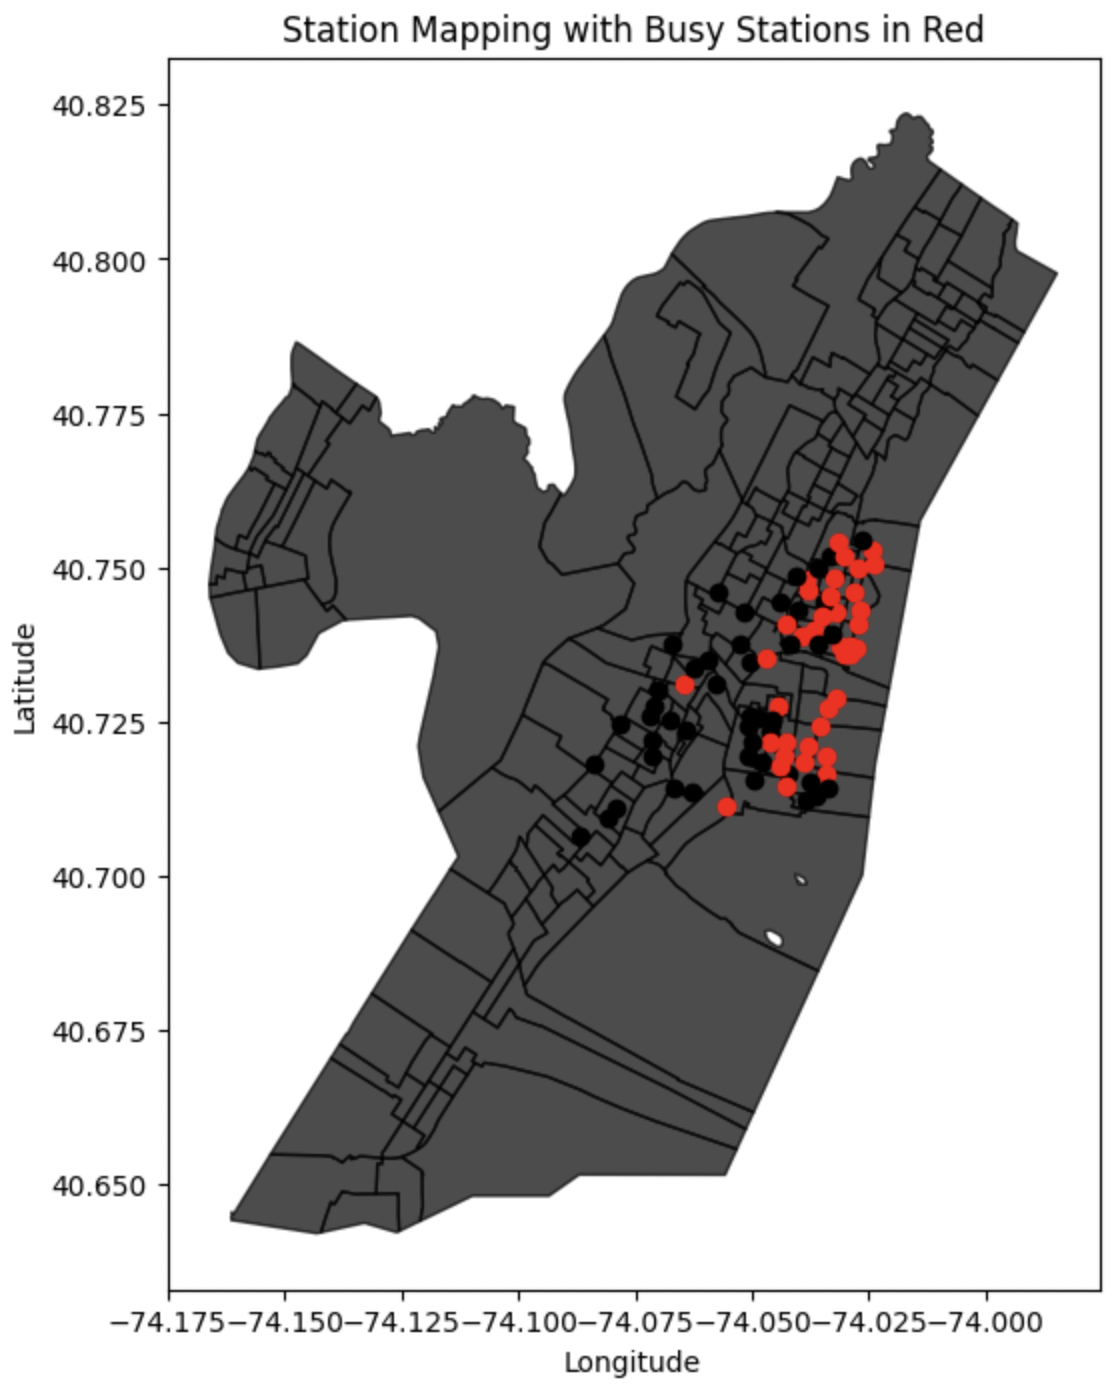
Plotting stations busier than average

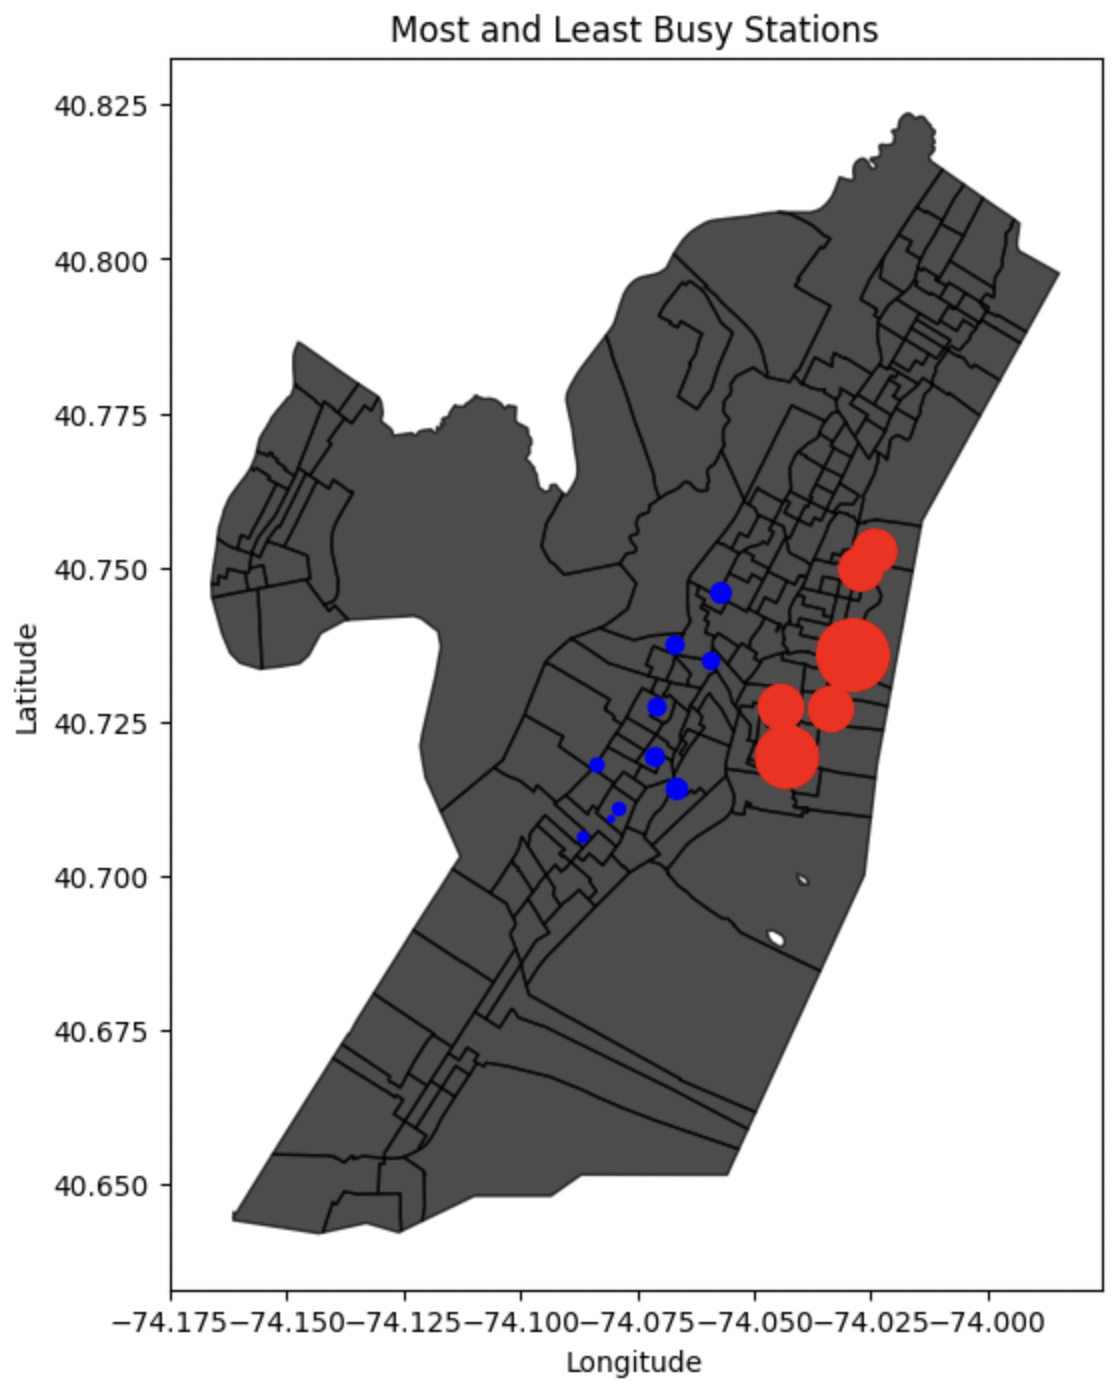
Plotting 10 most and least busy stations


