Austin has a humid subtropical climate (Köppen climate classification: Cfa), characterized by hot summers and mild winters. The city experiences long, hot summers and short, mild winters, with brief transitions in spring and fall. The climate data used in this analysis was obtained from:
– Location: Austin-Mueller Municipal Airport, Texas, USA
– Weather Station ID: 722540
– Latitude: 30.32° N
– Longitude: 97.77° W
– Elevation: 189 meters
– Time Zone: -6.0 (GMT-6)- Source: TMY3 (Typical Meteorological Year 3)
Climate Analysis
Austin experiences a maximum temperature of 40°C, with summer dominating the climate and extending into fall, while spring arrives early in March. The city has an average annual temperature of 20°C and an average humidity of 71%, contributing to heightened levels of discomfort, particularly during humid transitional periods in spring and autumn. The average dew point temperature of 18°C further emphasizes the persistent humidity throughout most of the year. As a sunny city, Austin receives an average of 10 hours of sunlight daily. However, this abundance of sunlight, combined with high temperatures and humidity, results in significant solar radiation impacts, with a maximum harm value of -21.01 kWh/m². These factors contribute to excessive heat loads on buildings, necessitating effective cooling and energy management strategies.
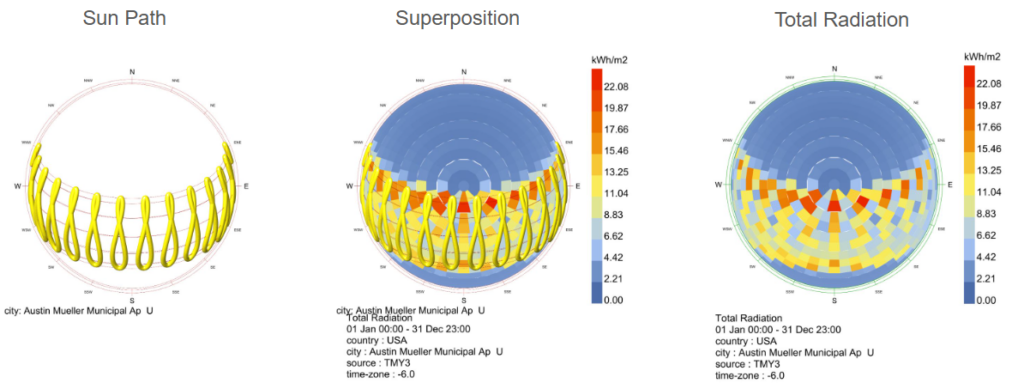
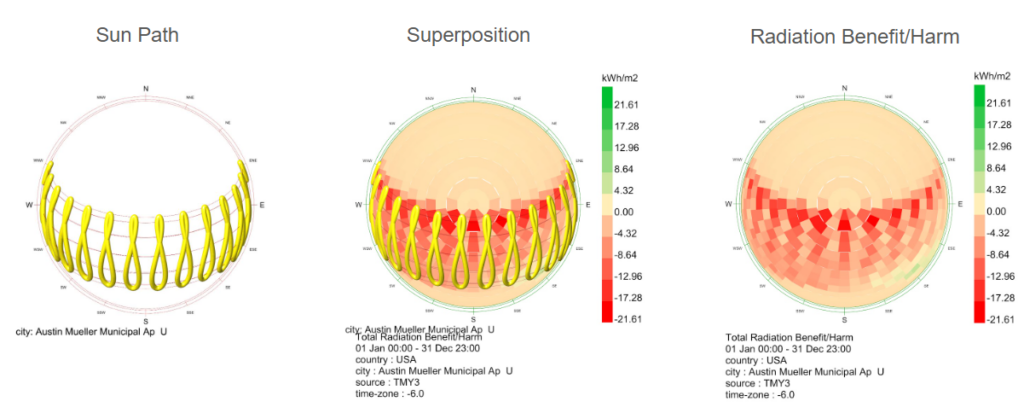
The visualizations above illustrate the solar radiation analysis for Austin Mueller Municipal Airport (USA). The sun path diagram highlights the annual solar trajectory, while the superposition chart overlays radiation intensity data. The “Radiation Benefit/Harm” map reveals negative benefit values, indicating that solar radiation poses more challenges than advantages in this region. These findings underscore the need for energy-efficient strategies, particularly for air conditioning systems, to minimize resource strain and ensure sustainable operation in such conditions.
The Universal Thermal Climate Index (UTCI) analysis shown above aligns with the earlier climate findings, confirming that Austin experiences uncomfortable thermal conditions for most of the year. The high temperatures, particularly during the prolonged summer season, drive a significant demand for cooling, emphasizing the need for efficient energy solutions to manage the thermal environment effectively.
The figure illustrates the Universal Thermal Climate Index (UTCI) conditions throughout the year for Austin, with detailed breakdowns based on varying environmental scenarios: the combined influence of sun and wind, sun only, wind only, and the absence of both factors. The charts are heatmaps where the x-axis represents the months of the year, and the y-axis denotes the time of day, from midnight to midnight (24-hour scale). The color-coded legend indicates different levels of thermal comfort, ranging from strong cold to strong heat, providing an hourly assessment of thermal stress under each scenario.
- Sun and Wind (49.5% Comfortable Hours):
This chart shows the UTCI levels when both solar radiation and wind are present. The prevalence of warm conditions, especially during the summer months, dominates the chart with extended periods of moderate to strong heat, marked by red and orange hues. During winter, there are occasional blue and purple zones, signifying moderate to strong cold. Comfortable conditions (yellow) are relatively sparse and primarily occur during transitional seasons like spring and fall. - Only Sun (46.8% Comfortable Hours):
When solar radiation is the sole factor, the chart exhibits heightened levels of heat stress, particularly during daylight hours. The absence of wind exacerbates thermal discomfort, as reflected in the increased intensity and duration of red and orange sections during warmer months. Winter months show a reduction in cold stress compared to the “Sun and Wind” scenario due to the lack of wind chill. - Only Wind (57.16% Comfortable Hours):
In this scenario, wind plays a dominant role in moderating temperatures, leading to a greater proportion of yellow zones, representing comfort. The chart shows less extreme heat compared to the sun-dominated conditions, with fewer red areas in summer. Conversely, winter cold stress remains prominent in the absence of solar warming, with significant blue and purple areas indicating cold discomfort. - Neither Sun Nor Wind (57.86% Comfortable Hours):
When neither sun nor wind is present, thermal conditions appear more stable and less extreme. This chart shows the highest proportion of comfortable hours (yellow zones) across the year, as the absence of dynamic factors like solar radiation and wind chill results in more moderate conditions. Heat and cold stress are less pronounced, with red and blue areas relatively subdued compared to the other scenarios.
Overall, the analysis underscores the impact of solar radiation and wind on outdoor thermal comfort. Conditions with neither sun nor wind yield the highest proportion of comfortable hours, while those influenced solely by the sun show the least comfort.
Psychrometric Chart (Evaporative Cooling):
- This chart represents Austin’s weather data on a psychrometric chart, which correlates dry-bulb temperature (horizontal axis), humidity ratio (vertical axis), and other parameters such as relative humidity and enthalpy.
- Blue Points: Represent times where the thermal comfort condition is met based on the given criteria
- Red Points: Indicate times when conditions are uncomfortable.
- The majority of comfortable conditions occur at moderate temperatures and humidity levels, clustering in a specific area of the psychrometric chart. However, a significant portion of the points (red) falls outside the comfort zone, suggesting uncomfortable conditions dominate.
Comfort Timeline (Bottom):
- This timeline visualizes thermal comfort over the year, with time of day (12 AM to 12 PM) on the vertical axis and months (January to December) on the horizontal axis.
- Blue (Comfortable): Occurs sporadically throughout the year, with better comfort levels during cooler months (e.g., January, February, and part of October through December).
- Red (Uncomfortable): Dominates most of the year, especially during the summer months (April–September). Austin’s hot, humid conditions during summer likely exceed comfort thresholds.
Psychrometric Chart (Mass + Ventilation):
- The blue comfort zone is further expanded, indicating better results in mitigating discomfort conditions.
- However, there remains a significant number of red points outside the comfort zone, suggesting that even with more advanced strategies, Austin’s climate still poses challenges.
Comfort Timeline (Bottom):
- The timeline confirms the previous observations, with thermal discomfort (red zones) dominating during the summer months.
- Improvements in comfort conditions are more evident in the winter and transitional months, with slightly reduced discomfort compared to the earlier charts.
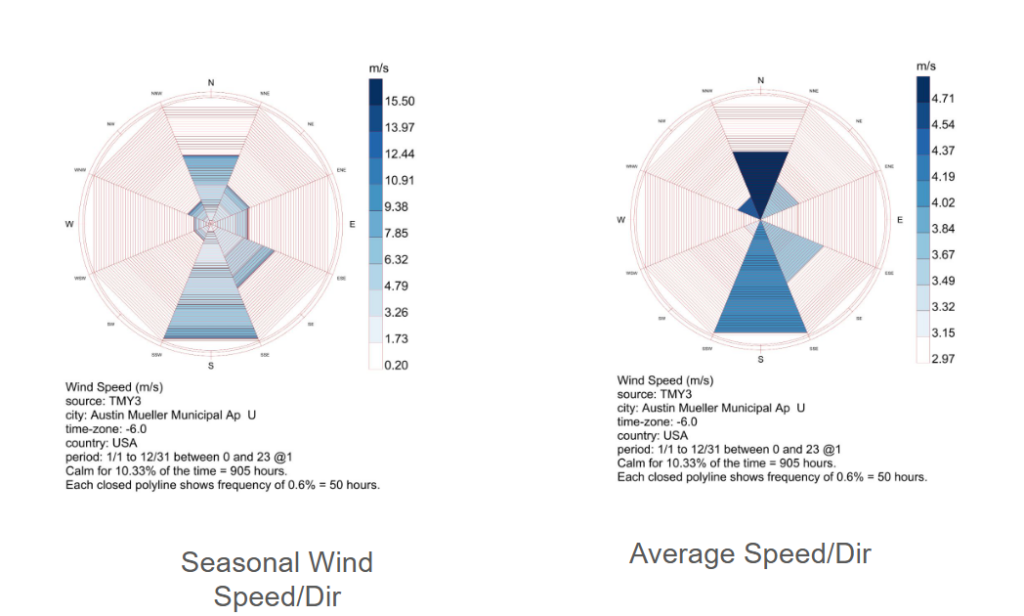
The charts provide an analysis of wind data. The first row of images includes two wind roses. The left wind rose displays the seasonal wind speed and direction, where the length and width of the petals indicate the frequency and intensity of wind from various directions. Darker shades in the petals represent higher wind speeds, with maximum speeds reaching 15.50 m/s. The right wind rose illustrates the average wind speed and direction, with darker blue petals corresponding to higher average speeds.
The second row contains the wind direction heatmap, which tracks the predominant wind direction (degrees) over time, segmented by hour of the day and throughout the year. Each pixel’s color represents the wind direction, with blue tones for northern winds and red for southern winds. The wind speed heatmap visualizes hourly wind speeds across the year. Warmer colors (reds and oranges) indicate higher wind speeds, while cooler colors (greens and blues) show lower speeds.
- Most Common Wind Directions:
- The wind predominantly blows from the south-southeast (SSE) and north (N) directions, as seen in both the seasonal and average wind rose diagrams.
- The wind direction heatmap confirms this pattern throughout the year, with sustained periods of southern and northern winds.
- Seasonal Variations:
- The wind direction shifts slightly seasonally, but the general trend of SSE and N dominance remains consistent.
- Variability in wind direction (as indicated by the heatmap) suggests less dominant patterns at certain times, possibly due to weather events or transitional seasons.
- Wind Speeds:
- Wind speeds generally range from 0 to 15.5 m/s, with most speeds falling between 3–10 m/s, as shown in both the wind rose diagrams and the speed heatmap.
- Calm conditions occur approximately 10.33% of the time, indicating relatively consistent wind activity throughout the year.
Key Observations
Summer is significantly long, lasting from mid-April to early November, characterized by temperatures consistently above 25°C. Winter is shorter, lasting from early December to early/mid-February.
Solar radiation is a key driver of Austin’s hot summers, with radiation levels peaking during this period, dropping considerably in winter.
There seems to be a clear pattern of lower humidity during summer, while humidity rises during transitional seasons (spring and fall) and remains moderate during winter.
Spring and fall are the wettest seasons, while summer is particularly dry. Winter sees moderate but consistent rainfall, while fall experiences increased precipitation as summer ends.
Austin is not a particularly windy city. Spring is the windiest season, yet it does not see extreme velocities and remains calm.
Environmental Analysis
Thermal Comfort
Incorporating native plant species into building facades serves as a highly effective strategy for reducing solar radiation and improving thermal comfort. Native trees such as the Texas Red Oak and Desert Willow provide significant shading during summer months, with shading coefficients as high as 0.85, while allowing sunlight to penetrate during winter when their leaves are shed.

These deciduous species not only moderate seasonal temperature extremes but also require minimal water and maintenance, aligning with sustainable design goals. Meanwhile, evergreen options like Texas Mountain Laurel and Yaupon Holly ensure consistent shading throughout the year, with year-round coefficients of up to 0.80. Climbing plants such as Virginia Creeper and Cross Vine can be utilized to cover vertical surfaces, reducing heat absorption and contributing to natural cooling while maintaining low water needs. By strategically integrating these plants into facades, designers can create energy-efficient, visually appealing, and environmentally resilient structures tailored to Austin’s climate.
Universal Thermal Climate Index
The Universal Thermal Climate Index (UTCI) analysis for Austin, Texas, without the integration of shading balconies or vegetation, reveals critical insights into the comfort levels experienced throughout the year. The results highlight that under current conditions, only 49.5% of the time is considered comfortable when combining the effects of sun and wind. Separately, wind alone contributes to a comfort rate of 57.16%, while solely solar conditions reduce comfort to 46.8%. A substantial portion of the year, 57.86%, falls into categories outside the comfort range, indicating significant periods where thermal mitigation strategies are required.

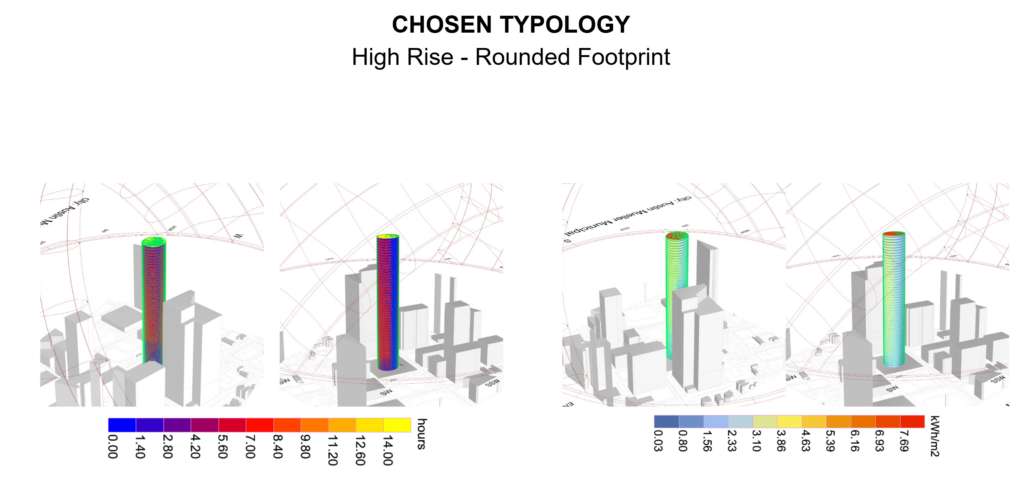
These figures underscore the harsh impact of Austin’s long, hot summers, where high solar radiation levels and elevated temperatures drive discomfort. The UTCI simulation maps illustrate how solar exposure intensifies thermal stress, particularly on the exposed facades and rooftops of buildings. The original orientation of the analyzed structure already reveals high radiation absorption concentrated on specific sections of the facade. Rotating the structure minimally redistributes these radiation hotspots but does not significantly alleviate thermal loads.
The “feels-like” temperatures revealed in the UTCI results are also amplified by Austin’s typical humidity levels, creating an environment where even moderate changes in solar exposure can have pronounced effects on occupant comfort. This dynamic emphasizes the need for design interventions that address both direct solar radiation and the broader climatic conditions.
The spatial analysis of radiation and sun hours further underscores the concentrated solar loads on the building. Areas with persistent high radiation levels correlate strongly with the discomfort periods identified in the UTCI analysis. This alignment points to the urgency of developing strategies to moderate these thermal effects, as prolonged exposure exacerbates both energy demands for cooling and the overall thermal discomfort of the building’s occupants.
Mitigating Solar Radiation on Building Facades
To address the high solar radiation levels identified in the UTCI analysis, the integration of balconies was explored as a passive strategy for mitigating thermal loads on the building facade. Initial simulations tested balcony depths of 3 and 4 meters, providing critical insights into the impact of overhang dimensions on solar shading performance. A final iteration incorporated 3-meter-deep balconies with the addition of vegetation, resulting in notable cooling effects and enhanced facade performance.
The 3-meter balcony configuration significantly reduced solar radiation exposure on the facade by introducing consistent horizontal shading. This intervention provided relief to lower and mid-levels of the building, particularly during peak sunlight hours. However, the upper sections remained partially exposed to higher solar radiation levels due to the limited depth of the overhangs. The shading pattern demonstrated that while effective, a 3-meter depth offered incomplete protection for areas receiving the highest solar loads.
Increasing the depth to 4 meters enhanced the shading coverage substantially. This adjustment extended the protection across the facade, especially on the upper levels, where solar radiation tends to be most intense. The extended overhang reduced heat absorption on exposed surfaces, creating a more uniform cooling effect. However, the increased balcony depth introduced considerations around structural implications and potential impacts on daylighting, as deeper balconies can obstruct natural light penetration into interior spaces.

To optimize performance without compromising other design factors, the final configuration reintroduced 3-meter balconies with integrated vegetation. The addition of plants provided a dynamic, adaptive shading mechanism that further reduced solar radiation on the facade. Vegetation contributed to cooling through evapotranspiration and added a natural layer of insulation to the building envelope. This solution effectively addressed the residual heat loads observed in the 3-meter balcony-only scenario, while maintaining a balance between shading and daylight access.
The simulations demonstrated that integrating vegetation into the shading system enhanced thermal performance significantly, particularly during the hottest months. The cooling impact extended across all facade levels, as the plants provided additional shade and minimized the heat island effect around the structure. Furthermore, this approach contributed to the aesthetic and ecological value of the building, reinforcing its alignment with sustainable urban design principles.
Exploring Geometry for Optimization
To assess daylight performance, adjustments to the building’s geometry were made to facilitate the simulation process. While the original structure featured an elliptical footprint, the model was reconfigured into rectangular and hexagonal forms. This modification was necessary to ensure compatibility with the simulation tools, allowing for a comprehensive analysis of daylight penetration and distribution. Importantly, all other parameters, including opening ratios and material properties, were maintained to ensure the consistency of results.

The daylight simulation focused on evaluating the effects of window area and facade design on interior daylight conditions. Two approaches were tested: variable window areas and radiation-informed window configurations. With a 0.3 opening ratio over four floors, the models showed limited daylight penetration, as expected, with higher shading coefficients resulting in reduced light entry. Increasing the opening ratio to 0.7 significantly enhanced daylight access, particularly for taller structures. The hexagonal configuration demonstrated better daylight distribution across the facade compared to the rectangular footprint, due to its ability to reduce sharp angular exposures that often concentrate radiation.
This simulation highlights the importance of geometric adaptability in daylight optimization. While the building’s original elliptical form posed challenges for simulation tools, the insights gained from the adjusted geometries can inform the design of the final structure. These results reinforce the value of computational analysis in refining facade designs to maximize natural light, balance solar gain, and enhance overall energy efficiency in urban environments.
Wind Comfort Comparison
The wind comfort analysis using Ladybug and Infrared City tools highlights different perspectives on wind patterns and their potential impact on building performance and outdoor spaces. The Ladybug wind rose indicates dominant wind directions from the south and southeast with speeds averaging between 2.25 and 5.33 m/s, providing valuable insights for natural ventilation strategies. This analysis focuses on wind flow at lower speeds, emphasizing calm conditions that prevail for over 10% of the year. Ladybug’s detailed breakdown of wind speeds and directions is particularly useful for designing ventilation systems and optimizing window placement to harness prevailing breezes effectively.

Infrared City, on the other hand, provides a broader perspective by capturing higher wind speed ranges and their directional patterns. The tool shows how wind speeds can exceed 10 m/s in some cases, particularly from the north, a condition less prominent in Ladybug’s analysis. Infrared City’s visualization is better suited for assessing wind comfort and safety in outdoor spaces, identifying potential high-speed zones that may require mitigation strategies. Together, these tools offer complementary insights, enabling a comprehensive approach to designing for both indoor air quality and outdoor comfort in Austin’s climatic context.
Evaluating Wind Comfort and Speed with Infrared Analysis
The Infrared simulation tool provided a detailed analysis of site wind comfort and speed, offering valuable insights into how wind flows through the urban environment. The wind comfort maps, simulated at wind directions of 180° and speeds of 15 m/s and 30 m/s, illustrate areas where outdoor conditions are most and least favorable for pedestrian activity. At lower wind speeds (15 m/s), comfort levels are predominantly high across the site, with localized areas of discomfort near open spaces and wind corridors. However, when wind speeds increase to 30 m/s, a significant reduction in comfortable zones is evident, particularly near the edges of large buildings where wind accelerates due to channeling effects.

The wind speed analysis complements this by highlighting how airflow intensifies around tall structures and narrow passages. The spatial distribution of wind speeds reveals hotspots at specific corners and open areas where wind gains velocity, creating potential challenges for outdoor usability. These simulations underscore the importance of addressing both comfort and wind hazards in urban design, allowing architects to strategically implement interventions like windbreaks or adjusted building forms to create more pleasant and safer public spaces.
Wind Speed Analysis with Oval Geometry Using GH Infrared Plugin
The Infrared plugin in Grasshopper was utilized to simulate wind interactions with the actual oval building geometry under a controlled wind direction of 90° and an exaggerated wind speed of 30 m/s. This extreme condition was chosen not to reflect realistic wind scenarios in Austin but to emphasize critical problem areas where wind accelerates and creates potential discomfort or hazards. The analysis highlights the impact of building geometry on wind flow, revealing concentrated high-speed zones around sharp corners and narrow passages between structures.

The results demonstrate that the oval geometry contributes to smoother wind redirection compared to angular forms, yet high wind velocities still occur at the edges and areas where airflow is compressed. These hotspots, shown in red, underline the importance of mitigating measures such as landscaping, porous barriers, or adjusted building form to reduce wind speed in pedestrian zones. This exercise provided essential insights into the aerodynamic behavior of the oval geometry, informing strategies to improve both environmental comfort and safety.
Results & Outlook
The climate data analysis for Austin revealed a critical insight that significantly informs design strategies—the harsh summer conditions extend far beyond the conventional three-month summer period. Instead, high temperatures, elevated relative humidity, and intense solar radiation persist for nearly six months, from late April to early November. This extended summer period defines Austin’s climatic reality and poses a prolonged challenge for thermal comfort and energy efficiency.

With average temperatures exceeding 25°C during these months and peak solar radiation reaching up to 21.35 kWh/m², the sustained heat places substantial strain on building systems and occupant comfort. The overlap of high temperatures with elevated humidity levels intensifies the “feels-like” temperature, exacerbating the discomfort experienced both indoors and outdoors. Consequently, any architectural or urban design intervention must prioritize strategies to mitigate the extended thermal impact, shifting the focus from seasonal to year-round resilience in addressing Austin’s unique environmental demands. This understanding sets the stage for informed solutions targeting solar gain reduction, natural ventilation optimization, and the integration of cooling strategies tailored to this prolonged summer challenge.
Form-Finding for Optimized Design Strategies
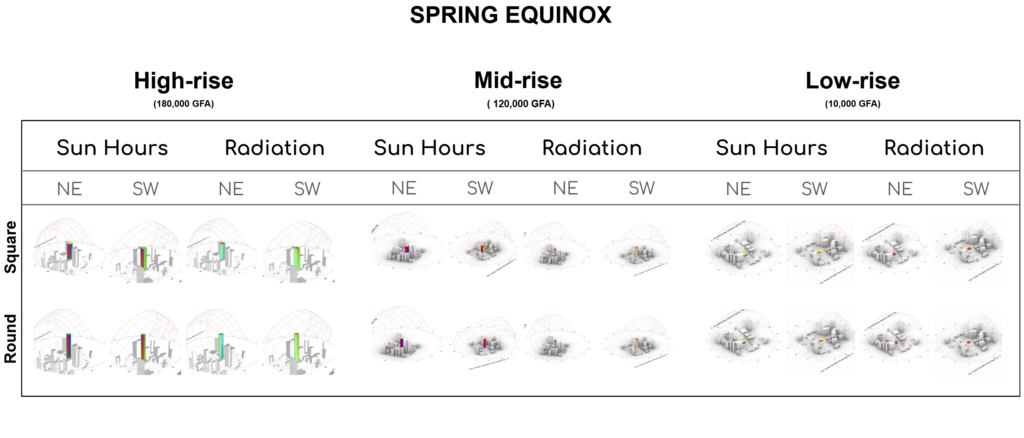
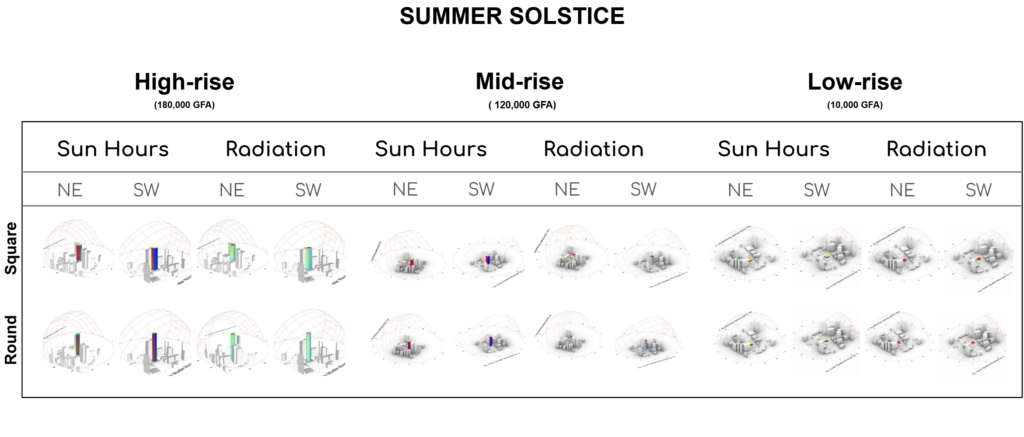
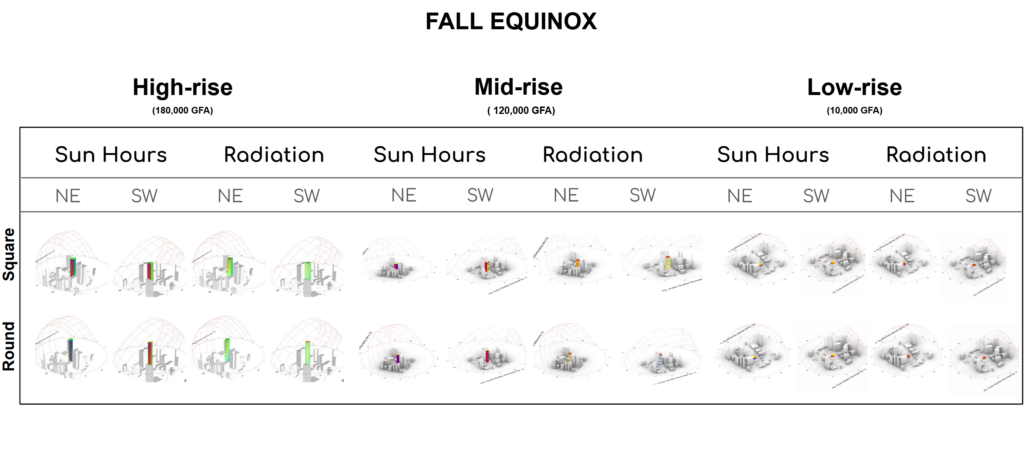
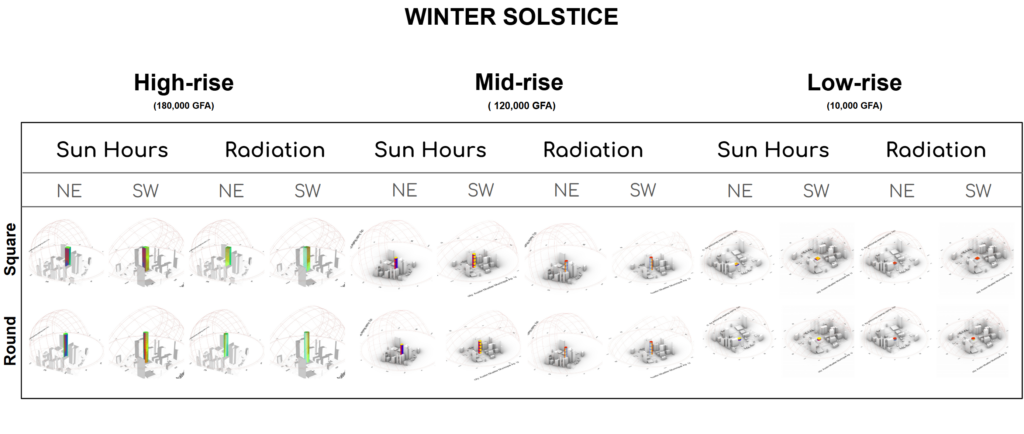
The form-finding exercise compared square and elliptical building geometries across three densities—low, mid, and high-rise structures. This rigorous analysis evaluated each configuration’s exposure to solar radiation and energy efficiency across seasonal solstices and equinoxes. The results illuminated critical differences, with the elliptical high-rise emerging as the most vulnerable typology in terms of solar radiation exposure and overall thermal inefficiency.

By its curved surface and larger vertical span, the elliptical high-rise exhibited the lowest percentage of long shading hours (L.S.H.) during the summer solstice at 23.1%, while accumulating the highest total energy input at 97,659.95 kWh. This susceptibility to solar radiation makes it an ideal candidate for targeted design improvements. While the elliptical geometry and high-rise density presented the most challenging scenario, it also offered the greatest potential for innovation in integrating mitigation strategies such as shading systems, vegetation, and advanced facade technologies to counteract its inherent vulnerabilities. This data-driven insight establishes the high-rise elliptical form as a focus for optimizing thermal and energy performance.
Mitigating Solar Radiation with Native Landscape
The final iteration of the high-rise elliptical geometry incorporates a targeted strategy to mitigate the effects of solar radiation through the addition of 3-meter-deep balconies and native vegetation. To optimize performance, greenery was applied strategically to the most solar-exposed side of the facade. Native plants and trees, such as Texas Red Oak, Desert Willow, and Cross Vine, were chosen for their high shading coefficients, adaptability to Austin’s climate, and low water requirements, providing both thermal and ecological benefits.

This configuration significantly reduces the solar load on the building facade, as demonstrated by the radiation analysis. The native greenery not only shades the facade but also contributes to cooling through evapotranspiration, lowering the surface temperature and enhancing overall thermal comfort. The integration of vegetation into the building’s architectural elements creates a harmonious balance between functionality and sustainability. This solution addresses Austin’s extended summer conditions, transforming the facade into a dynamic, living system capable of adapting to environmental challenges while reinforcing the building’s aesthetic appeal. This final design represents a thoughtful synthesis of data-driven insights and innovative architectural strategies.
Reflecting on Achievements and Future Directions
As we bring this seminar to a close, it is essential to reflect on the ambitious strategies we outlined at the beginning of this journey and the significant progress we’ve made in implementing them. Our initial framework was designed to address the multifaceted challenges of building performance optimization, encompassing passive solar design, natural ventilation, cooling strategies, water management, outdoor spaces, and daylighting. Out of these, nine strategies have been successfully explored and integrated into our high-rise design: building orientation, solar gain control, prioritization of shading, outdoor shading, microclimate generation, daylight optimization, glare control, operable windows, and strategic landscaping. Each of these elements was informed by rigorous environmental simulations, computational analyses, and a data-driven design approach.
The use of advanced tools such as Grasshopper and its ecosystem of plugins, including Ladybug, Honeybee, and Infrared, was instrumental in realizing these strategies. These tools enabled us to dissect complex environmental phenomena—from solar radiation and wind dynamics to daylight penetration and thermal comfort—and translate them into actionable design insights. For instance, the prioritization of shading through balconies and vegetation, combined with strategic landscaping, not only mitigated solar radiation but also fostered microclimate generation, reducing the urban heat island effect. Similarly, daylight optimization strategies, such as informed window placements and glare control mechanisms, balanced energy efficiency with occupant comfort, creating an adaptive and responsive design.

This iterative process of analysis and design refinement has equipped us with a robust framework to address Austin’s extended summer conditions and the harsh climatic realities of the site. By successfully implementing these strategies, we have demonstrated the power of computational tools in bridging the gap between abstract data and tangible design solutions. Each intervention, from operable windows to outdoor shading, has been carefully calibrated to respond to the site’s specific challenges, ensuring that the building not only performs efficiently but also integrates harmoniously into its environment.
However, this achievement is just the beginning. Several strategies, such as stack ventilation, high-efficiency HVAC systems, rainwater harvesting, and stormwater management, remain unexplored and represent critical areas for future research and development. These elements hold the potential to further elevate the building’s performance and sustainability, making it a benchmark for climate-responsive design in urban environments.
This seminar has been a testament to the synergy between technology, design, and academic inquiry. By leveraging cutting-edge tools and methodologies, we have not only addressed key environmental challenges but also laid a foundation for continuous improvement and innovation. The outcomes of this project stand as a reflection of the collective effort, dedication, and creativity of the team, providing a strong sense of closure and accomplishment while opening the door to future explorations.

