
Understanding the complexity of urban flooding
Across the globe, cities are facing the increasingly visible consequences of climate change, with floods and landslides ranking among the most destructive urban hazards. In Brazil, the city of Petrópolis offers a critical lens through which to study the layered vulnerabilities of urban settlements exposed to extreme rainfall, unstable topography, and unregulated growth.
Located in the mountainous region of Serra dos Órgãos and historically shaped by both natural beauty and economic pressures, Petrópolis has become tragically emblematic of the risks associated with climate-induced disasters. The catastrophic flooding and landslides of February 2022, which resulted in hundreds of casualties and widespread destruction, underscored the need for deeper territorial understanding, risk mapping, and international knowledge exchange.
The workshop analyze a real-case scenario to explore how multi-scalar mapping and comparative urban analysis can support climate adaptation efforts.
During the two days, we generate a diagnostic of flood vulnerability through the lens of spatial, climatic, infrastructural, and social data, prioritizing the construction of a critical, data-informed narrative that reveals the complex interplay of environmental risks and urban development in a highly sensitive territory.
For the analysis, we were divided in three groups, each focusing on one particular dimension of the issue, ranging from climate and hydrology to terrain and topography, built environment and infrastructure, and patterns of social vulnerability and governance. We focused on the analysis of topography and geomorphology by identifying different patterns that promote the flooding.
Moreover, a central component of the workshop involves identifying and analyzing “twin cities”: urban areas worldwide that share geographic, climatic, or infrastructural similarities with Petrópolis. These comparative case studies will serve as a foundation for assembling a catalogue of existing flood mitigation strategies, grounded in real-world precedents.
01/ Topographic Analysis for Flood Risk
Understanding the complexity of urban flooding requires a comprehensive analysis of the physical and environmental factors that shape and condition the territory. In this study, we conducted a spatial analysis of several key indicators to investigate the underlying causes of flooding in the municipality of Petrópolis, Brazil. The indicators analyzed include: topography, catchment areas, natural drainage networks, land use, soil type, and historical flooding zones. By interpreting these elements as an interconnected system, we were able to generate risk maps that spatially represent areas of vulnerability. These include a Flood Risk Map, based on the combination of hydrological and land-surface variables, and a Landslide Risk Map, which identifies areas with slopes exceeding 40%. The integration of both datasets results in a comprehensive Topography-Based Risk Map for the region.
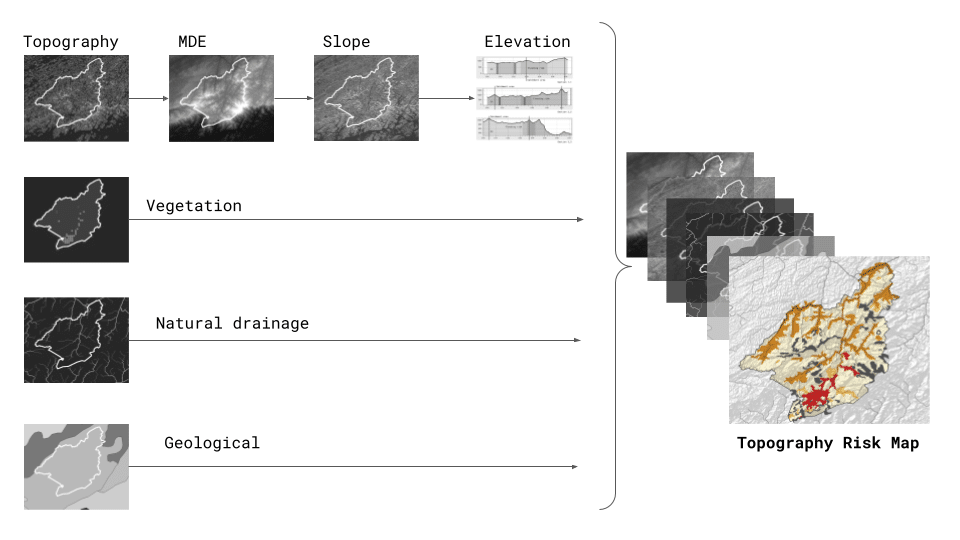
Methodological scheme
We took into consideration different factor that not only shape the city, but also condition it by making it more prone to flooding, soil erosion and landslides.
For recreate the topography we generate the Elevation Digital Model and from it, we extract the slopes and different sections, in order to have a better understanding about the topography role.
Furthermore, we add the vegetation layer to detect which areas are absorbing the most and identify absorption problems.
The Natural Drainage Network shows not only how the water flows, but also where are the places with high risk of flooding.
Finally, knowing the type of soil we can determinate the absorption capabilities and the erosion risk .
Topography
Topography plays a fundamental role in hydrological processes, particularly in the dynamics of surface runoff and water infiltration.
The analysis was conducted using Digital Elevation Models (DEMs) derived from satellite imagery, which allowed for the development of Slope and aspect models. These datasets enabled the identification of areas prone to water accumulation due to terrain depressions, and zones susceptible to rapid runoff and erosion.
Steep slopes facilitate faster runoff due to gravitational acceleration, significantly reducing water infiltration capacity. Conversely, flatter terrains promote water stagnation and, under certain soil conditions, increase infiltration.
The infiltration rate, therefore, is inversely proportional to slope steepness, as highlighted by Ray, S. K. (2024). Using this analysis, we were able to delineate potential flood zones and erosion-prone areas across the study region.
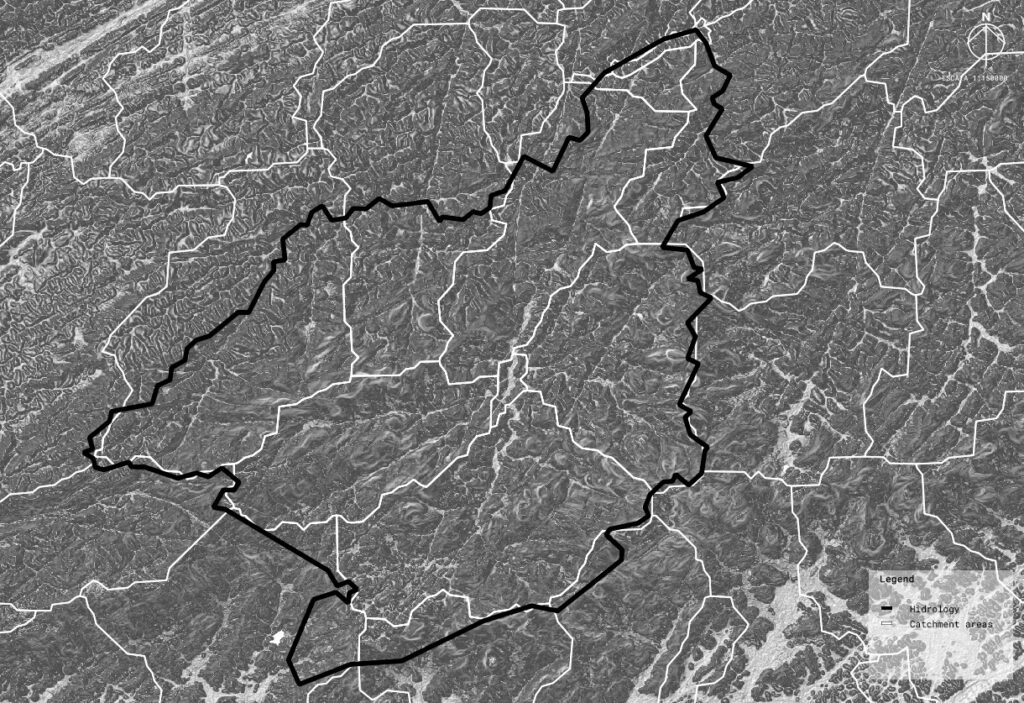
Catchment Areas
Catchment or drainage basins are defined by topographic boundaries—typically ridgelines—within which all precipitation converges to a single point, such as a stream or river outlet. By delineating these catchments and overlaying them with slope and elevation data, we were able to model water flow direction and accumulation zones. This analysis is critical for understanding hydrological behavior at the landscape scale and identifying areas where rainfall may concentrate, increasing the risk of localized flooding.
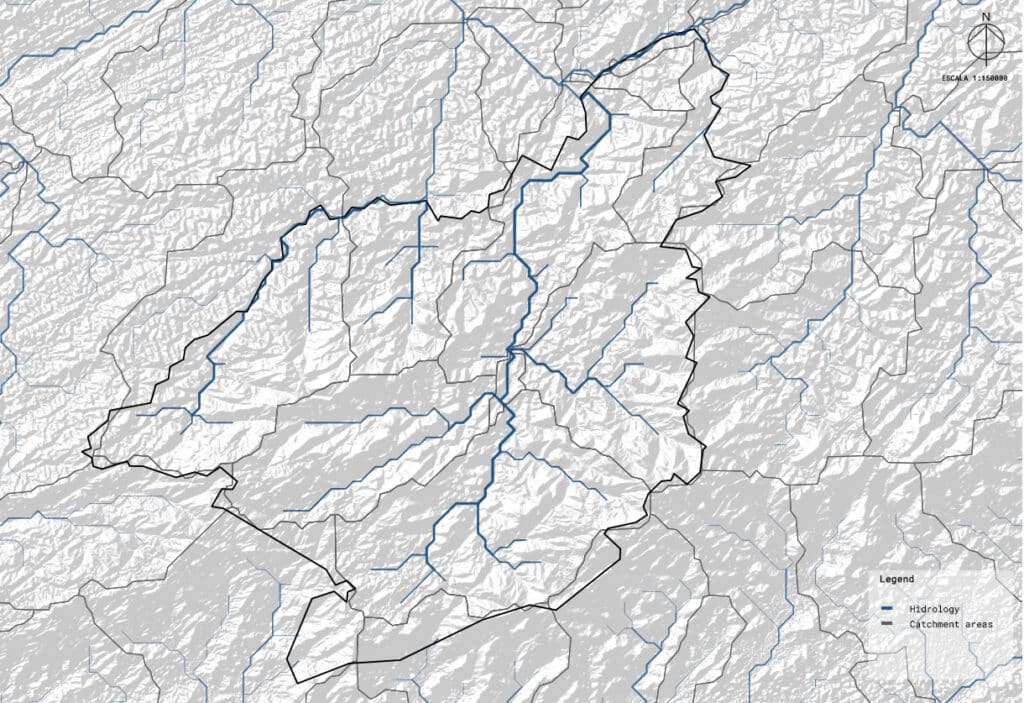
Natural Drainage Network
The identification of natural drainage pathways enabled the recognition of floodplains—areas along rivers and streams where water can expand during periods of high precipitation without posing significant risk to infrastructure or population. Mapping these dynamic flood zones is essential for urban planning and early warning system design.
Vegetation
Vegetation refers to the type, structure, and condition of plant life covering an area, ranging from dense, mature forests to regrowing secondary growth and cultivated agricultural lands. It includes the variety of plant species present (like trees, shrubs, grasses), their physical characteristics (such as canopy height or root depth), and their ecological functions (like water absorption or erosion control). Vegetation plays a key role in how the land interacts with rainfall, influencing infiltration, runoff, and the overall stability of the terrain.
Land Use and Land Cover
Land use patterns significantly influence surface hydrology, particularly regarding water absorption and surface sealing. Impervious surfaces such as buildings, roads, and other urban infrastructure reduce infiltration rates and increase runoff volumes. Areas with low-permeability land cover were incorporated into the risk model as aggravating factors for both flooding and landslides.
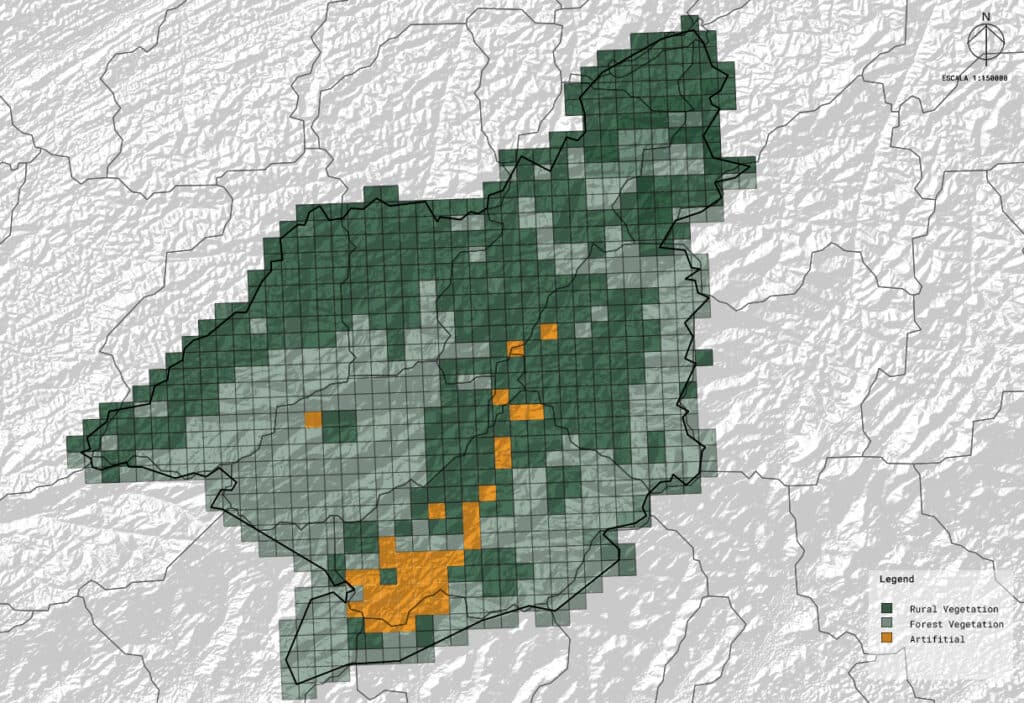
Influence of Land use in the Vegetation for Disasters
In the region of Petrópolis, two main types of vegetation cover can be identified: Floresta Ombrófila Densa Montana, and Vegetação Secundária e Atividades Agrárias.
The first occupies the majority of the municipal territory, including much of the urban area. This vegetation type is characterized as a dense, evergreen forest with a canopy height of up to 50 meters, and features a rich understory composed of ferns, arborescent trees, bromeliads, and palm species. When well-preserved, these forests can support high infiltration rates, exceeding 100 mm/hour, depending on soil conditions.
The second type of cover arises in areas that have experienced flooding—whether natural or anthropogenic—and are undergoing ecological succession. This vegetation is dominated by pioneer species that grow quickly and tolerate direct sunlight and nutrient-poor soils. As the vegetation regenerates, the soil gradually recovers porosity and root cover, contributing to reduced runoff, increased infiltration, and erosion prevention. In its intermediate stages, this type of vegetation can allow infiltration rates between 30 and 80 mm/hour, though in intensively cultivated and compacted agricultural zones, these rates can drop to as low as 5 to 20 mm/hour.
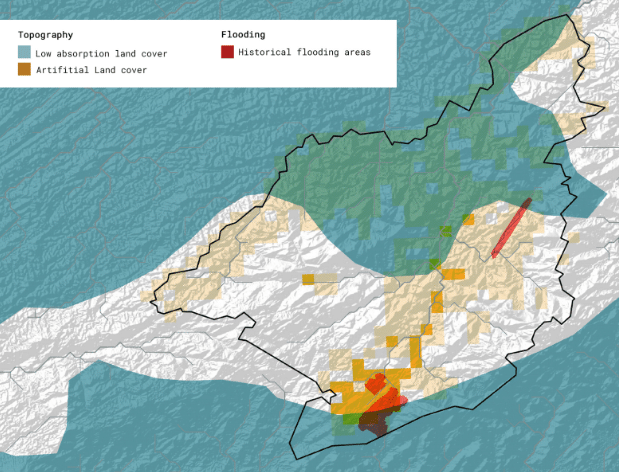
To analyze flood susceptibility, we overlaid the vegetation cover with historical flood events. Additionally, we included land use data, which revealed that areas affected by flooding were often classified as Artificial Areas or Mosaico de Ocupações em Área Florestal—a land use configuration where human settlements, agriculture, and infrastructure are interspersed within forested landscapes, forming a fragmented “mosaic.”
This spatial analysis demonstrates that in 2011, the Vegetação Secundária e Atividades Agrárias zone experienced reduced infiltration capacity due to human activity and soil degradation, combined with proximity to river systems—factors that contributed to a higher flood risk. Similarly, despite the high natural infiltration potential of the Floresta Ombrófila Densa Montana, the presence of impermeable surfaces in artificially urbanized zones compromised this capacity, explaining the occurrence of flooding events in 2022 and 2025.
Soil Type
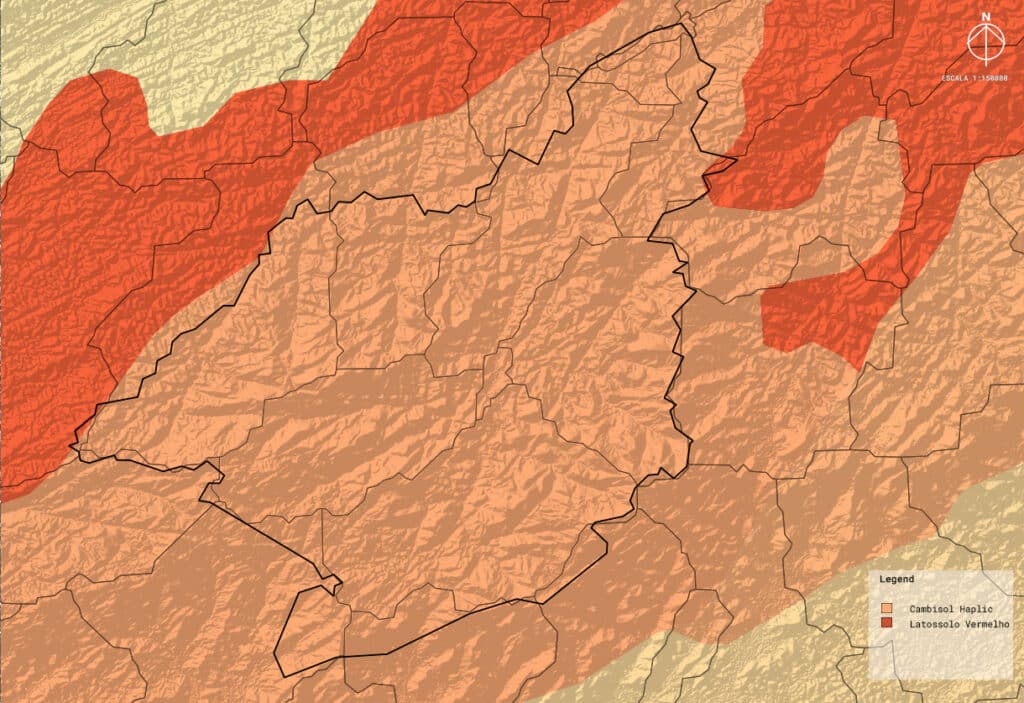
Soil characteristics are another fundamental component in determining flood and erosion risk. The predominant soil type in the Petrópolis district is Eutrophic Cambisol Haplic, characterized by shallow profiles and low natural fertility. These soils exhibit a high silt-to-clay ratio, contributing to low cohesion and poor structural integrity, making them particularly vulnerable to erosion on steep slopes.
Furthermore, this soil type demonstrates variable infiltration behavior: while dry soil may rapidly absorb water due to cracking and shrinkage, saturated soil exhibits expansion that significantly limits permeability. This duality results in delayed water infiltration during rainfall events, facilitating surface water accumulation—particularly when combined with steep terrain. These conditions create a critical interplay between topography and pedology that exacerbates flood and landslide risk.
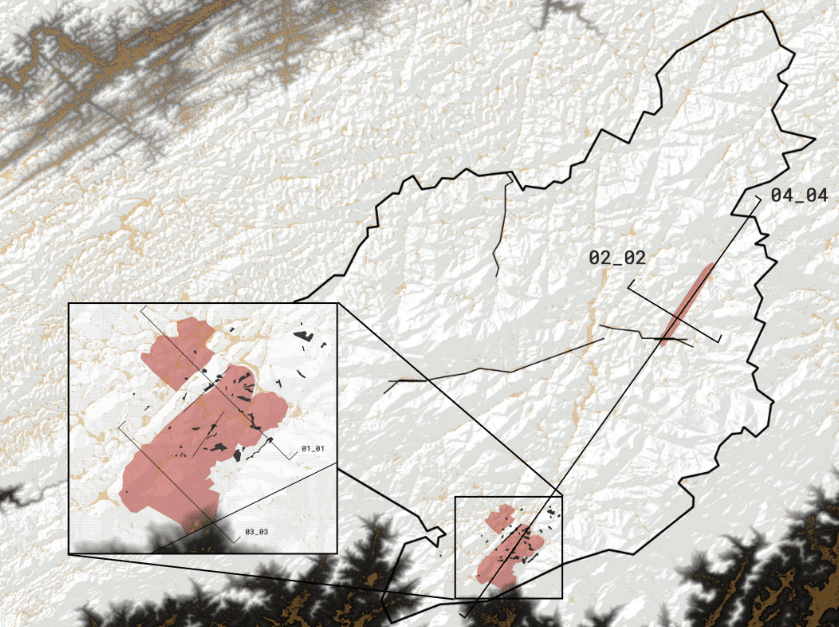
Reconstruction of Historical Flooded Areas
Due to the lack of official or systematized records of past flood-affected zones in Petrópolis, a reconstruction of historical flood-prone areas was carried out based on indirect data sources. Reports from major flooding events—specifically those that occurred in 2011 and 2022—were analyzed using media coverage, journalistic accounts, and technical articles.
Using spatial descriptions of affected neighborhoods, streets, and riverbanks, we georeferenced and digitized approximate polygons to represent the extents of flooding. This historical layer was further enhanced by incorporating flood alerts published on Google Maps in 2025, which, although more recent, reflect areas currently recognized as vulnerable by local communities and authorities.
This reconstruction allowed us to:
- Cross-validate the topographic and slope-based simulations with empirically observed flood locations.
- Refine the flood risk model by introducing real-world evidence not captured by physical variables alone.
- Highlight the spatial recurrence of flood events, emphasizing zones that require priority attention in risk mitigation and urban planning strategies.
While this method has inherent limitations due to the lack of precise cartographic data, it significantly enriches the analysis by grounding the model in lived experiences and historical patterns of vulnerability.
By integrating these factors through spatial analysis and GIS modeling, we have developed a composite risk map that reflects the dynamic interaction between geomorphology, hydrology, and land use. This map serves as a decision-making tool for municipal planning and risk mitigation strategies, providing a scientific basis for flood and landslide management in the Petrópolis region.
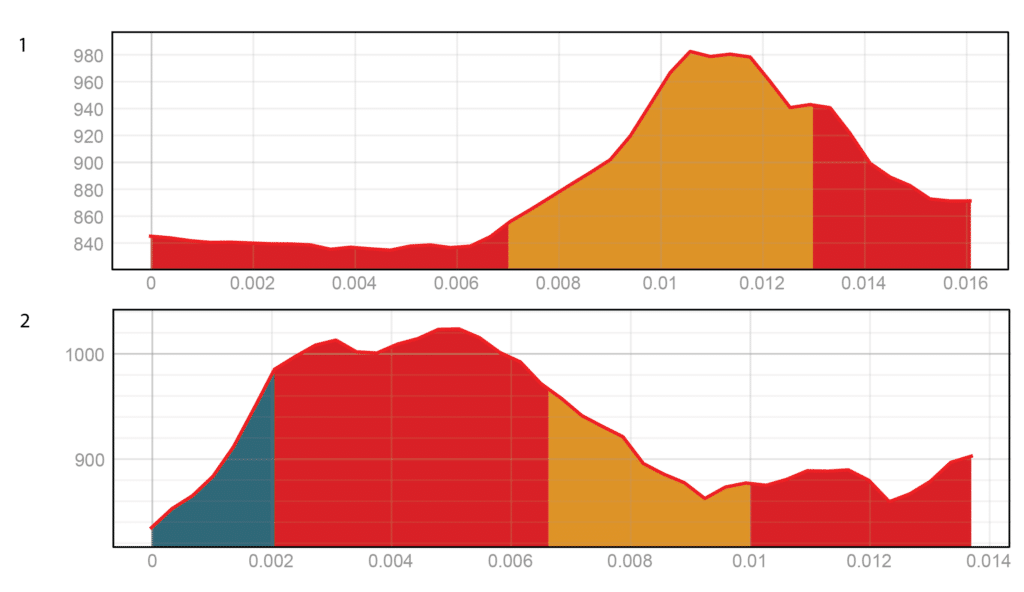
Elevation
To better understand how topography contributes to the rapid concentration and channeling of water during heavy rainfall events, thus intensifying the impact of flooding, longitudinal and cross sections were carried out in several key areas. These sections were applied over historically flooded areas, areas of soil erosion, and at the lowest topographic points of the relief, allowing a more accurate visualization of the local morphology and patterns of accumulation and runoff. This methodology facilitated a more detailed reading of water behavior as a function of relief, greatly enriching the spatial interpretation of risk.
Our analysis of the lowest points within the municipal limits revealed that many of these areas contain rivers, showcasing a tendency for flooding in these zones, though many of them had no documented artifical areas or built structures. This does not mean that these areas are uninhabited, however, and is an opportunity for further investigation with more detailed and updated datasets on landuse.
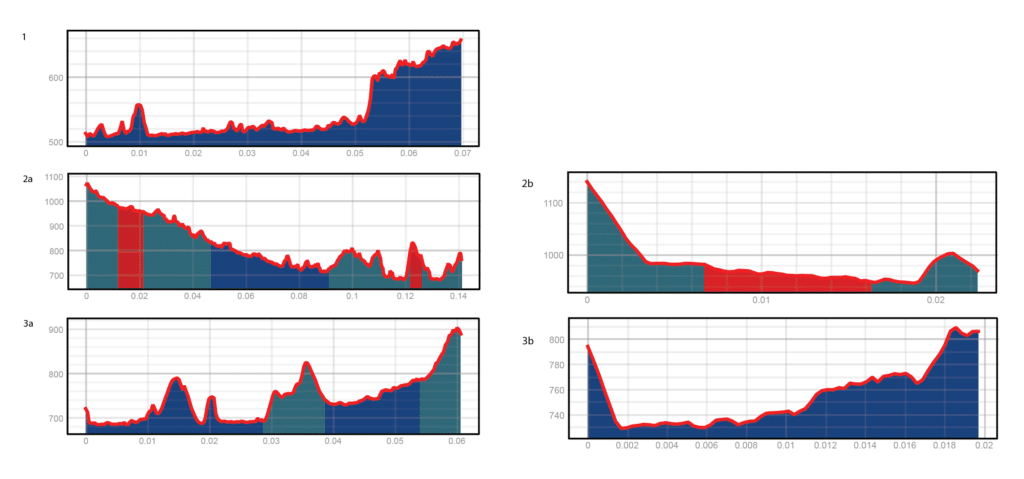
Studying historical occurrences of landslides demonstrated that areas of landslides often threaten (are uphill of and flow into) urban areas and artificial areas, where there is higher likelihood of human presence and fewer drainage paths. Many of these mass movements occur in zones with little vegetation, suggesting an opportunity for greening to mitigate risk.
Conclusion
The topographic analysis carried out in Petrópolis, Brazil, provided a deeper understanding of the complex interaction between physical and environmental factors that influence the occurrence of floods and landslides in the region. Using spatial analysis tools and Digital Elevation Models (DEMs), areas with high susceptibility to water accumulation and accelerated surface runoff—primarily driven by terrain slope—were identified.
The results show that topography, especially the presence of steep slopes and natural depressions, plays a direct role in the area’s hydrological dynamics. When these features are combined with poorly cohesive soils, such as the dominant Haplic Cambisols, and intensive urban development and degraded vegetation cover, the vulnerability to hydrological hazards increases significantly.
In addition, the different longitudinal and cross-sectional profiles contributed to a better understanding of the topography identifying water flow and water concentration patterns.
The delineation of catchment areas and identification of the natural drainage network made it possible to model runoff paths and accumulation zones, enhancing the predictive capacity of the study in the face of extreme rainfall events. In addition, the historical reconstruction of flood-prone areas—based on indirect sources such as media reports and recent public alerts—provided valuable empirical validation that helped adjust and strengthen the model built from physical variables alone.
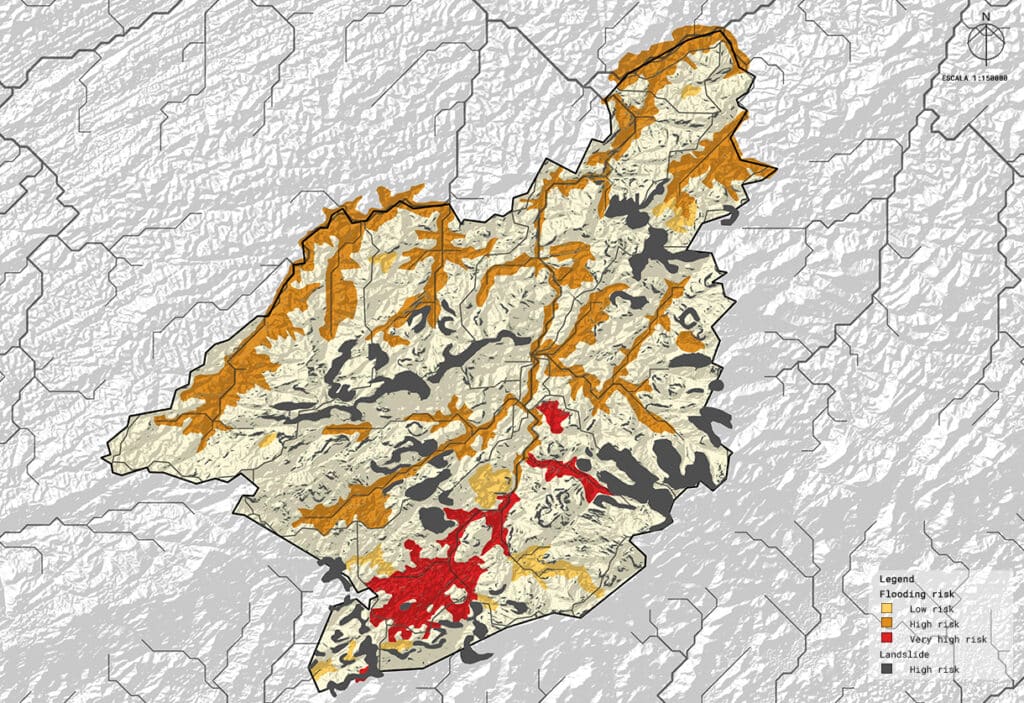
The overlay and integration of all analyzed layers—slope, elevation, land use, soil type, vegetation, drainage networks, catchments, and historical flood data—resulted in the creation of two key risk maps:
- A Flood Risk Map, highlighting areas with high runoff accumulation, low infiltration soils, and impervious land cover.
- A Landslide and Erosion Risk Map, identifying regions with slopes exceeding 40%, unstable soils, and limited vegetation cover.
Both maps were integrated into a Composite Topography-Based Risk Map, offering a precise spatial representation of the most vulnerable areas in the territory. This tool not only allows for the prioritization of critical zones for preventive action but also serves as a fundamental instrument for urban planning, emergency management, and the development of climate resilience policies.
02/ Case studies
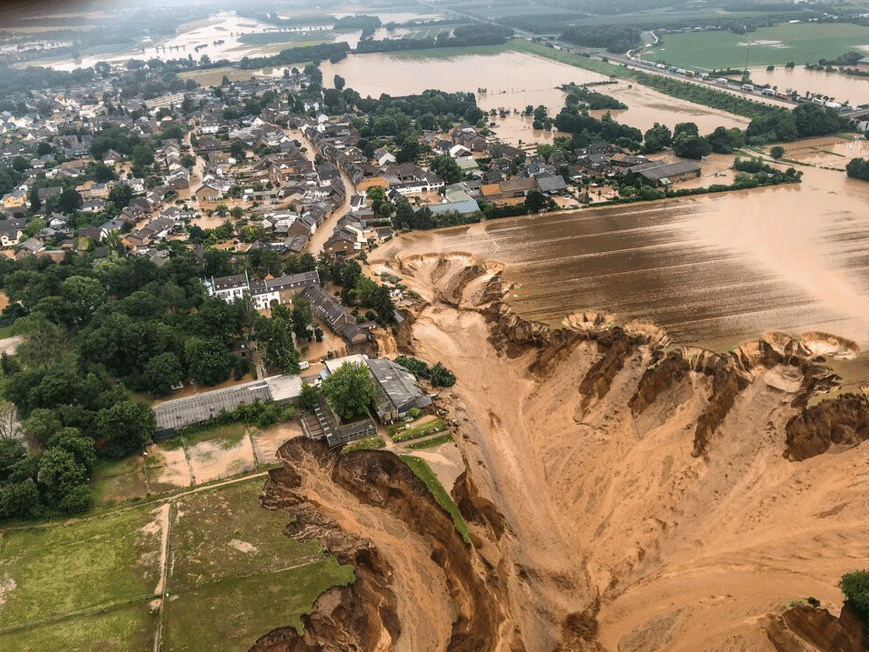
02.1/ Erfdstadt, Germany (2021)
The catastrophic flooding that faced western Germany in July 2021 resulted in severe destruction across multiple regions, with Erftstadt being one of the most severely impacted localities. This event not only exposed vulnerabilities in Germany’s flood management systems but also prompted a significant reassessment of urban planning approaches and disaster preparedness strategies.
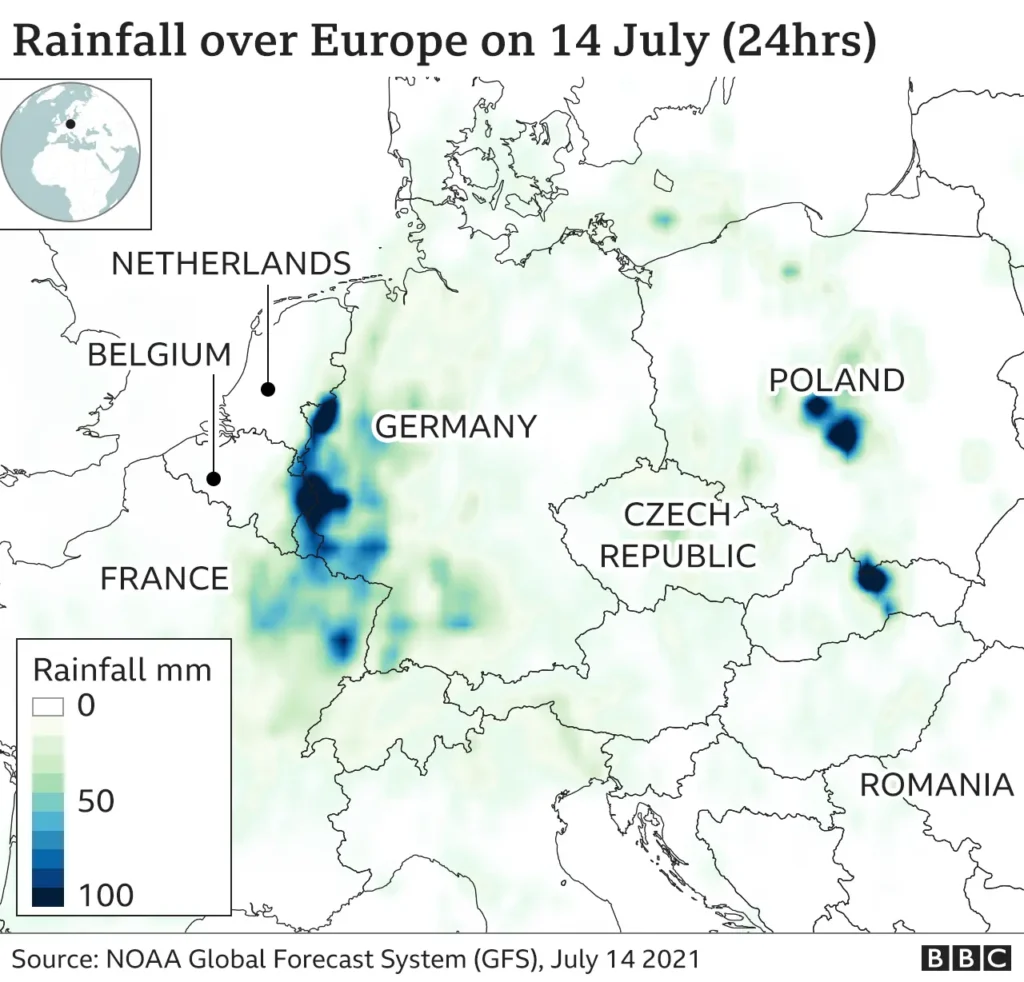
In mid-July 2021, western Germany experienced unprecedented heavy precipitation over a 2-day period, with rainfall exceeding 150 mm across a large area that encompassed western Germany and adjacent regions in the Netherlands, Belgium, Luxembourg, and France
- The Extreme rainfall triggered widespread flooding, with the river catchments of the Ahr and Erftbeing particularly devastated
- The low mountain ranges of the Eifel and the Ardennes, which characterize the region’s topography, contributed to the rapid concentration and channeling of flood waters, intensifying the disaster’s impact.
- Furthermore, the open-cast gravel mine north of Erftstadt caused, among other things, severe soil erosion between the mine, the district and the river Erft.
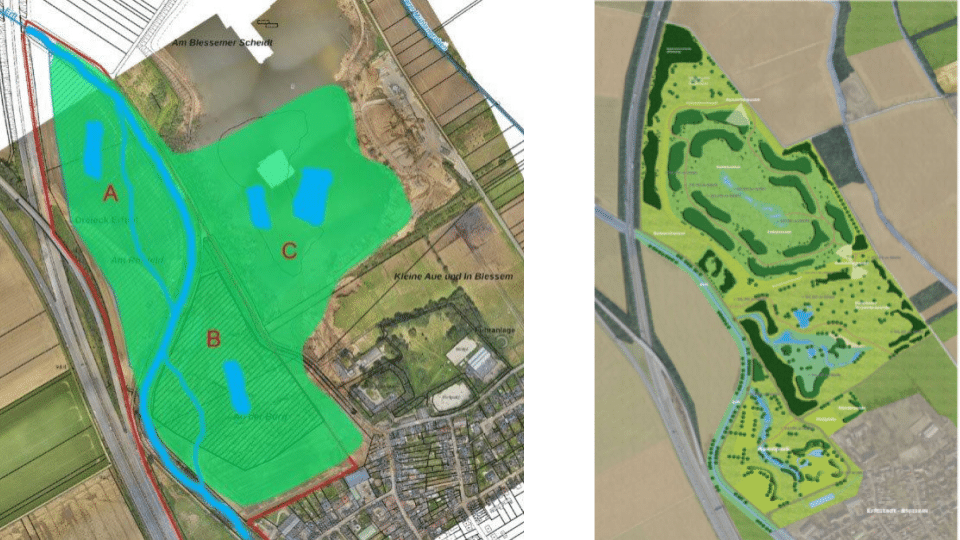
Immediately after the flooding, initial safety measures were taken to immediately prevent further danger. The town of Erftstadt secured the embankments outside Blessem. To prevent further water from entering the erosion zone and the open-cast mine, the Erft Association restored the current course of the river Erft.
Two month after the event, the Ministry of Economics and the Environmental Department of North Rhine-Westphalia, together commissioned the District Government of Arnsberg to take over the coordination of a project to plan and implement appropriate measures for the ‘prevention of risks in the erosion zone between the Blessem open-cast mine, the village of Blessem and the river Erft’.
The objective of the project is the short and medium term rehabilitation and long term protection of the flood affected areas between the Blessem open cast mine, the village of Blessem and the river Erft.
The strategic measures of the plan can be categorised into Structural Measures, which involve changes in urban planning with a high budget, and Non-Structural Measures aimed at both awareness-raising and support for victims, and the promotion of citizen participation in the definition of the plan.
Structural Measures
Plan development: The project ‘Risk prevention in the erosion zone between the Blessem open-cast mine, the village of Blessem and the river Erft’ is managed and coordinated by a working group specially set up by the District Government of Arnsberg in its function as technically responsible mining authority in North Rhine-Westphalia.
The members of this working group consist of technicians and professionals from the district of Cologne, the geological service, the Erft Association, and RWE Power AG.
Flood Relief Infrastructure: Fill in erosion areas by creating a ‘secondary flood plain’. Secure the open-cast mine against future flooding to prevent erosion events. Reconstruction of the southern wall of the open-cast gravel mine, including the implementation of erosion control measures.
Improved Drainage Systems: Restore the urban drainage system
Beyond physical infrastructure, authorities implemented several non-structural measures:
Community Participation: The districts and the Erft Association (EV) initiated an inter-municipal cooperation on flood protection. The project aims to integrate local actors and their experiences from past floods, and to coordinate with the respective municipalities and EV on the necessity and effectiveness of protection measures. The development of the municipal flood protection concept started in July 2023 and is planned to be developed over the next three years with public participation.
Development of information material: development of audio-visual material, protocols and flood protection guidelines. Property protection and structural precautions.
Flood risk maps and regulatory flood zones.
Legal changes: modifications to the urban code regarding land use in critical locations.
Psychological support: Creation of the Flood Relief Department. Provides psychosocial and financial counselling to cope with the consequences of the floods.
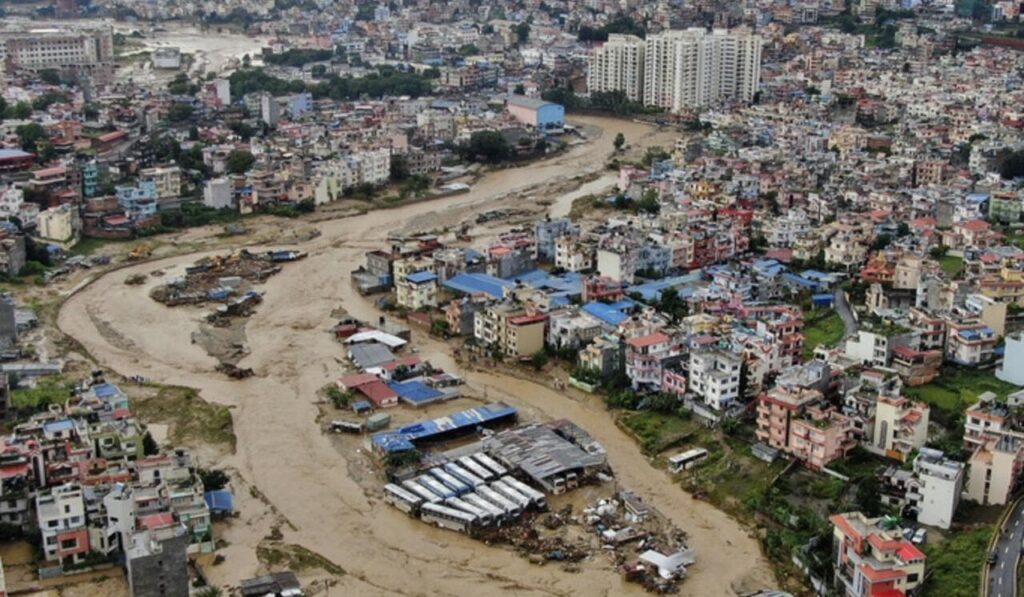
02.2/ Kathmandu, Nepal
The Metropolitan area of Kathmandu is highly exposed to flooding due to its geographic location along a valley with few natural drainage points. Rapid urbanisation (386% increase in built up areas between 1990-2020) and deforestation (28% reduction in forest cover from 1989-2019) in the Kathmandu Valley has disrupted natural water processes, increasing surface runoff and overwhelming drainage systems, while building on flood plains and near rivers has increased the exposure of people and assets to floods.
The Kathmandu Valley is shaped like a basin, with a bowl-like structure that has limited outflow points, making natural drainage difficult, especially during heavy rainfall.
The valley has a dense network of rivers and streams that all eventually flow into the Bagmati system. During periods of heavy rainfall, this system can become easily overwhelmed, causing severe flooding.
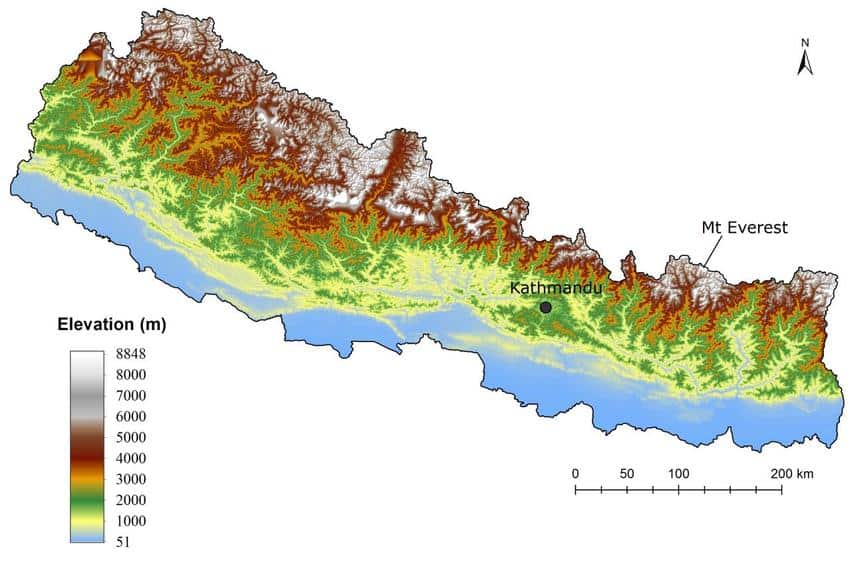
Surrounding the valley are mountain ranges such as Shivapuri, Phulchowki, Nagarjun, and Chandragiri.
These hills act as watersheds, collecting and channelling rainfall into the valley’s rivers.
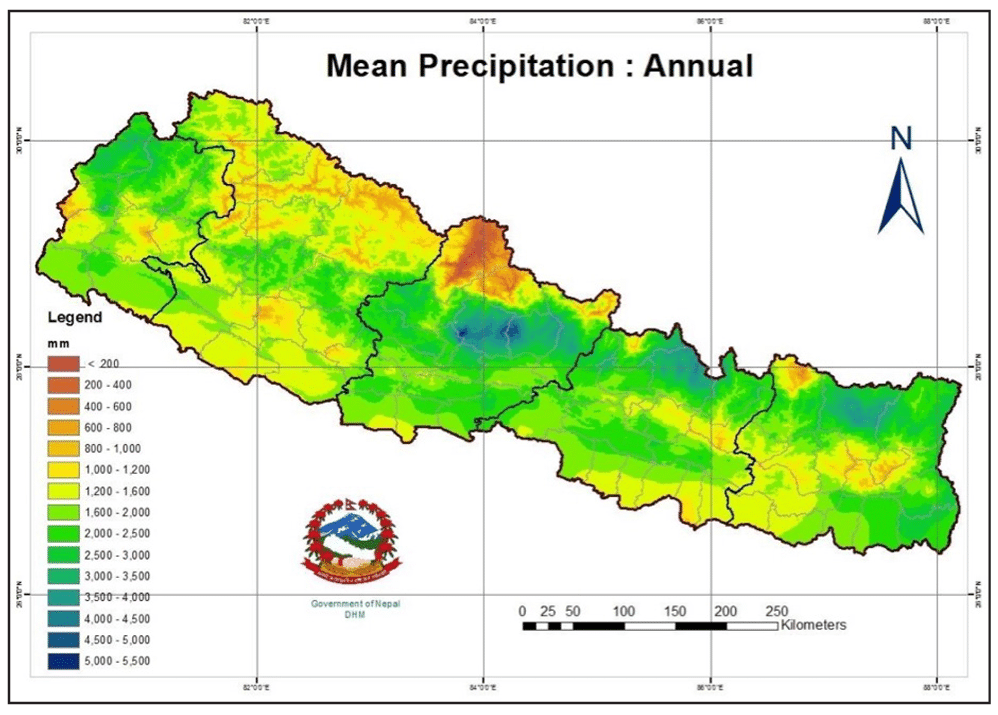
During the monsoon season, water flows rapidly down these hills, further increasing the volume in the valley’s rivers.
The steep slopes of these hills exacerbate the runoff, putting even more stress on the valley’s already limited drainage capacity.
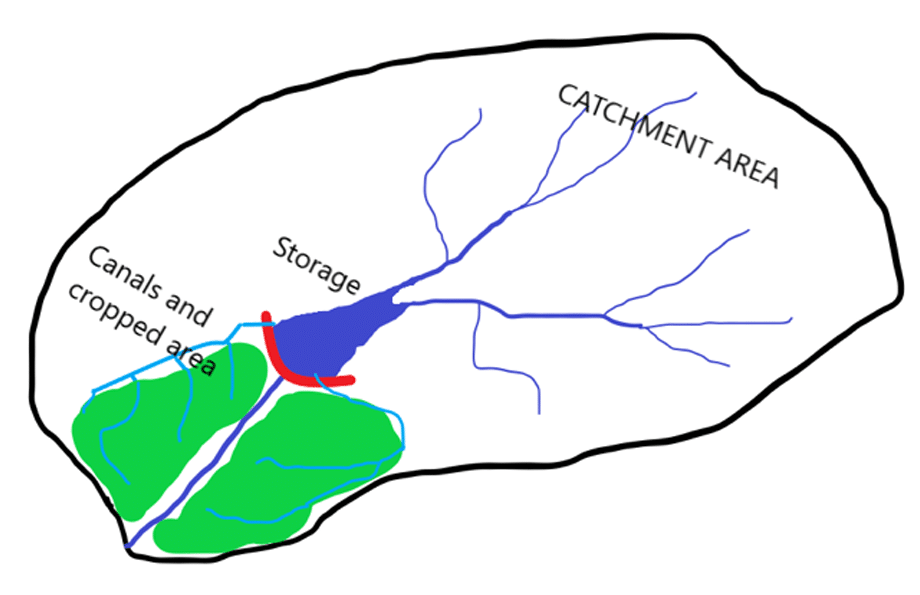
To address the flooding issue in Nepal by utilizing the natural topography, a water harvesting system can be implemented to collect rainwater, storage and direct it into canals and agricultural lands for irrigation or absorption. Runoff farming channels water from upland catchments to lower-level agricultural areas, thus concentrating rainfall collected to a smaller area. It would be important that the topography and geological analyses yield suitable locations for storage. These include river valleys, pans, existing lakes and reservoirs, etc., which are available in Nepal. Smaller scale pans and ponds can also be constructed to utilize the local topography to aid in local water supply, irrigation and livestock use.
This approach allows the water to be guided along the natural slope of the land to areas where it can be more effectively absorbed and put to better use.
02.3/ Santiago, Chile
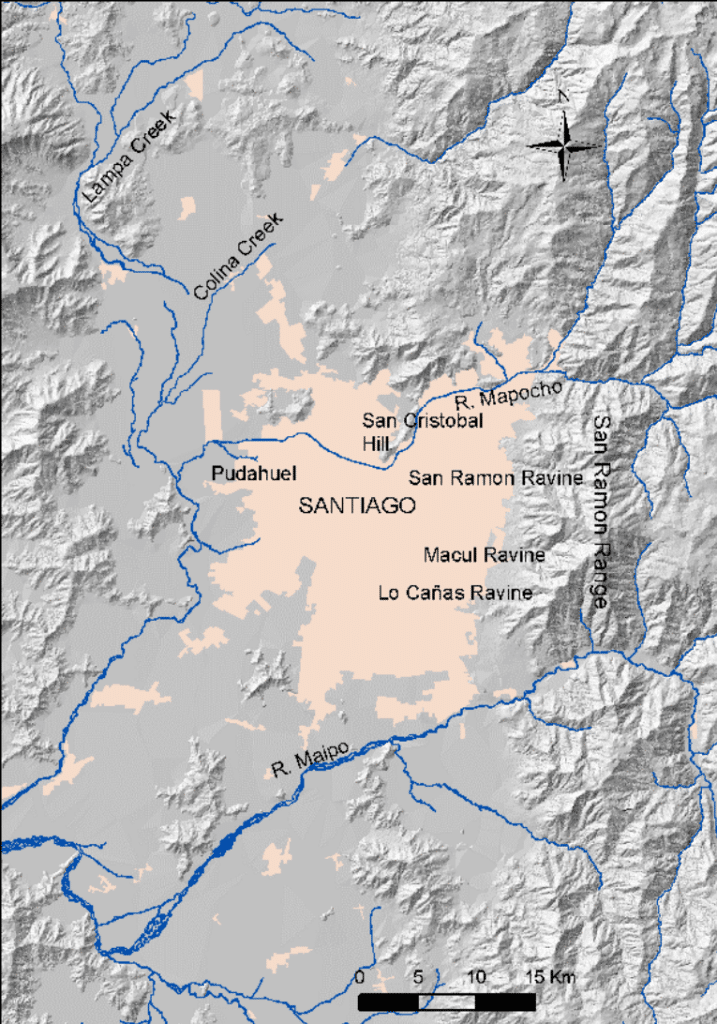
Santiago, Chile, with its 7 million residents, is located in the valley between the Coastal Range and the Andes Range and varies in altitude between 500-1000 m above sea level. Sitting on fluvial and alluvial sediments and given the steep slopes of the mountain, Santiago commonly experiences landslides during heavy rainfall. The debris and mudflows of these pose a serious risk to the city outskirts, which are increasingly occupied by new housing, as do rock falls and rock slides. The severity and probability of landslides are increased by frequent seismic activity in the region. Santiago’s most common debris flow and landslide trigger is heavy rainfall, which are more common during El Niño and can last a few days to a week.
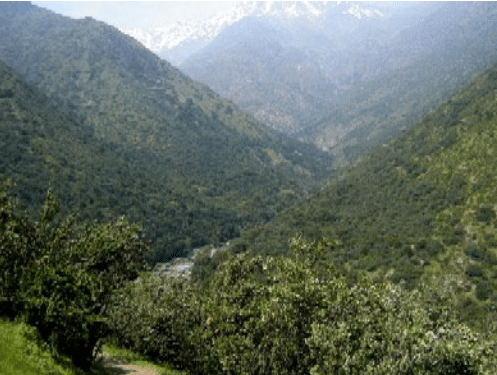
On its eastern side, the city is adjacent to a steep, rocky mountain that reaches an elevation of 3250m. Several ravines on this mountain drain towards the city, with average gradients exceeding 15º and tributary gullies exceeding 30º. The main ravines of this system are San Ramón and Macul, with drainage basins of 38 and 23 km, respectively. Fortunately, the soil in this region comes from historical volcanic activity and is a good foundation soil that may sustain nearly vertical cuts, but does not perform well during earthquakes.
Historical case: May 3, 1993
May 3, 1993 marked one of the deadliest landslides of the last century with one of the largest flow volumes. Although the total rainfall in Santiago reached around 30mm, the rainfall intensity reached 12 mm/hr, 25-year storm value. Increase in temperature also increased the size of the catchment area territory. This increased runoff, heavy rain, and the loose, partially saturated soil deposits in the ravines and slopes produced mudflows, river overflows and flooding in the mountain range east of Santiago. The flows mobilized over 2M square meters of material at speeds over 30km/hr, reaching the city in a few minutes. According to government accounts, 26 people died, 8 were reported missing, over 5,000 houses were damaged, and 307 were destroyed. Over 28,000 people were affected by the event.
To address the flooding and landslides risks, district governments have implemented multiple infrastructure, governance, and information campaign interventions over the past decades.
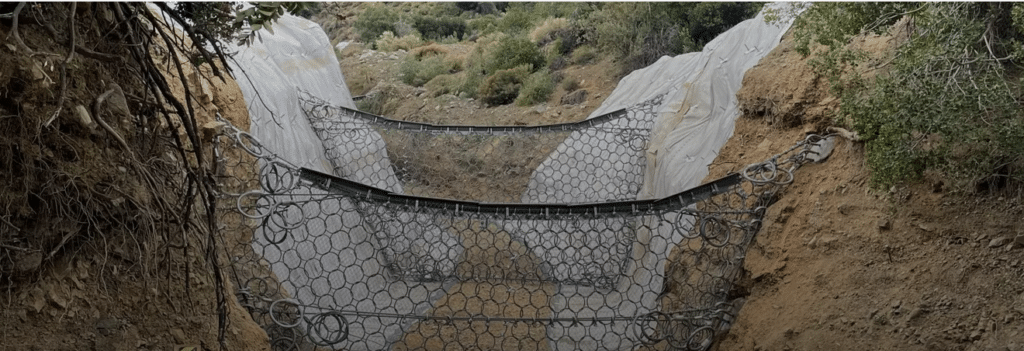
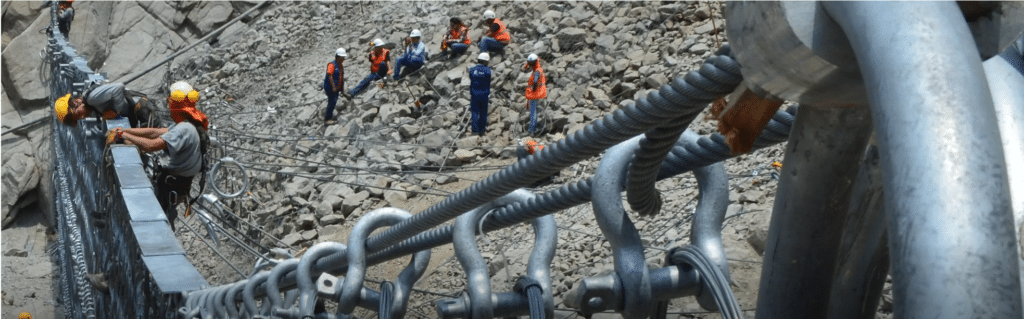
To prevent landslides, the city has installed and upgraded various barriers within gullies and ravines that flow into urban areas, sometimes installing one or two in a gulley for further protection. They have also dismantled, cleaned, and reinstalled erosion control systems to improve the capacity of barriers. These serve to block major mass movements and lower the slope of the ravine, preventing flows from gaining too much speed. On average, the barriers are 15m wide, 4m tall, and can hold 1000 square meters of earth.
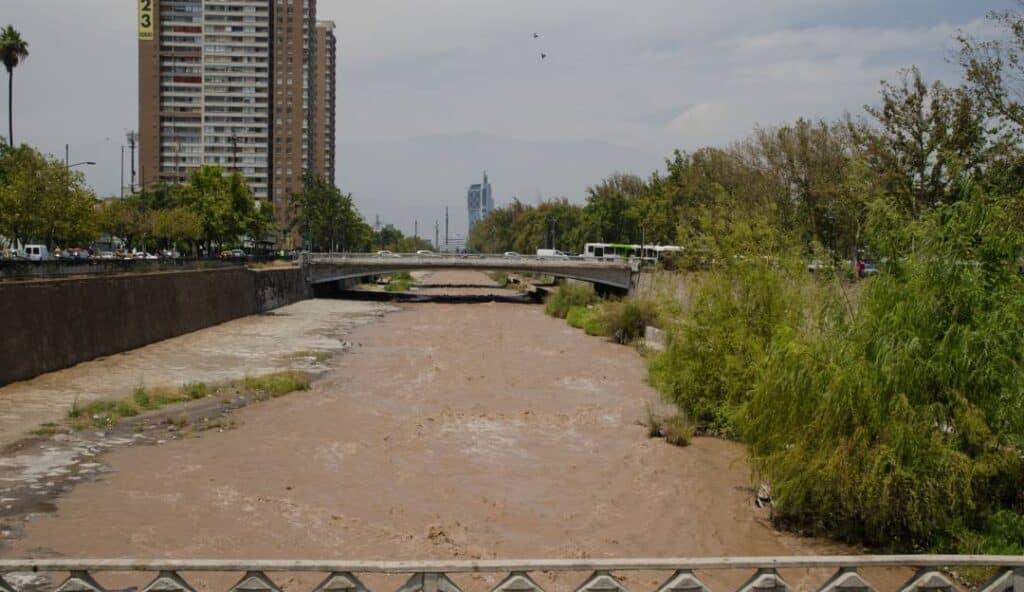
The city has also been rehabilitating blue and green zones that can serve as water retention and drainage points throughout. Blue infrastructure are systems related to water management, like rivers and wetlands. According to Carolina Rojas, researcher at the Center for Sustainable Urban Development (UdeC), the Mapocho River is a prime example of a blue infrastructure in Santiago, particularly in areas where it is not channeled. Green infrastructure comprises natural and semi-natural spaces that provide ecological, social and economic benefits, such as parks, gardens, green roofs and biological corridors. In Santiago, these include the Parque Metropolitano, the Cerro Calán, el Parque de La Familia y el Parque Bicentenario, but the city struggles to distribute these spaces equitably throughout its districts.
In addition to infrastructural interventions, Santiago (and Chile as a whole) has leveraged communication tools to keep residents alerted and informed.
Chile’s Emergency Alert System (SAE) sends a message with emergency or evacuation information in case of tsunami, volcanic eruption, landslides or forest fires. This massive alert is automatically dispatched from the National Disaster Prevention and Response Service (SENAPRED) to a georeferenced zone. However, the SAE has faced criticism for instances of erroneous messages. In 2021, after sending a false alarm about a nonexistent tsunami warning, the SAE faced calls for stronger oversight and a more rigorous checks system from relevant monitoring agencies. Since then, the system has been updated.
