
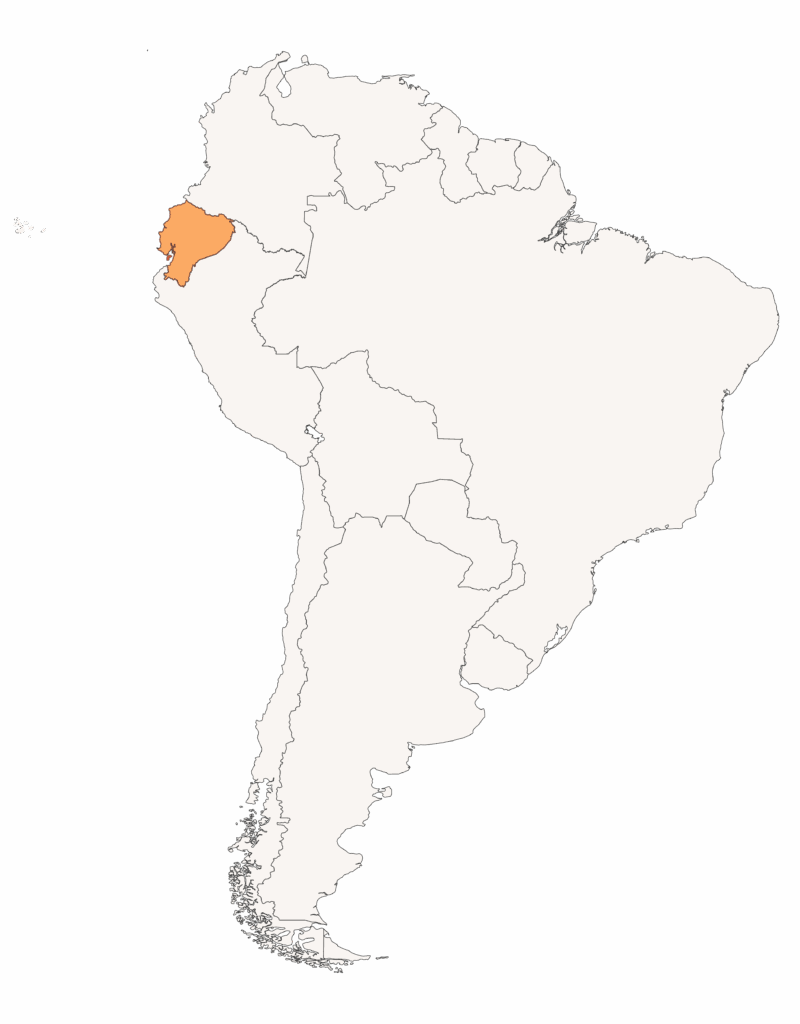

Quito is located in the north-central part of the Andean region of Ecuador, in south america. Given its high elevation, it is one of the highest capitals in the world. With a population of 1.9M people, it is the second-largest city of Ecuador. It is located in the province of Pichincha in the canton of the Metropolitan District of Quito (DMQ), which is an Autonomous Decentralized Government.
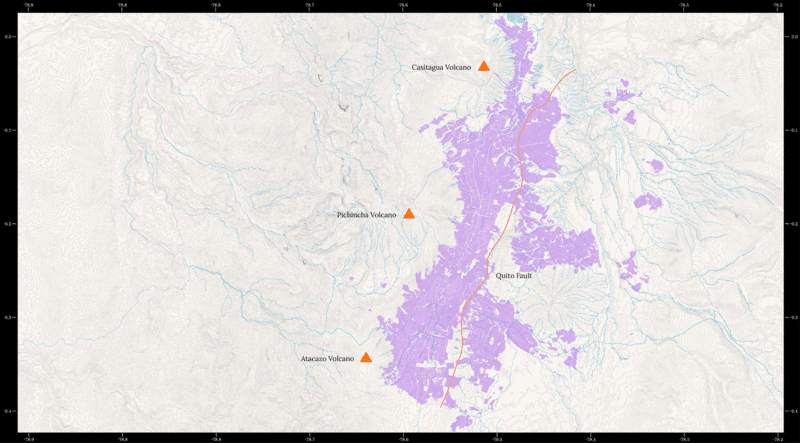
Because of its topography, mainly high slopes to the west (volcanos) and river gorges and a geological fault to the east, the city has grown from the center to the north and south, leaving the outskirts disconnected.
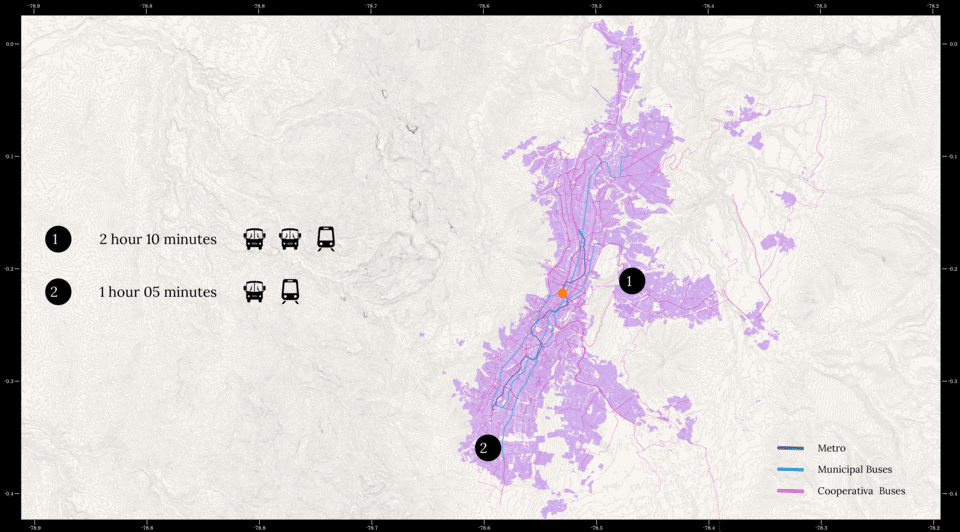
Based on the statistics we gathered, most Quiteños rely on public transport to move around the city. Fares are affordable, ranging between 0.30 – 0.45 USD, which is Ecuador’s currency, but can add up quickly depending on number of trips and modes of transport taken. Our data, spatial mapping, and our interviewees agree that the system is highly fragmented.
This lack of integration is not only physical, with poorly facilitated and long transfers, but also institutional, as each transfer requires a separate fare and the various modes of transport are managed by different, uncoordinated stakeholders.
Quito has a fragmented public transport system.
The public transport is unsafe, particularly for women.
Quito has plans for an efficient, safe transport network, but…
RESEARCH QUESTION
How can we temporally and spatially bridge the gap between current mobility realities and decentralized transit plans through upgrading the bus stop network according to Quiteñas’ sense of agency in these spaces? Temporally, meaning between today and 2042, when the municipality plans to realize its vision of its transit network. Spatially, meaning moments of literal transition between modes of transportation. Our research has shown that bus stops are places of places of enhanced vulnerability for women.
Women are negatively impacted and their access to opportunities are limited by gender-blind and unsafe urban planning and transport services. Our OBJECTIVE is to boost the agency of women commuters on their journeys.
HOW?
Producing a collaborative interactive web map of bus stop typologies and surroundings and an open catalogue of relevant feminist interventions which will help planners and citizens to crowdsource experiential data on existing conditions and transition to the integrated plan.
METHODOLOGY
We do this through a series of four methodological steps:
- First, we conduct a feminist framing exercise to better understand commutes at the ground level.
- Next, we compare commissioned and official transit plans to understand how Quito intends to upgrade its network in the coming years.
- We conduct a bus stop analysis to understand the spatial characteristics of bus stops that might have an impact on perceptions of safety,
- And we conclude, with a feminist designing plan to illustrate how this research could be leveraged to empower women commuters.
- Feminist Framing
Carmen
We present Carmen, a statistical persona developed using data from two key sources: Quito Cómo Vamos, a city-wide survey that introduces data through statistical personas, and the study Género y Transporte: La movilidad de las mujeres en las zonas noroccidentales, conducted by the Transport Gender Lab, which applies a gender-sensitive and intersectional approach to data collection. It is important to note that we did not have access to direct, representative first-person experience. Therefore, we relied on these two documents to build a more comprehensive and data-driven profile. We then created a fictional journey for Carmen and used Google Street View to visualize her path.
Carmen is a 40 year old women and single mother to a 10yr old daughter and teenage son. Like 9% of women in Quito, Carmen is a paid domestic worker. Like 71.8% of students, her daughter attends a public school. On the other hand, her son, like 8.43% of her San Juan neighborhood, dropped out.
She moves to work and for her personal care responsibilities walking, using public transport, and sometimes taking a taxi. 96% of her salary goes to covering the basic basket, which includes transport as well.
We diagrammed Carmen’s journey over the course of one day. As a professional caretaker and homemaker, much of her movement is composed of trip-chaining, increasing the cost of her travel and the time it takes for her to finish her errands.
Through our interviews and the mobility reports, we learned Quito shuts down in the evenings, and it is not safe for Carmen to travel. As a consequence, she has to get all this done and be home by 7pm. She decides to take a taxi for this, which costs more than the buses shw would take if she had the option. Additionally she would be carrying groceries so walking on Quito’s steep topography would be hard for her.
As a Quiteña, Carmen has some options when it comes to public transportation. First are the cooperativa buses, which have the highest level of coverage throughout the city and are the most widely used. Although fares vary depending on the cooperative, this mode remains the most affordable.These are operated by private companies who compete with other operators for customers, leading to unsafe conditions (speeding, rolling stops, packed interiors). Unfortunately, these buses are not equipped to accommodate elderly or disabled passengers, and users face a higher risk of robbery or sexual harassment on these lines.
The municipal buses are slightly newer: Trolebús was inaugurated in 1995 as the first Bus Rapid Transit of the city, the Ecovía was opened in 2001, and the Metrobús-Q in 2005. These buses are a low-cost transport option ($0.35), consisting of three main lines running primarily along a north-south axis, with limited east-west connectivity. These lines are in high demand, especially during peak commuting hours. The system does not support fare transfers yet, but will soon enable card payment mechanisms.
Opened in December 2023, the Quito Metro was mostly funded with loans from the World Bank. While it is the most expensive mode of transport in the city, the fare remains affordable at 0.45 USD and is paid via a reloadable card. According to our interviews, the system offers a heightened sense of safety. It is supported by a dedicated officers, is equipped with security cameras, emergency phones, and panic buttons throughout the network. Quito has secured funding for 5 additional stops that have not yet been determined.
Now, we will take you through Carmen’s journey.
Carmen starts her day by accompanying her daughter to school. She has a few options on how to get there and though it would take 7 minutes to arrive by taxi, Carmen and her daughter take the 39 minutes bus, since the 37 minutes walk is too tiring.
1. Similar to 70% of women, Carmen travels for care work. Carmen and her daughter walk 3 minutes to the bus stop, leaving around 7am, like 52% of women in Quito do.
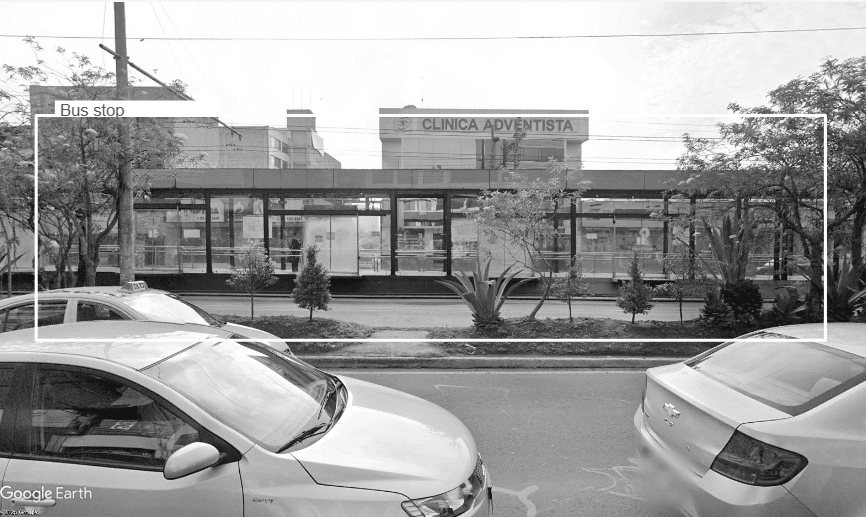
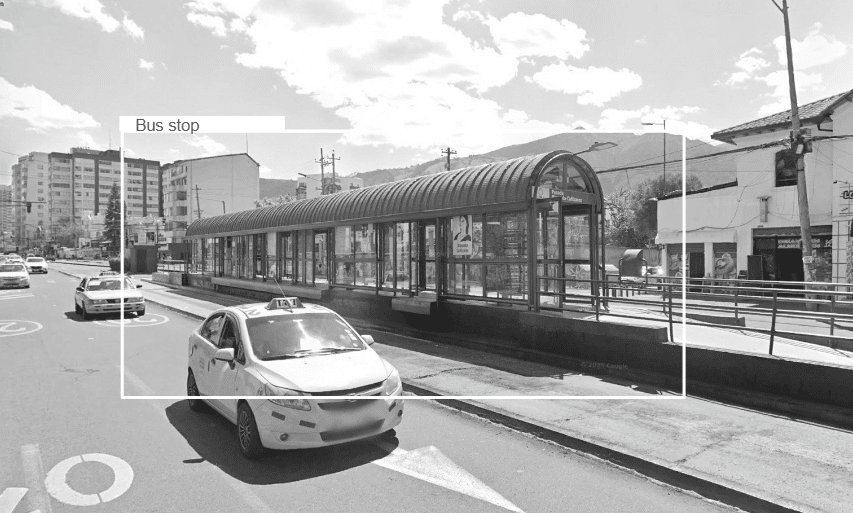
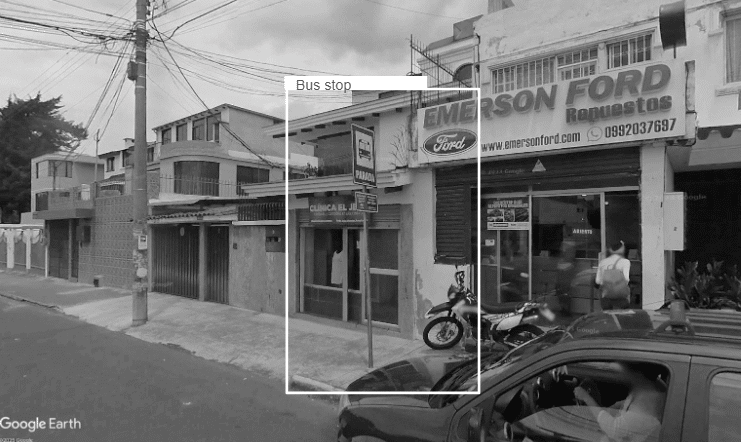
2. This is the bus stop where they wait for their bus.
3. This are the surrounding where Carmen and her daughter wait for what is supposed to be 7 minutes. But since the cooperativa buses are irregular its hard to know with certainty.
4. Carmen boards the bus, paying 0.35 USD each. They take the bus at around 7am as 52% of women, and it is the exact same time in which a high amount of sexual violence is experienced, since it is also the time when the bus is the most full.
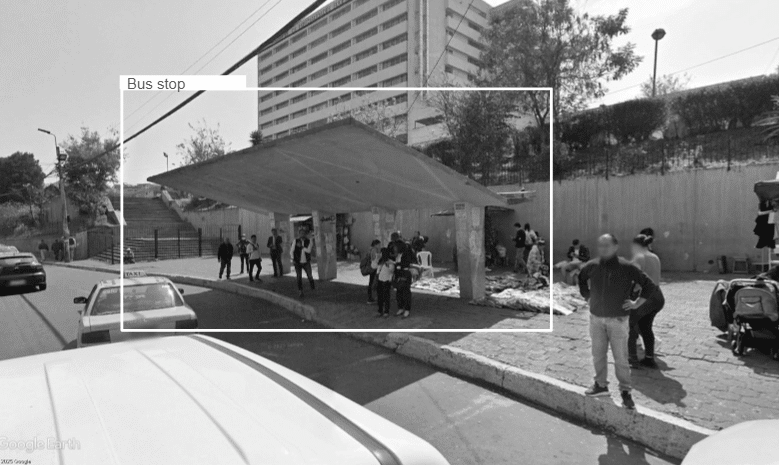
5. Then they have to take another cooperativa bus and it takes them 10 minutes walking to get to the next bus stop. Even though most of the sexual violence happen in transport 95.4% of women don’t feel their local public spaces are safe – so transfers are an important role on safety in everyday mobility in quito
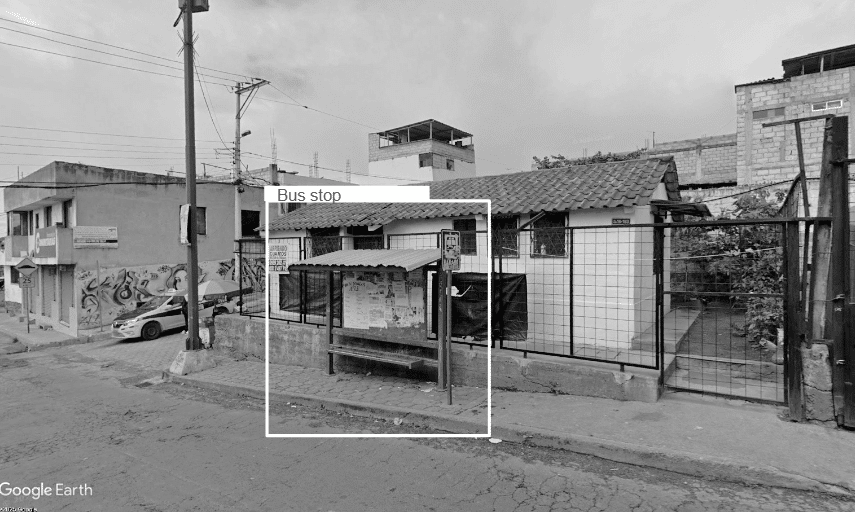
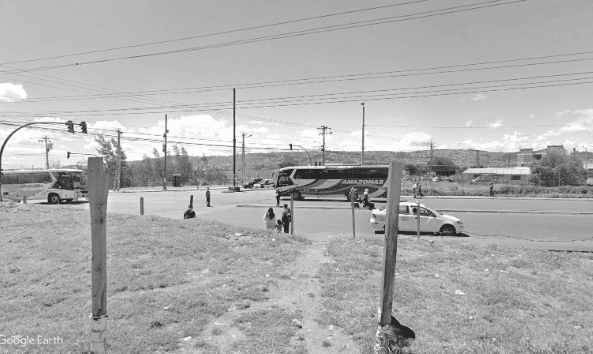
6. I this next bus stop there is no sign to indicate bus stop, and no place to wait at all.
7. Carmen and her daughter should only have a 6min wait, but the bus is often too full for her to board, and she has to wait for the next one. 76.2% of sexual violence on public transport happens on the cooperativa buses and 84.5% of women who experienced sexual harassment or assault experienced it alone. That’s part of the reason why her daughter wont go alone.
- BUS STOP PRIORITIZATION
It’s clear that Quito needs an integrated transit system, and the city is working towards that. Along with the metro extension, the city has commissioned and developed a transit network plan, which we critically analyze in this next step.
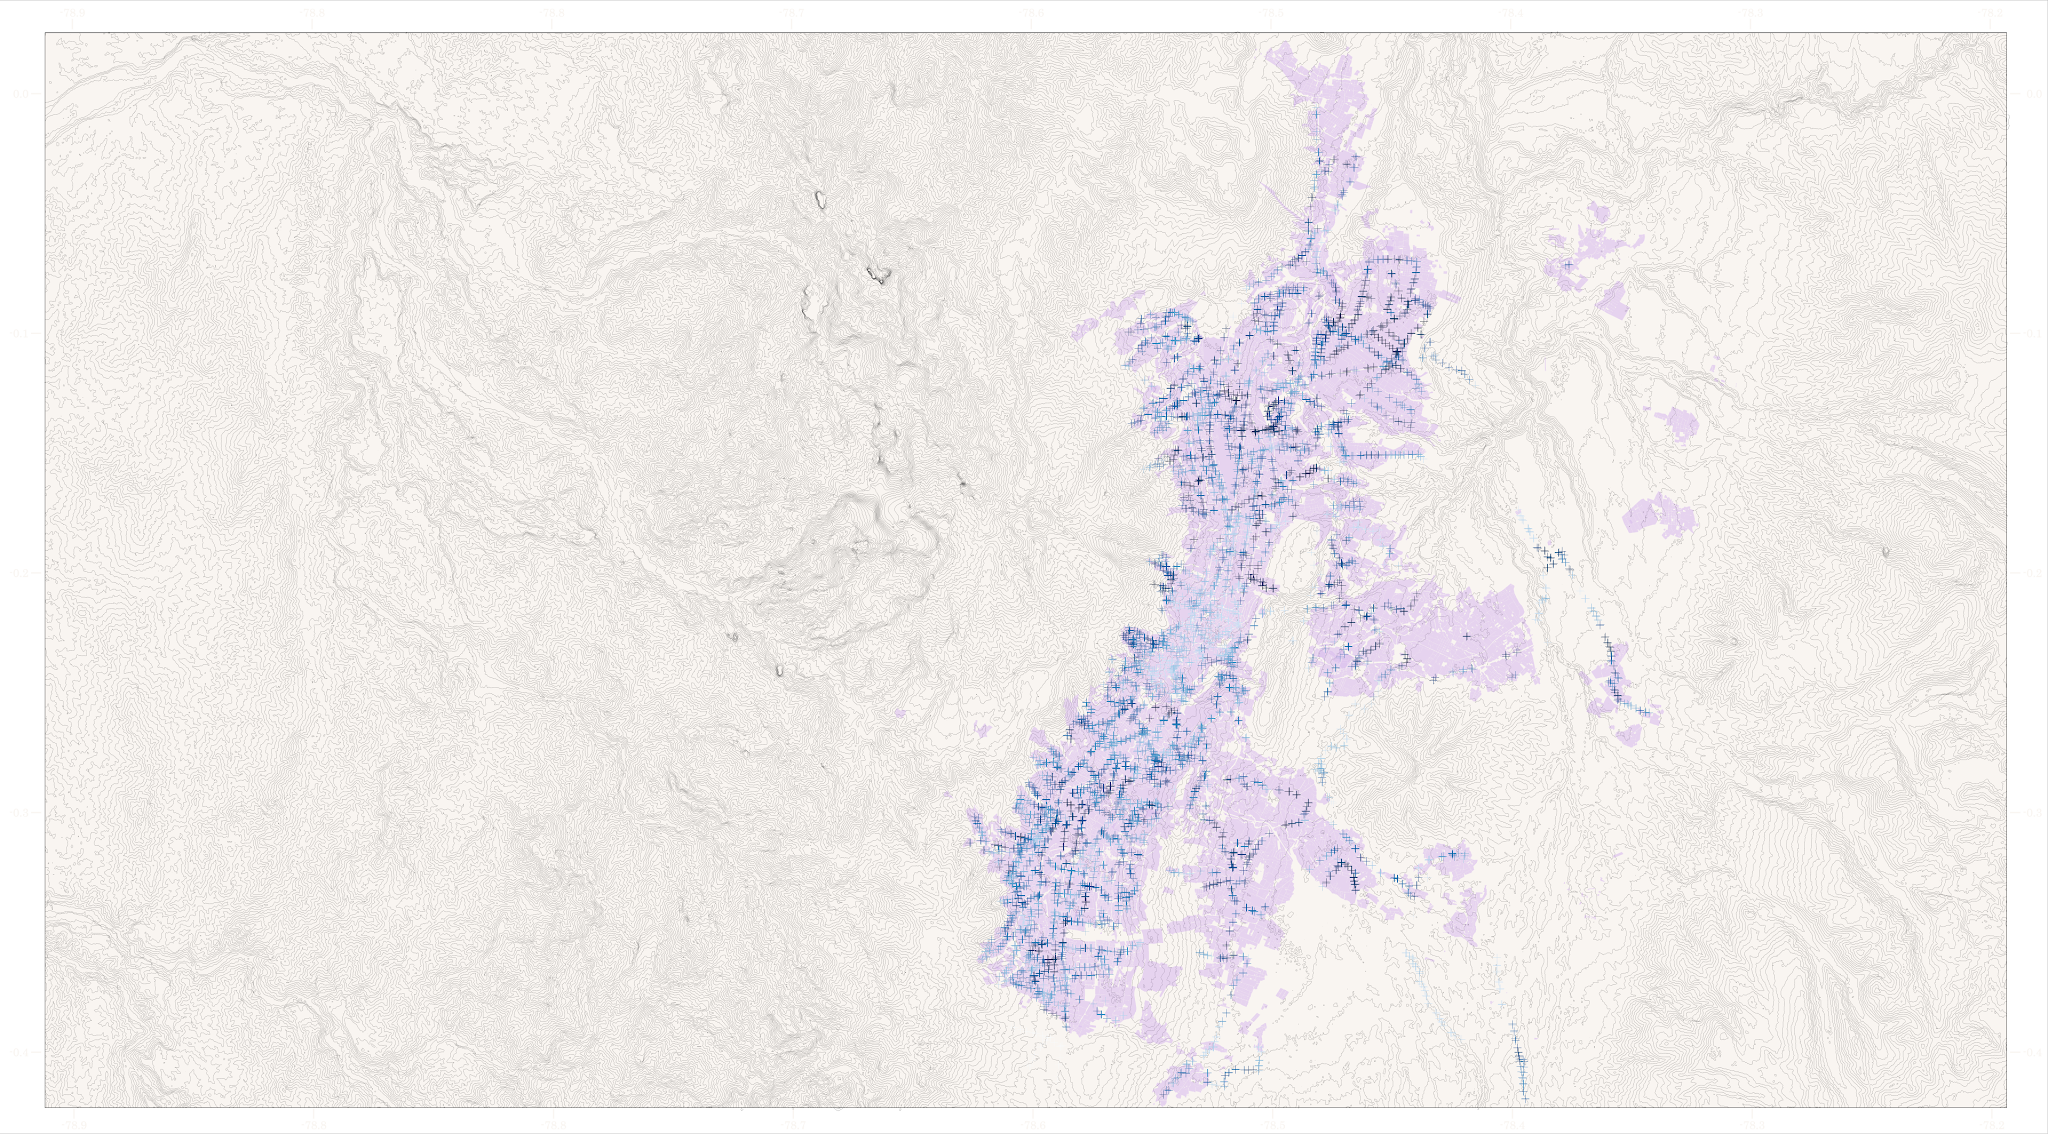
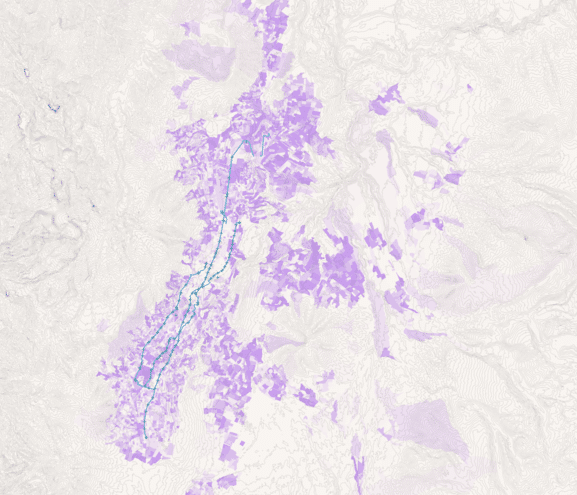
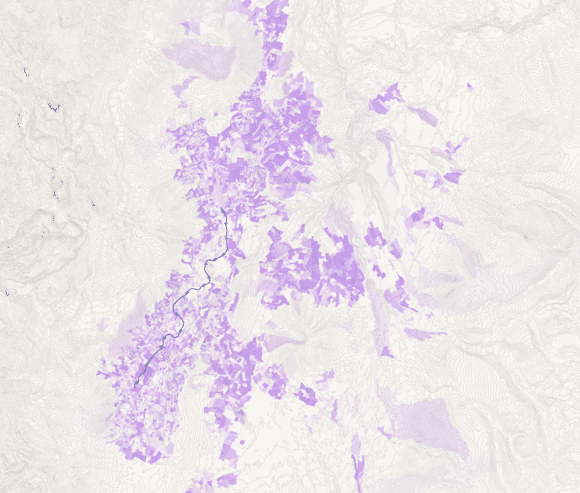
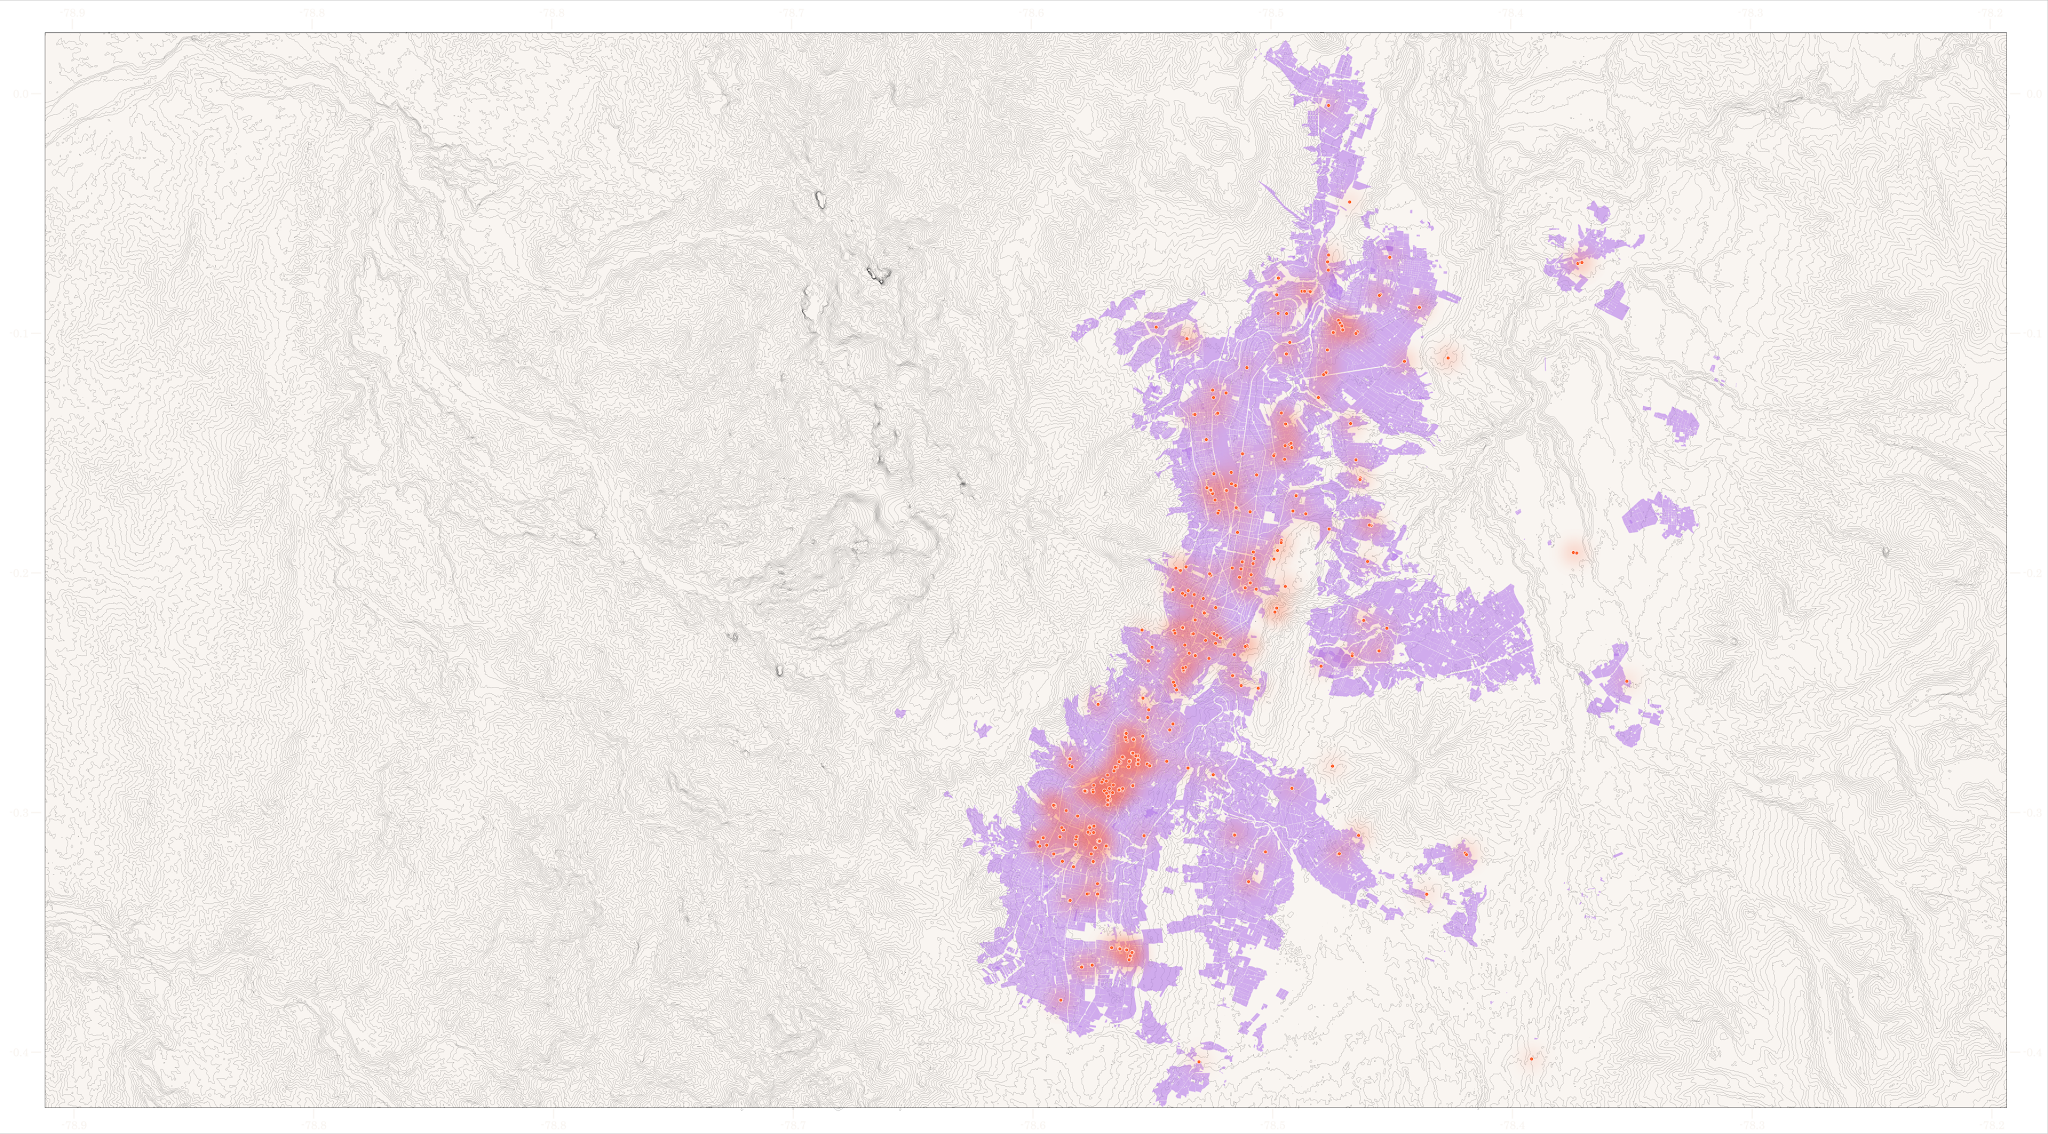
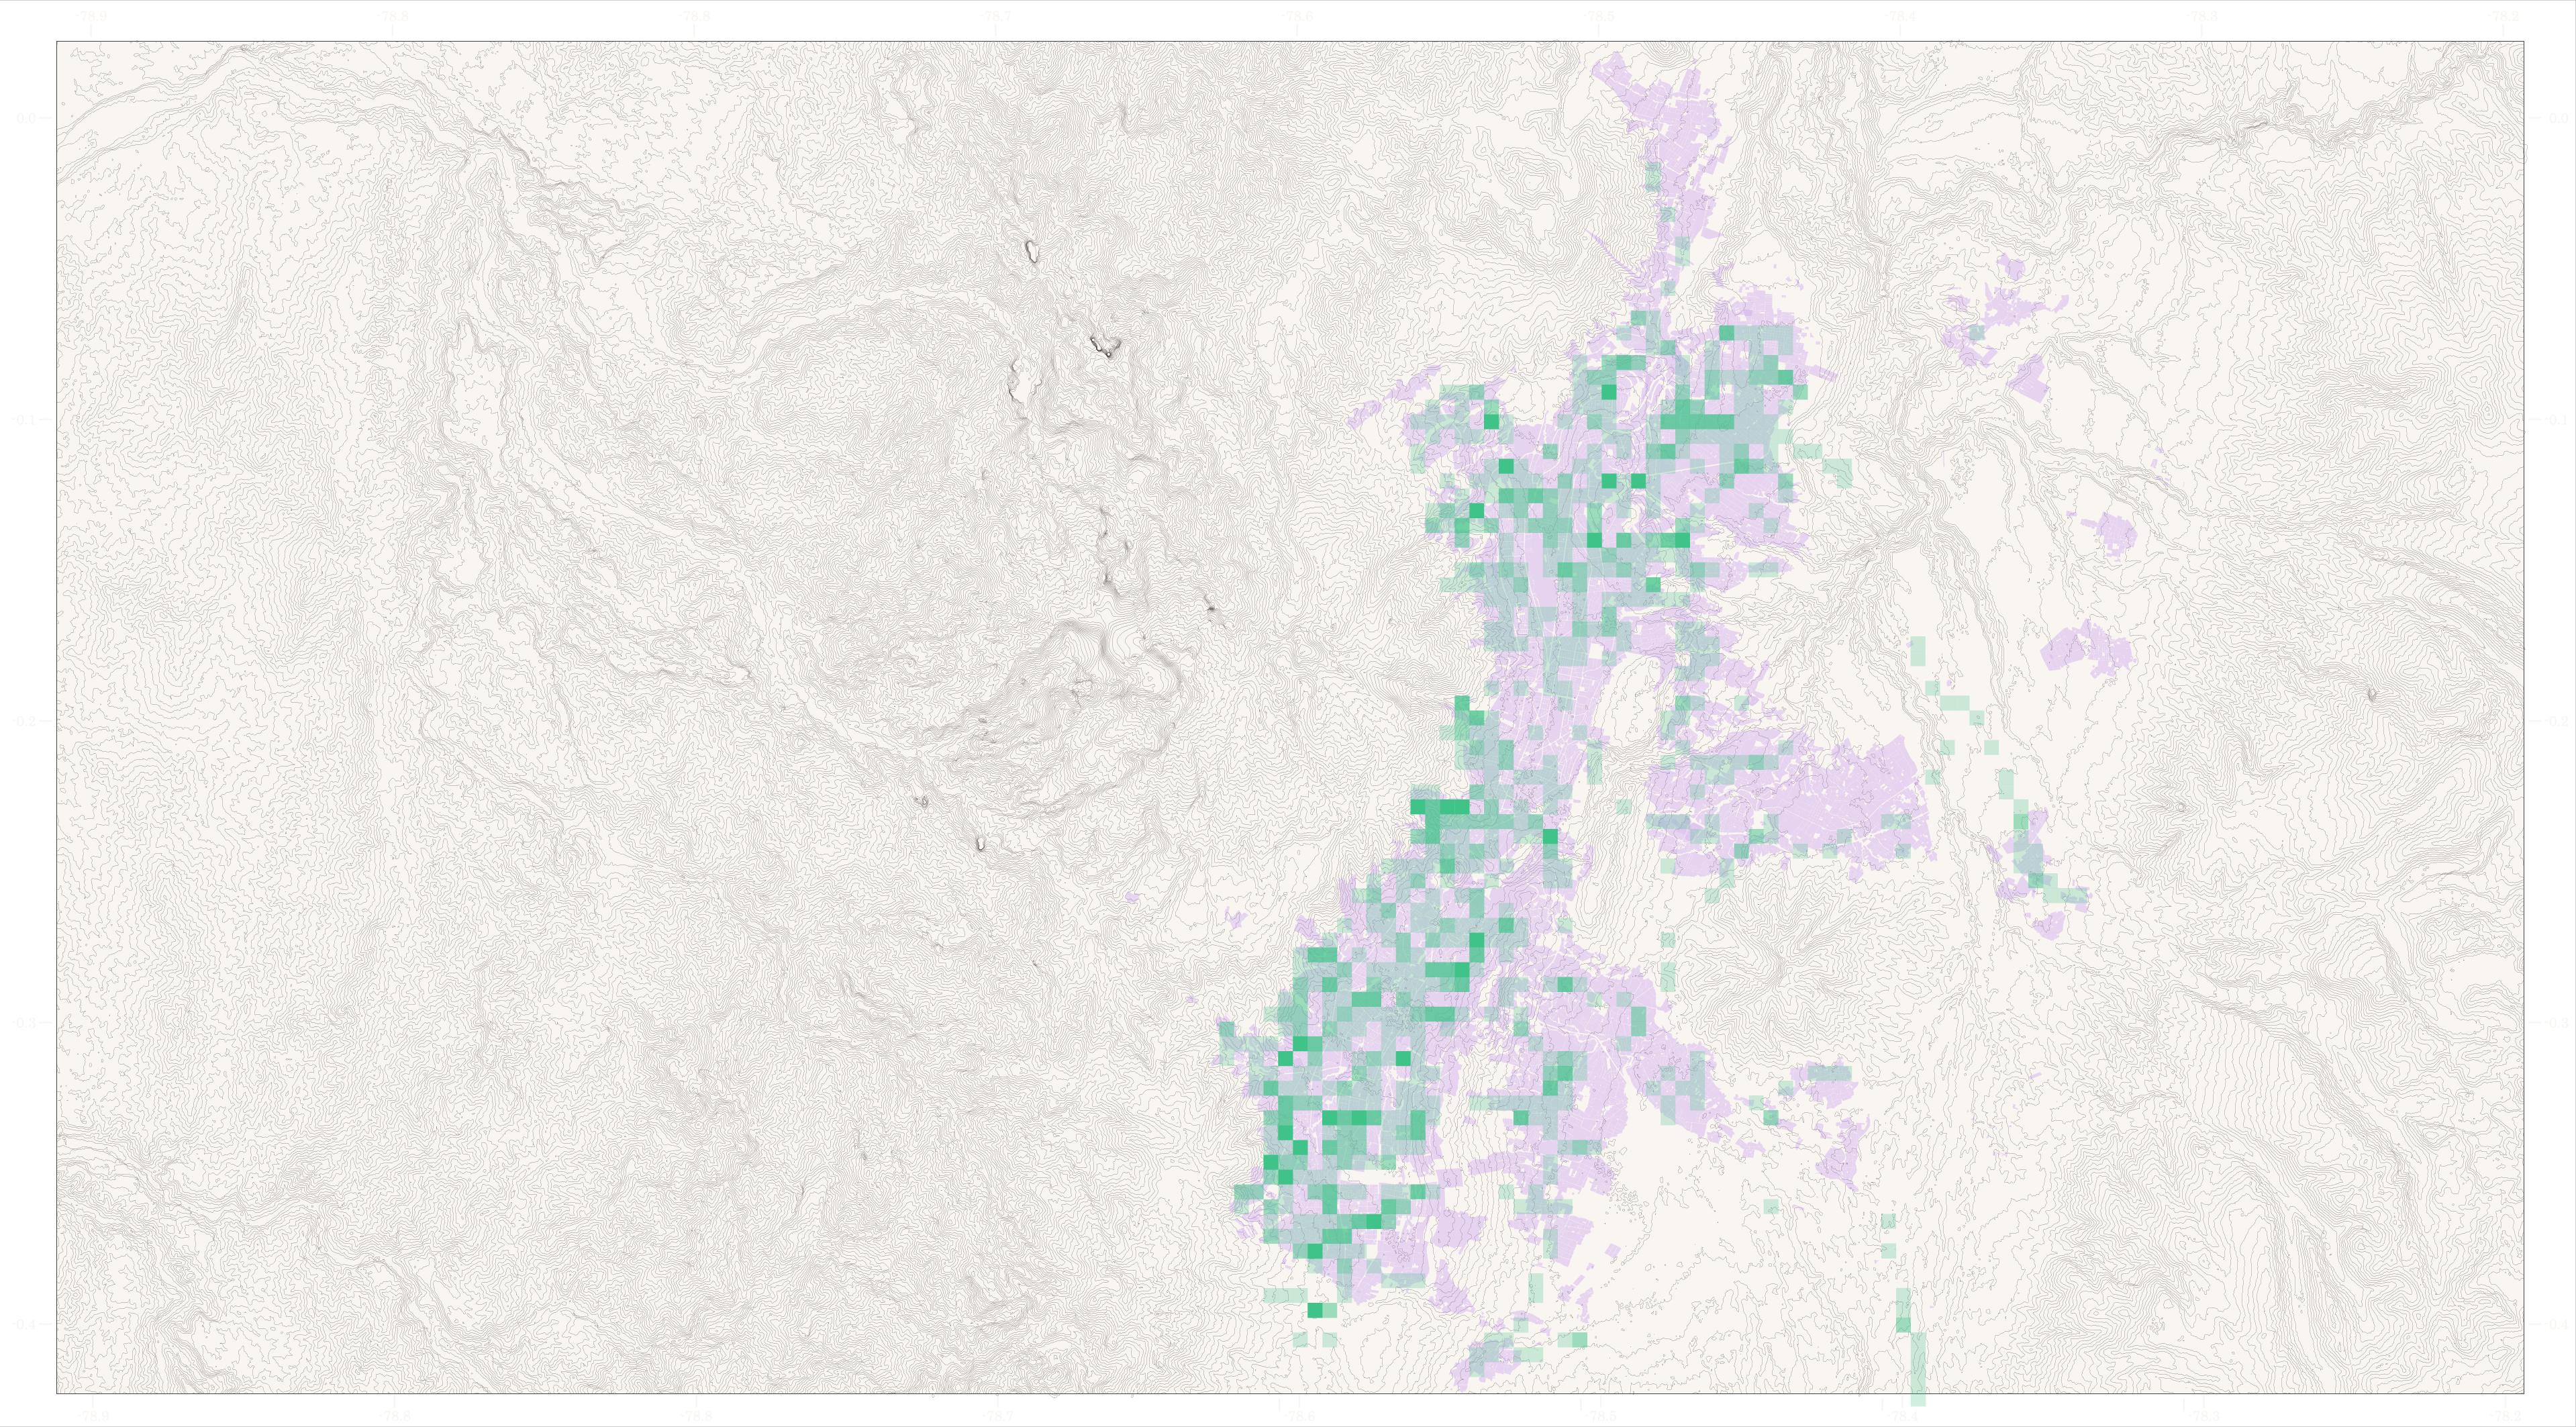
While our comparison with the plan was an initial method of prioritization, we also wanted to understand how the current usage of these stops might impact which are in more urgent need for intervention. Here, we take the population density surrounding each of the bus stops. However, a future layer of this analysis should consider demand for popular commuting destinations, like the business district, that have extremely low population density.
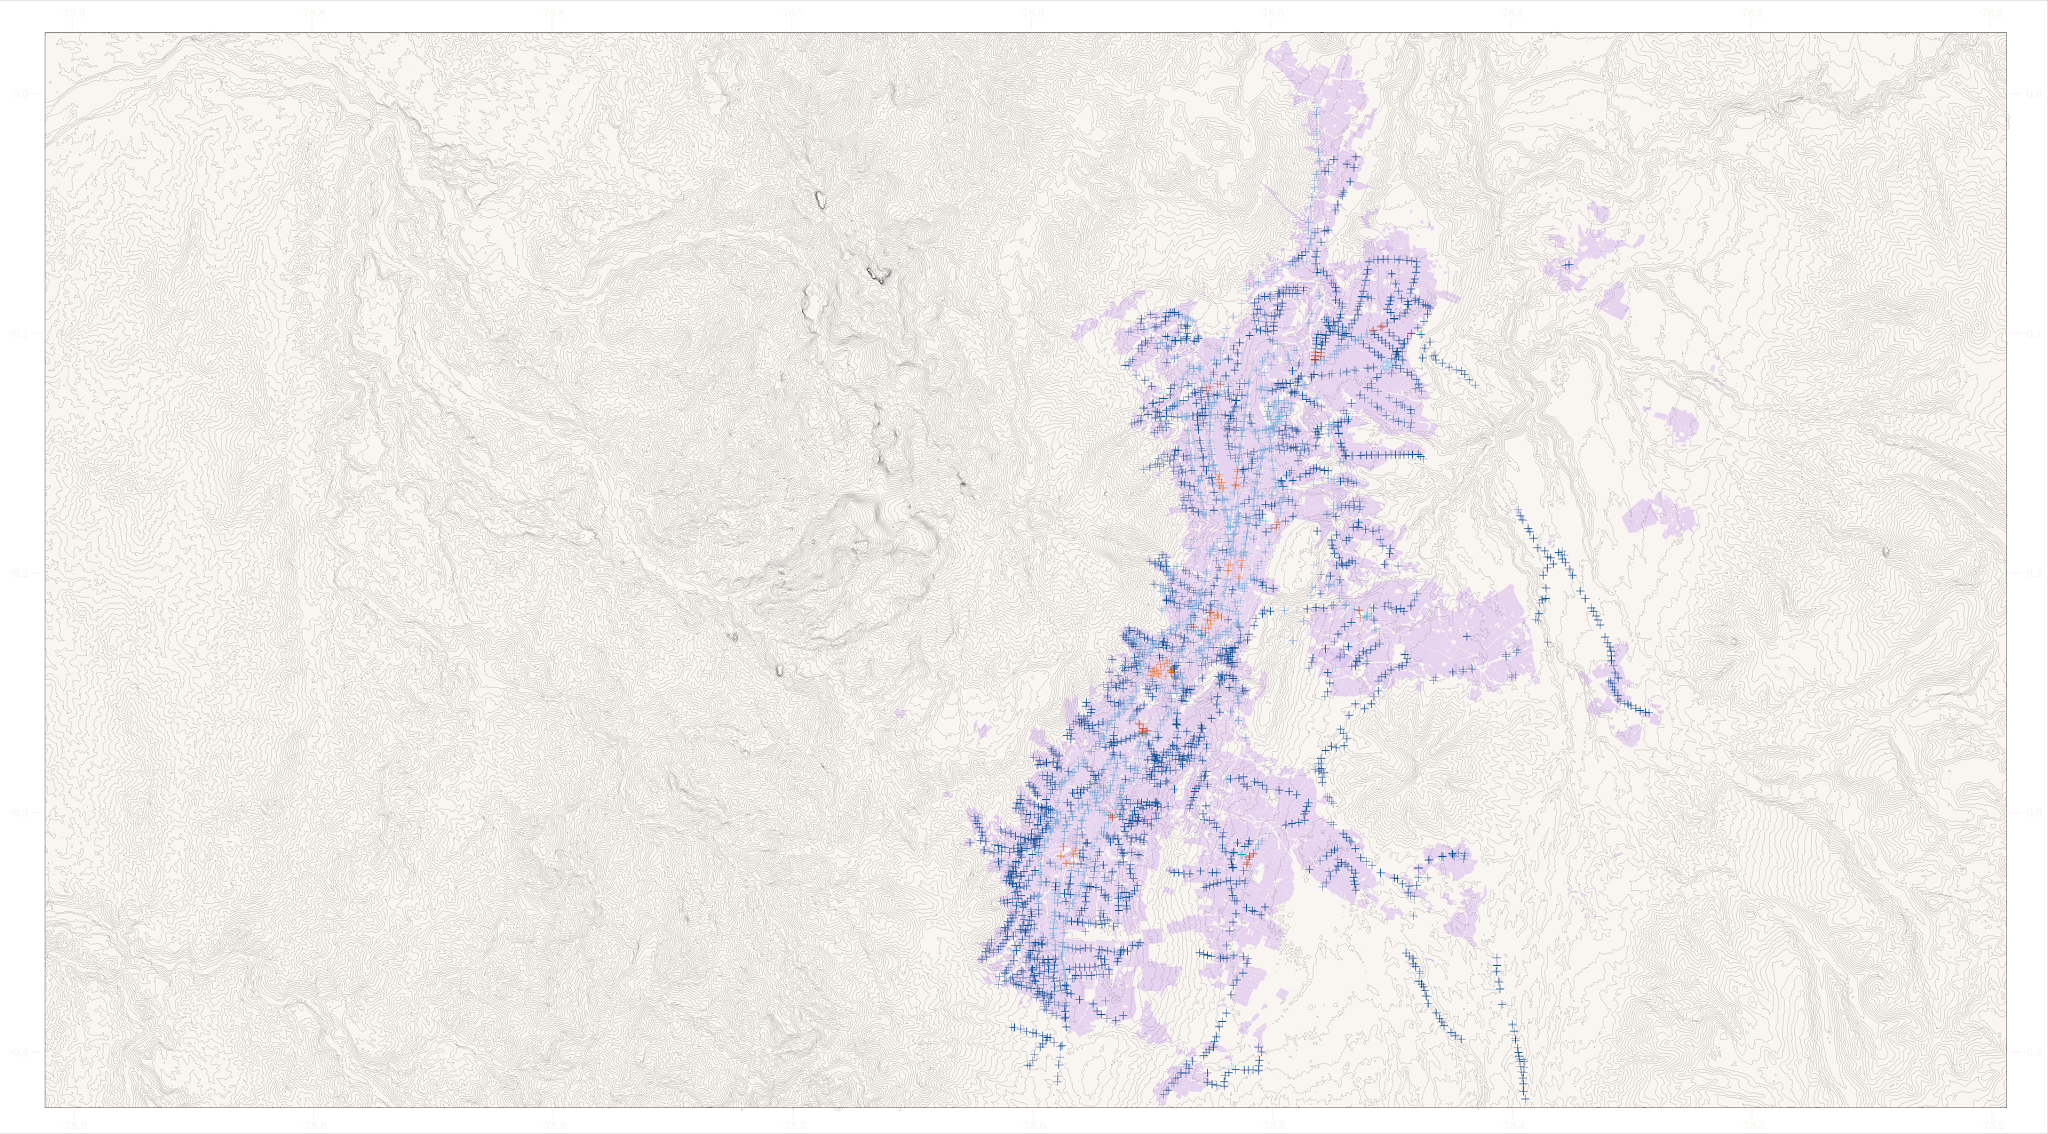
We evaluated how the current transit network relates to the PMMS final design. Here we can see which bus stops are in areas near proposed centralities, in orange, as well as minor centralities and planned bus routes, in lighter blue. We believe the plan should be revised, as this map clearly shows how it reinforces north–south interventions, while overlooking the critical need for east–west connections, which remains one of Quito’s main urban challenges. As the PMMS is implemented over the course of the next few years, some bus stops will remain important nodes of the network, while others might be transitioned out. By understanding the long-term plan for each of these, the Secretary of Mobility can ensure that Quiteños understand the transit system, and they can invest differently in stops.
interlude: Santiago vs. Bogotá
In 2007, Santiago’s replacement of the informal bus system with a new bus transit system was a disaster. Marketed as a project to offer dignified transit options and a world-class system, the Transantiago replaced long-trusted routes from one day to the next. Commuters waited at unfamiliar stops, sometimes having to get up two or three hours earlier to, hopefully, catch a bus. Buses infrequently passed stops and were constantly full, pushing residents to take the metro, overwhelming its capacity as well. Protests spread throughout the city, eventually leading to not only redesigns of the system, but an investigation into the political responsibilities for the failure of implementation of the Transantiago.
In contrast to Santiago, Bogotá provides an example of a best practice when upgrading a transit network. While Bogotá’s TransMilenio bus network was inaugurated in 2000, private buses continued to operate in areas of poorer coverage for over a decade. In 2011, the Sistema Integrado de Transporte Público (SITP) launched, promising to unify the fragmented and redundant services. Over the next 8 years, the private buses were phased out in stages, absorbing them into new companies, training drivers, offering formal contracts, and restructuring routes, made possible by the Mapatón, an effort by a team of students to ride, record, and map the entire private bus system, route by route.
By rooting the transition in public transit systems in patience, data, and community trust, the SITP and TransMilenio built an inclusive transit system over the course of two decades that was informed by existing transit patterns. In the time gap between Quito’s current transit system and an optimized one, how can Quito ensure that residents are not left behind and that their perspectives are prioritized?
- BUS STOP ANALYSIS
After understanding and analyzing the transport network at a broader scale, we wanted to shift our focus to the street level. We asked ourselves: How can we distill images of bus stops into typologies that lead to actionable interventions?
Our objective is to create a webmap of bus stops categorized by typology, along with an analysis of their surrounding context.
Based on statistical data gathered by the women´s mobility study, we got to know that the most unsafe areas in the neighborhood, according to women: are first: Corners, streets, and intersections. second : Parks and third Bus stops. With that information in mind, we decided to map the bus stops where these three physical elements
But then we questioned how we could go beyond these. How do other bus stop conditions at the human scale affect women’s perception of safety?
Most unsafe areas in the neighborhood, according to women: 38% Corners, streets, and intersections | 21.3% Parks | 17.8% Bus stops
Sources of insecurity in public space: 89.9% Alcohol consumption | 75.8% Drugs | 43.4% Witnessing robbery
We wanted to understand how bus stops in Quito look, but also how the other elements found in the surroundings and their combinations might generate different dynamics and experiences for the diverse riders who wait at them.
Our objective became to create a single map containing objective information about Quito’s bus stops. To achieve this, we scraped images in order to identify different bus stop typologies, as well as key elements in their surrounding environment.
To get more into detail, we used Google Street View API, and coordinates from official open data files from Quito to get 6 images, at 60 degrees each until completing the 360 view. We did that to be able to get better quality and no distorted images for a detection model of bus stops. In the process, we lost 69 bus stops since there is not always a street view in every one of them.
We created a python code which took these images and converted them to Base64 and then sending it as text to the model. Then, using ChatGPT API, 4.1 mini LLM, we created a prompt for detecting the bus stop categories, a process that took much iteration. It was essential to be extremely restrictive, since the model tended to detect based on patterns and prior knowledge, not just what is seen in the image.
Afterwards, we manually checked the outputs on 150 images to get a sense of the accuracy percentage. It turned out to be 87%. The output from the script was a file with the coordinates, a bus stop typology, and a short description of what was seen.
These where the results from the CSV turned into a maps of the bus stop categories.
We initially attempted to analyze the surroundings with the six images per bus stop, but the model wasn’t capturing the entire area as a whole. To address this, we created a panoramic view for each location. We defined the categories we wanted the model to analyze for each bus stop and had a preliminary set of keywords in mind. However, we first needed to understand the model’s language to ensure those keywords could be effectively used. As a second step, we defined the categories in the prompt, including a short description of each and a list of objective—not interpretive—keywords. Descriptive interpretation would be incorporated as a future step, based on input from local residents. We also exported the results and merged all the information on proximity, typologies, and surroundings into a unified dataset.
These results were visualized in an interactive web map that allows users to explore different bus stops and view the full results of our analysis. You’ll be able to see the map after this presentation, but just to highlight a few features: it includes a filter by typology in the top-right corner, and clicking on a bus stop opens a popup displaying its panoramic image along with a description, also a survey you could access which we will explain in the next and last step.
.gif")
- FEMINIST DESIGNING
Since we know that the data gathered lacks important perspectives of those who actually experience these spaces, we designed this step to incorporate local input. The goal was twofold: first, to validate and correct our analysis, and second, to collect more subjective and personal insights about users’ experiences at the bus stops. To achieve this, we developed a participatory strategy to gather experiential data, along with a collection of different interventions and strategies. This process is open, iterative and is nourished by community input.
Based on the web map—integrating the previously discussed layers, including bus stop typologies, surrounding analysis, and prioritization we propose a Mapatón. All stakeholders would be involved in the creation of it, specially consultancies: Quito Como Vamos and the Gender Mobility study. This participatory initiative consists of four components: a gamified survey at each bus stop, a conventional survey to complement it, an option to complete the survey online at a later time, and a community workshop. Together, these tools aim to collect experiential input and foster local engagement in the process.
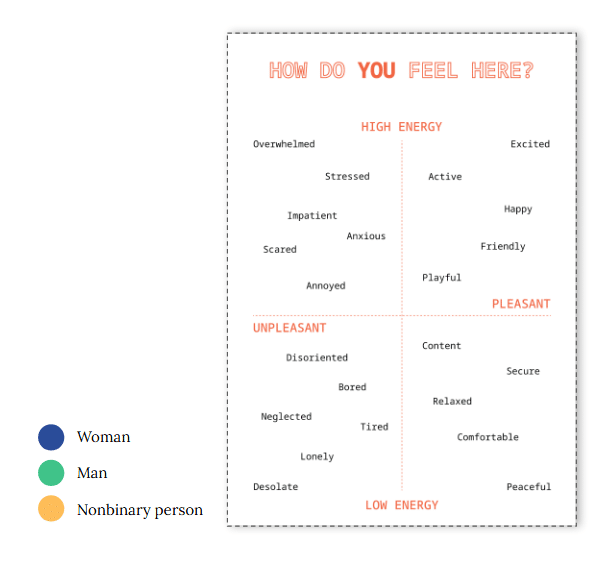
Let’s go back to Carmen. Her experience on this journey would go something like this: she arrives at the bus stop, as she usually does at 7am, but this time she notices a large poster that catches her attention. Curious, she asks one of the people nearby—clearly identifiable as a Mapatón volunteer thanks to a vest or badge—what it’s about. He explains that they’re collecting information about bus stops as part of a future intervention plan.
Carmen is then invited to indicate how the space makes her feel by placing a blue sticker on the poster, since she identifies as a woman. Her daughter puts a sticker as well. For this presentation, the poster is shown in English, but in practice it would be in Spanish. After placing her sticker, the volunteer asks if she’d like to participate in a very short survey in exchange for a free ticket for the bus.
She agrees, as her bus won’t arrive for a while, she’s not very tech-savvy, and she’s interested in the free ticket. The volunteer explains she can skip any questions. He asks her age, gender, ethnicity, and when she usually uses the stop—she selects both morning and afternoon. Then he asks how long she’s been waiting and if she’s alone. She’s invited to leave a comment, record a voice note, or upload a photo or video. It’s quick and simple. She is also invited to participate in the upcoming neighborhood workshop, and to invite any neighbors she thinks might want to share their insights.
All these participatory activities generates data that is fed back to the webmap, and people will be able to see the bus stops reviews when clicking on the specific bus stop they are interested in. These experiential data would not be shown as a kind of heat map of good and bad experiences.
Then we have a case study selection, which would be fed by the data collected and a living feminist catalogue which would be a part of the digital platform. It is a living catalogue in the sense that people could comment on and is open for more projects to be added over time. As a starting point we have around twenty analogue examples from all around the world and they are divided on different categories which are: design, policy, social strategy. The catalogue would be curated by academia and government agencies.
Then these selected case studies go to another community input, which would be a design workshop. Here Carmen attends and gets the chance to have a face to face encounter with decision makers, and shares her perspective as well as codesigns her zone’s bus stops.
Finally the tangible outputs of these whole process would be different types of interventions: hyper tactical, tactical, and more permanent ones. Not only would these interventions change the daily experiences of commuters but they would also feed back into the catalogue, providing inspiration and examples for future interventions.
City-wide automated analysis of the human scale can and should be complemented by human insights for a holistic understanding of cities.
The community should be actively involved throughout the whole process, contributing through diverse interfaces
to analysis, decision-making, design, and implementation
By focusing on the human experience, both how Quiteños navigate the city and adapt to changes in its infrastructure,
Quito can strengthen its transit plan to integrate and empower residents.
