
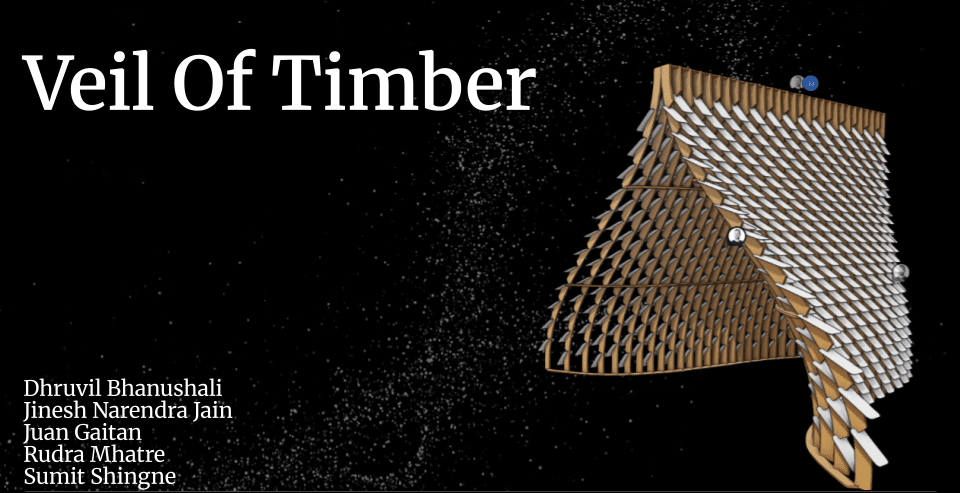
Veil of Timber explores the transformation of a parametric pavilion into a detailed, data-driven BIM system. By integrating computational design and metadata with the help of grasshopper and real-time visualisation using Speckle and Power BI. The project bridges geometry and data to enable querying, analysis, and informed decision-making.
Overview
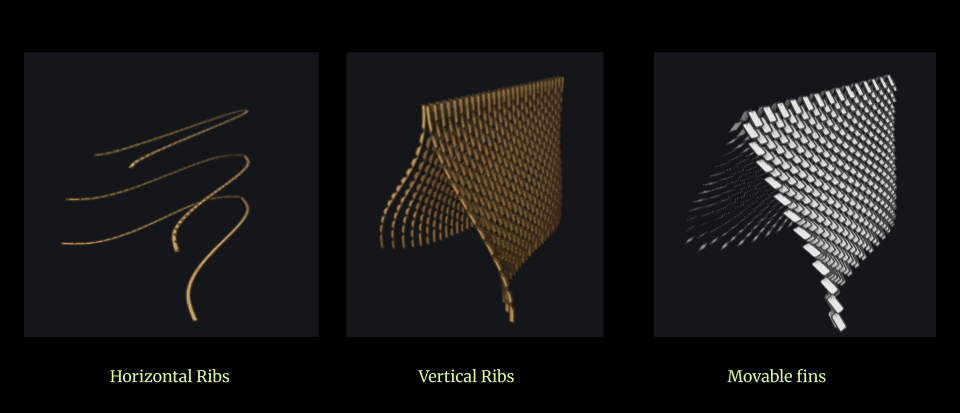
The pavilion is a parametric system composed of interdependent structural and facade elements. Its geometry emerges from the interaction between vertical ribs, horizontal ribs, and a field of movable fins, creating a dynamic surface that responds to both structural logic and spatial articulation.
The aggregation of these components results in a continuous yet differentiated form, where repetition and variation coexist within a controlled parametric framework.
Parametric Logic
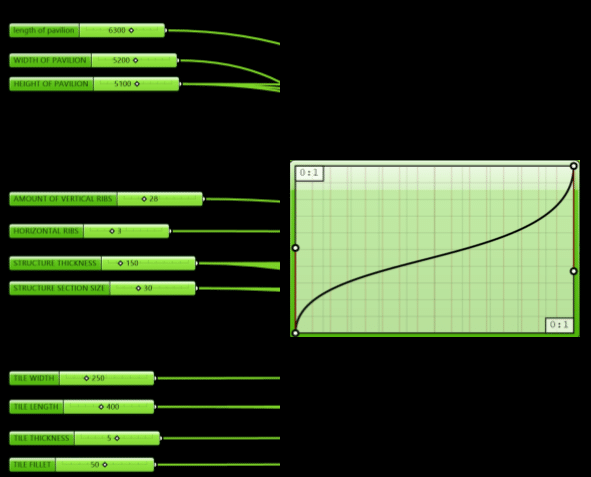
The pavilion is driven by a parametric logic that controls the distribution, orientation, and density of its components. Through adjustable parameters, the system allows variations in fin rotation, spacing, and curvature, enabling the exploration of multiple spatial and formal outcomes.
This approach facilitates rapid iteration while maintaining coherence across the overall structure. The parametric setup ensures that changes at a local level propagate through the system, allowing the design to remain adaptable while preserving its underlying logic.
Data Flow
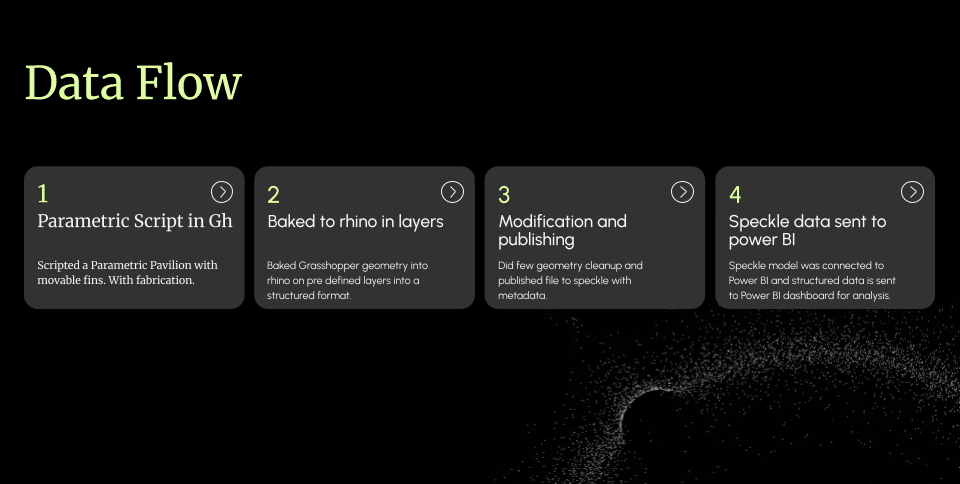
The project extends beyond geometric modelling into a structured data workflow. The parametric model is first developed and organised in a layer system, where each component is categorised and prepared for data integration.
The geometry is then enriched with metadata and published to Speckle, enabling versioned data exchange across platforms. This workflow establishes a continuous pipeline from design generation to data visualization, allowing the model to function as both a geometric and informational system.
Metadata and BIM Structuring
To move beyond geometry, we assign structured metadata to each component of the pavilion. Each element carries attributes such as type, material, side, and spatial classification.
This allows the model to function as a queryable BIM dataset rather than a static representation. Individual elements can be filtered, grouped, and analyzed based on their properties.
As a result, the pavilion is not only defined by its form but also by its underlying data structure, enabling a more informed and flexible design workflow.
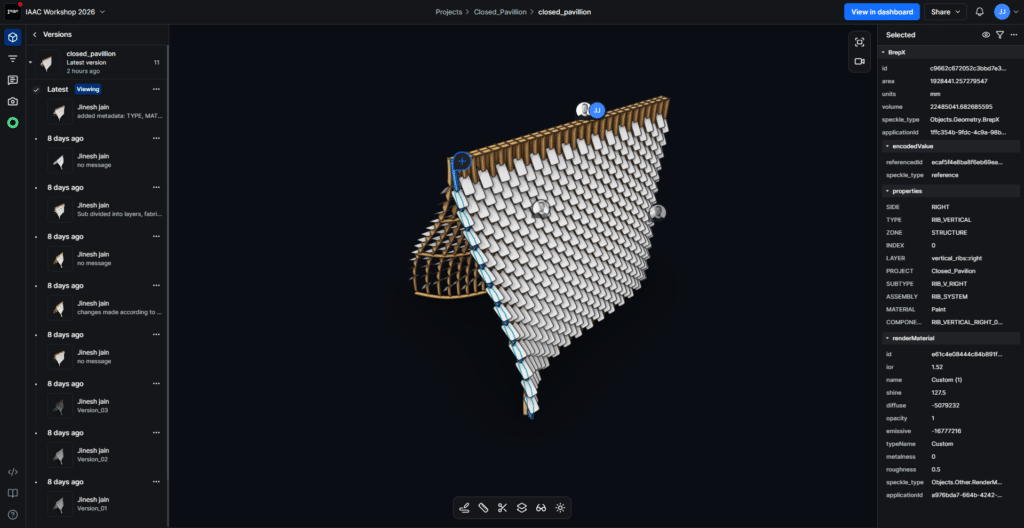
Speckle Dashboard
Speckle enables the model to be explored as a live, distributed dataset. Elements can be filtered and queried based on their embedded properties, allowing specific components to be isolated and analyzed in real time.
This interaction shifts the model from a static representation to an active data environment, where geometry and information remain directly connected.
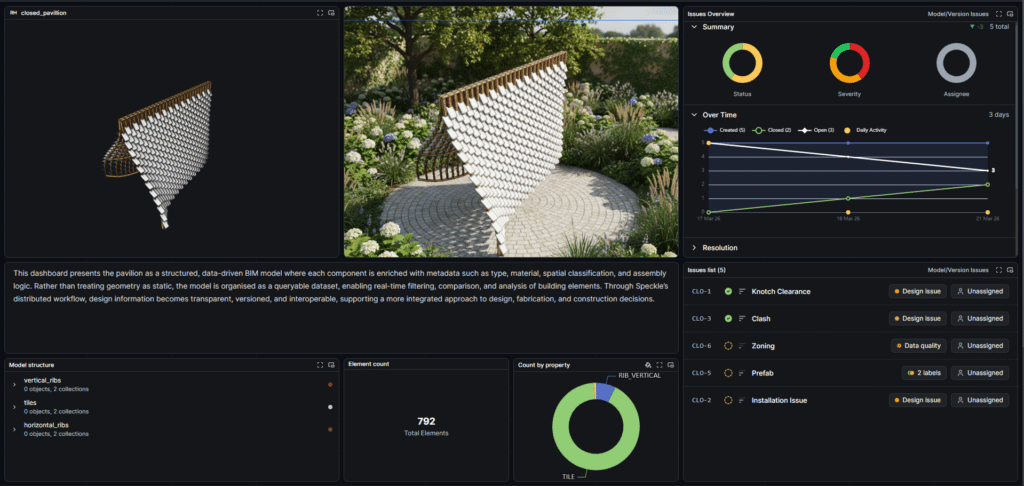
Power BI Dashboard
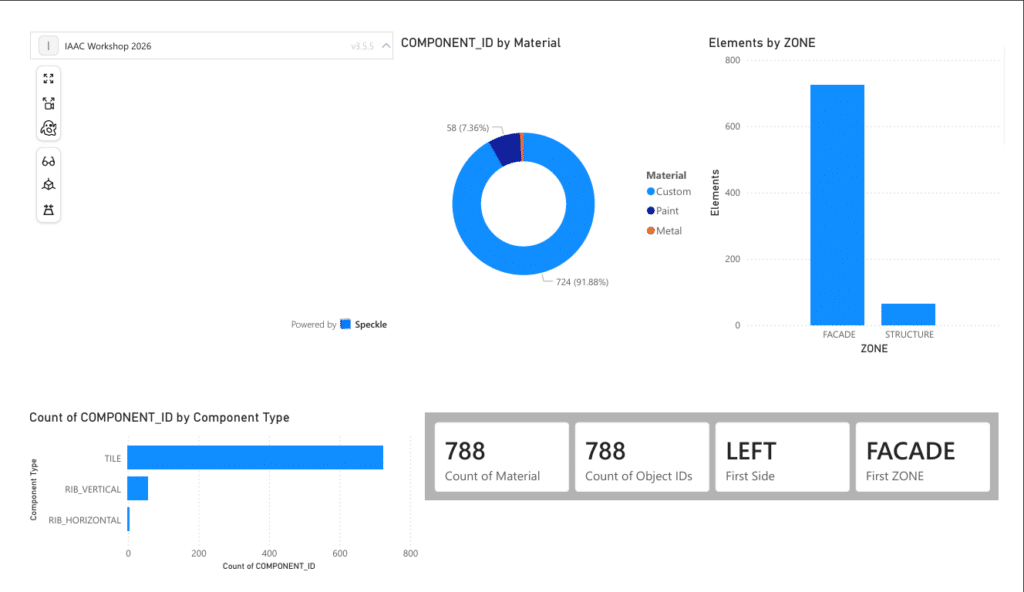
The structured model data is further analyzed through interactive dashboards in Power BI. By translating BIM data into visual formats, the system reveals patterns such as component distribution, material usage, and spatial classification.
These visualizations support data-driven evaluation of the design, allowing decisions to be informed by measurable insights rather than purely geometric interpretation.
Conclusion
The project demonstrates how parametric design can evolve into a data-driven BIM workflow. By embedding metadata within geometry and enabling real-time querying and visualization, the pavilion operates as both a spatial and informational system.
This approach redefines BIM as a programmable and interactive framework, where design decisions can be informed, evaluated, and extended through data across the entire lifecycle.
