
HaBiCoM is an AI-powered copilot designed to assist architects, designers, and users in shaping smarter, more responsive interior spaces. At its core, HaBiCoM redefines the way we approach furniture placement within residential environments by aligning each design decision with the user’s unique daily habits, lifestyle rhythms, and thermal comfort needs.
Unlike traditional layout tools, HaBiCoM doesn’t just automate furniture arrangement it understands the lived experience within a space. Leveraging data such as behavioral patterns, comfort zones, and thermal analysis, it proposes adaptive interior configurations that optimize both function and wellbeing.
Through a combination of spatial graph logic, machine learning, and environmental feedback, HaBiCoM helps to:
- Map activities to appropriate furniture and spatial zones,
- Maximize thermal comfort through strategic placement,
- Support sustainable and user-centered design outcomes.
Whether you’re designing a compact studio or a multi-room apartment, HaBiCoM acts as a decision-making partner bringing clarity, adaptability, and comfort to the forefront of residential design.
Let our copilot guide you in designing a space where every piece of furniture enhances your comfort,
perfectly tuned to your lifestyle and thermal needs.
Concept
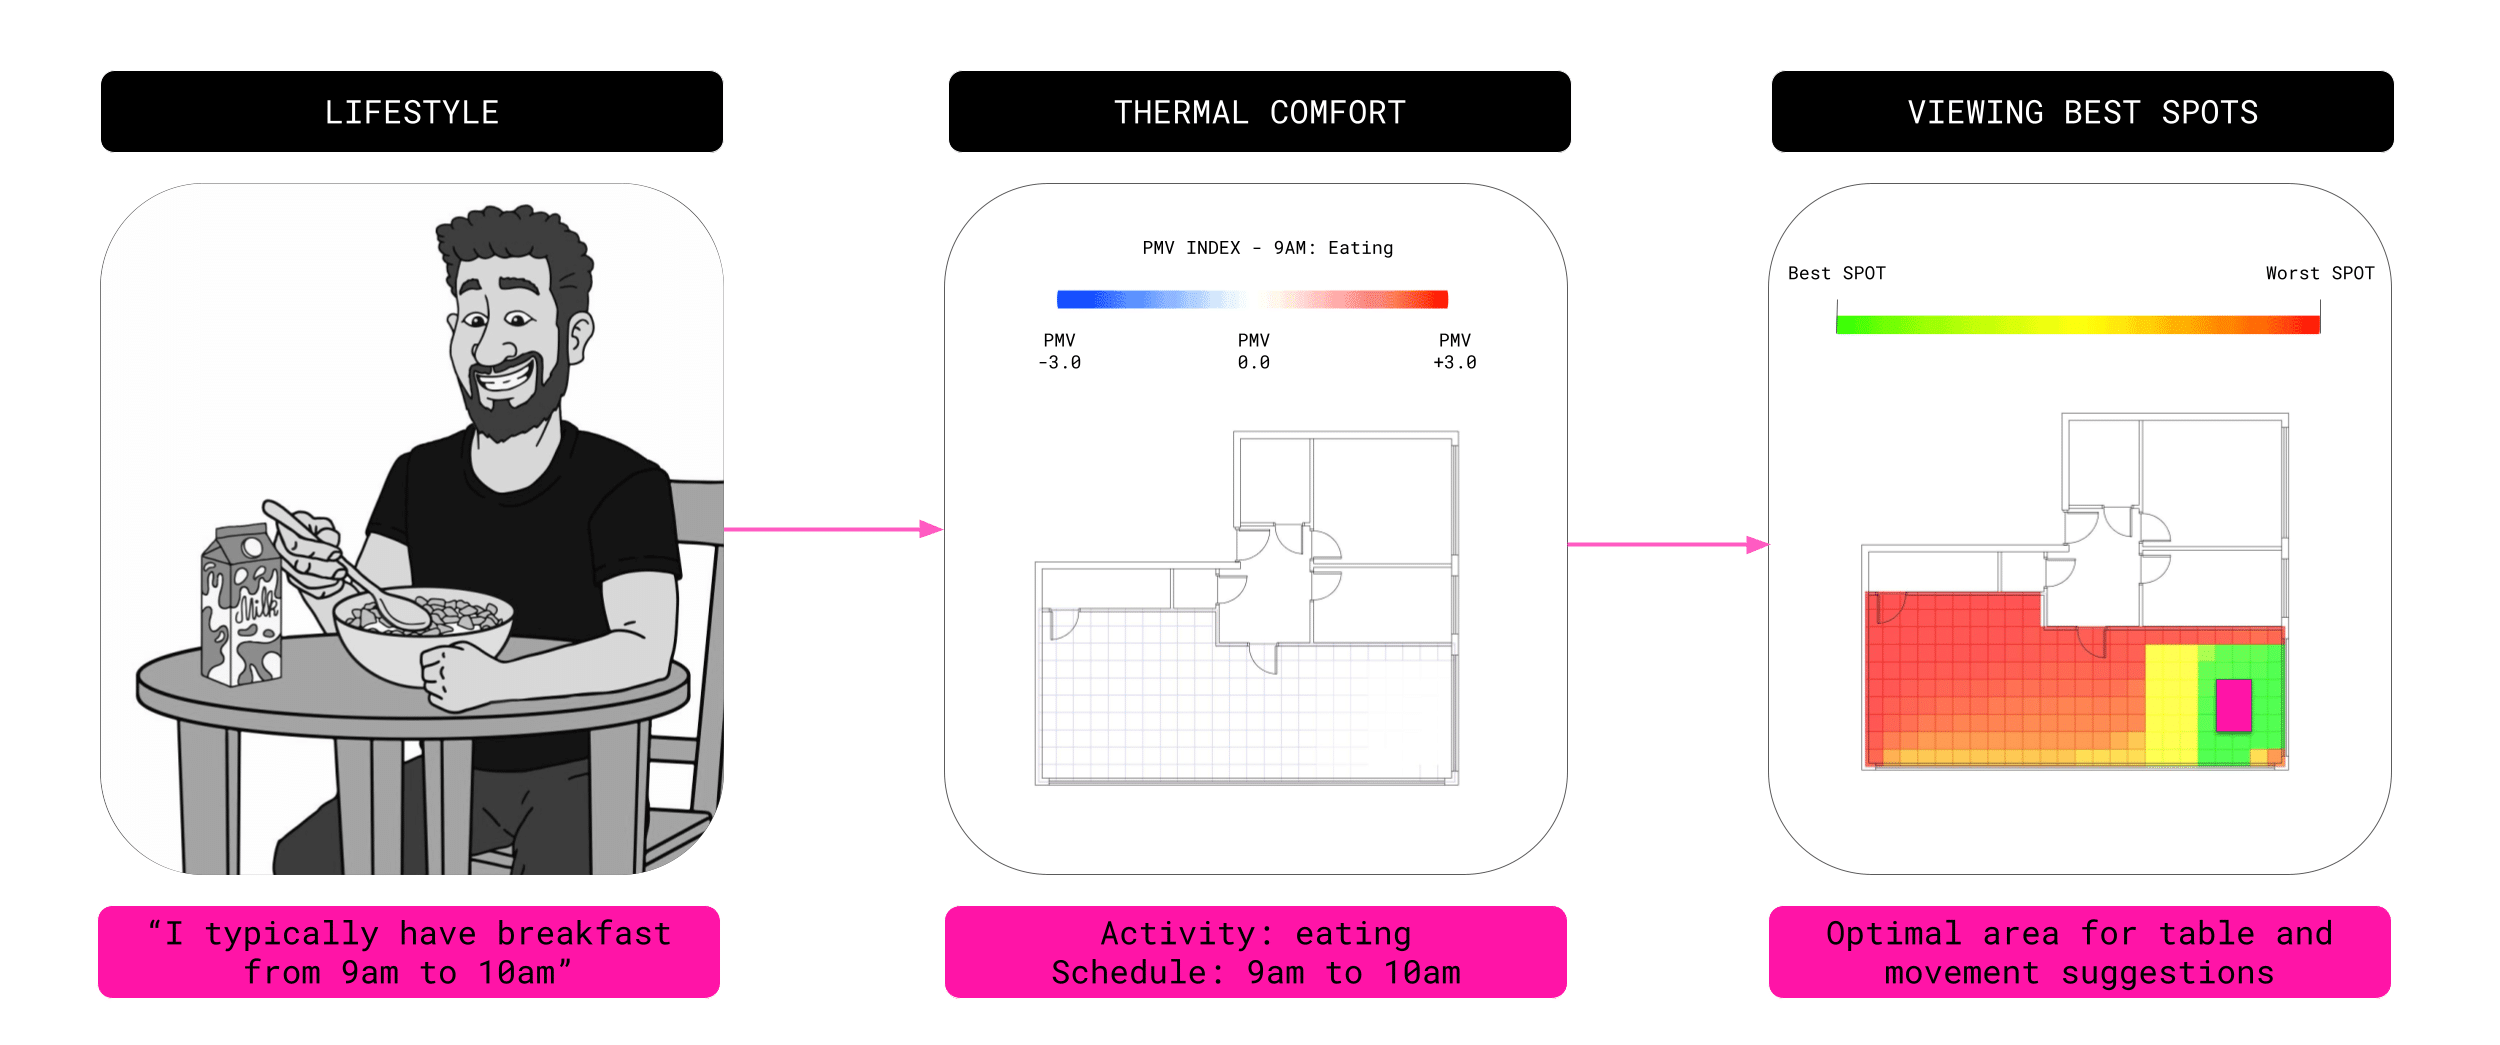
User Input via Natural Language
Users describe their daily routines in plain language. The system extracts activities, timing, and preferences and estimates metabolic rates associated with each activity.
Data Structuring & Comfort Prediction
This information is structured into a JSON schedule and processed using a PMV (Predictive Mean Vote) model to predict thermal comfort. A real-time surrogate model allows instant feedback without long simulations.
Apartment Layout + Graph Decoding
Users either import or generate their apartment layout. HaBiCoM matches it against a large dataset of apartment plans using a nearest-neighbor graph-based method. Furniture relationships are decoded from the database to populate the space.
Thermal Mapping & Furniture Suggestions
A comfort heatmap is overlaid on the layout, showing optimal spots for each activity. If the existing furniture is already present, HaBiCoM suggests subtle repositioning for improved comfort. If not, it proposes ideal placements.
WORKFLOW
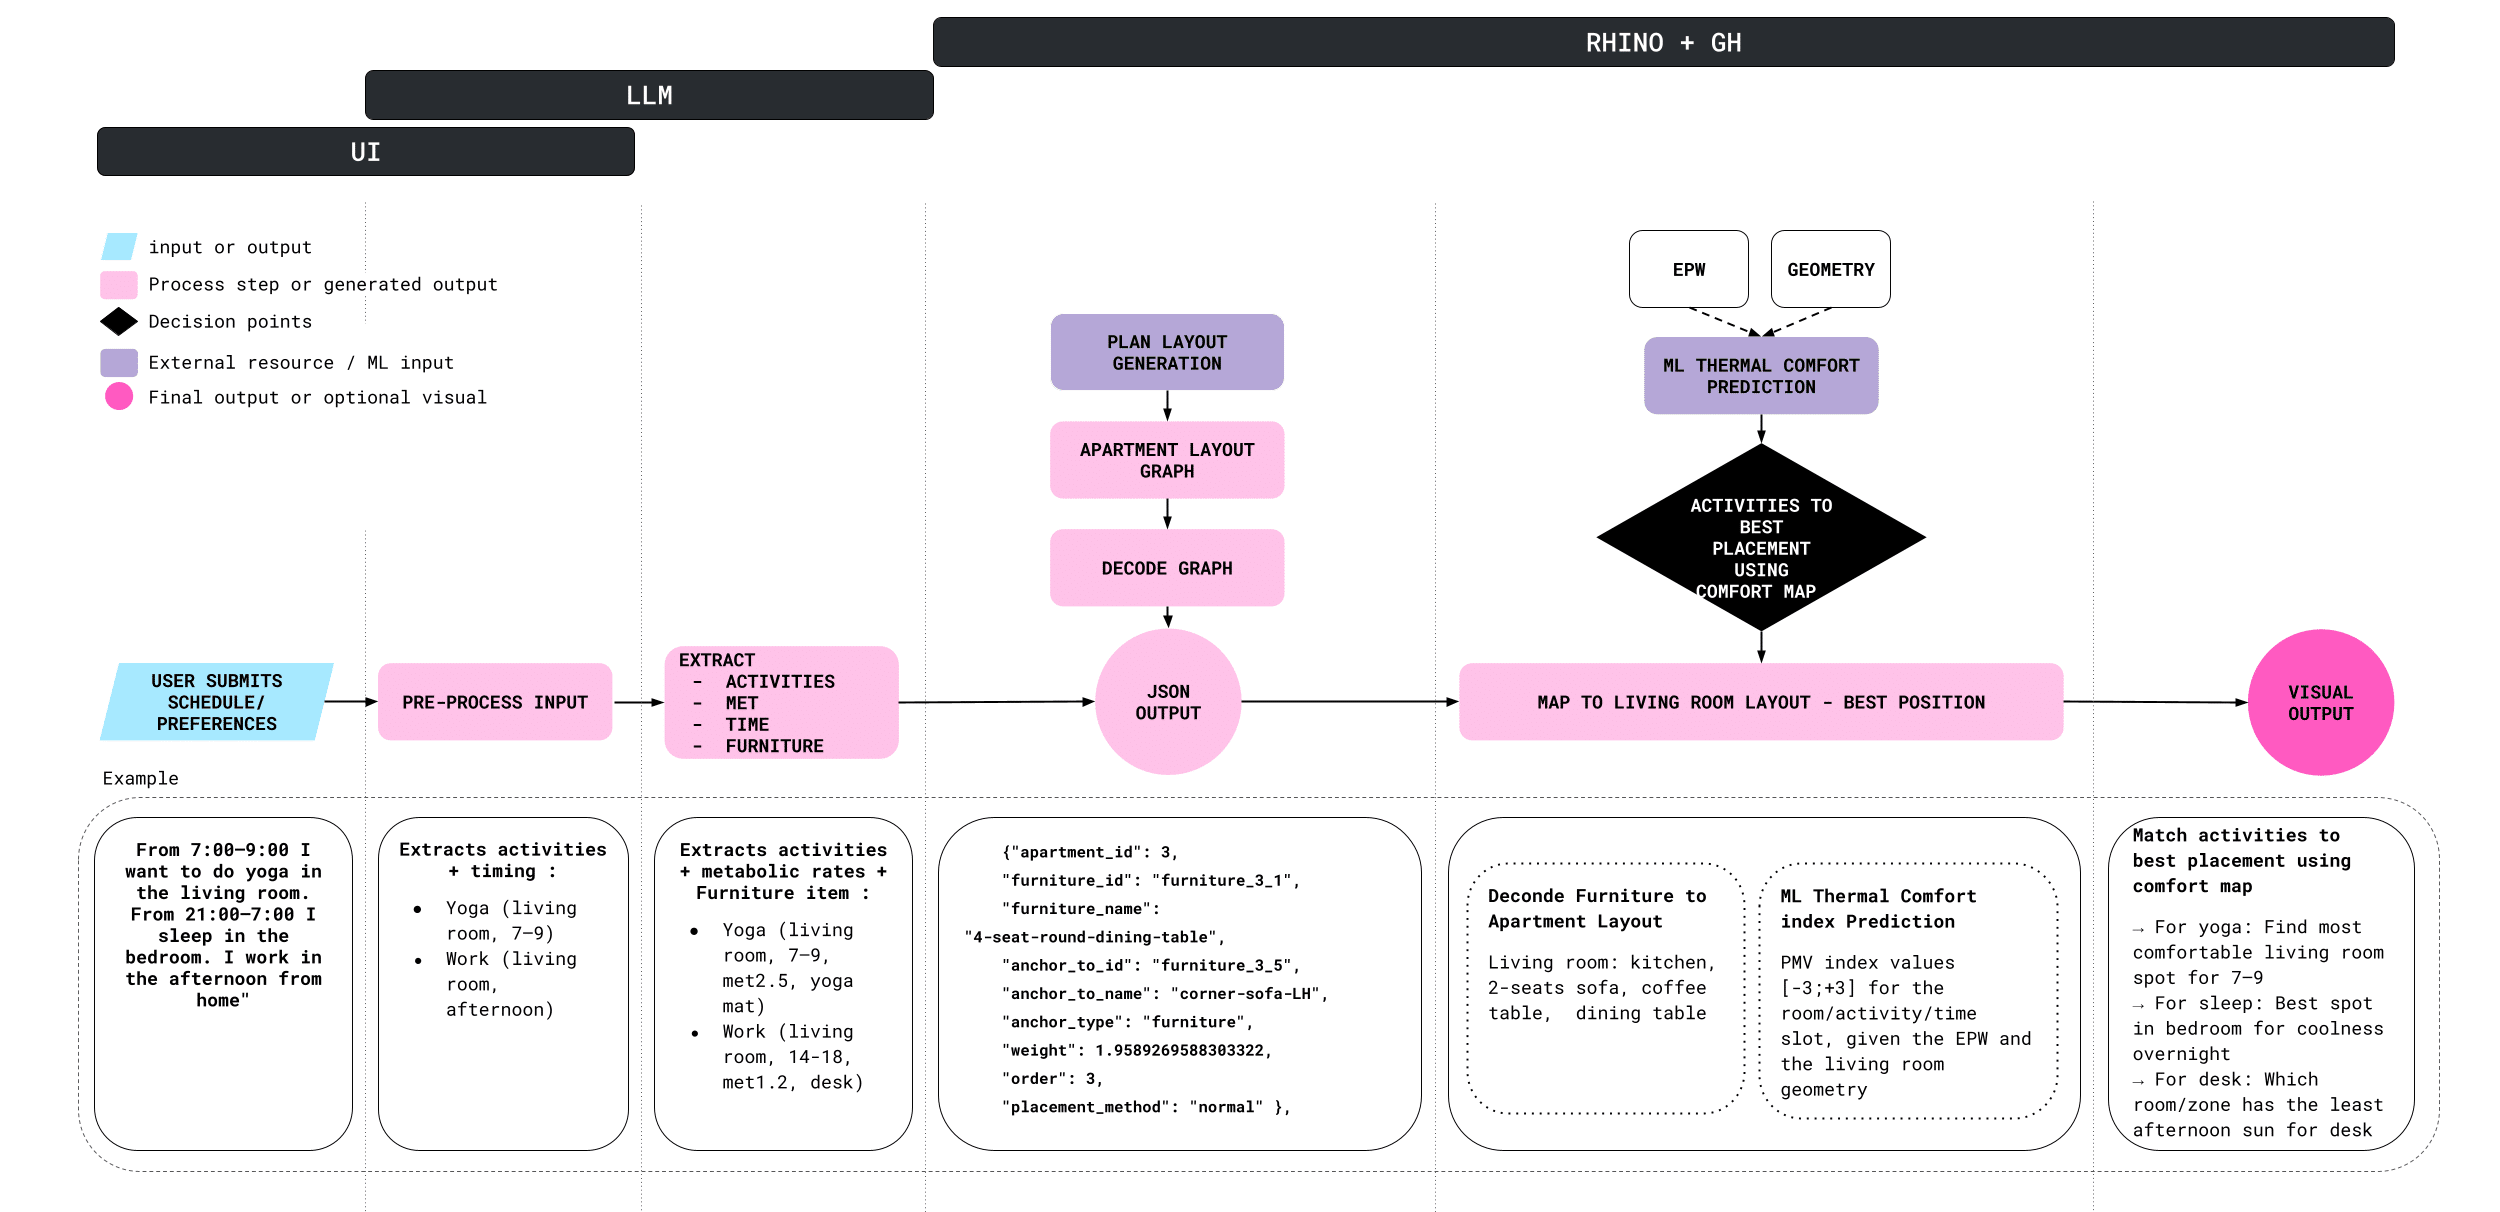
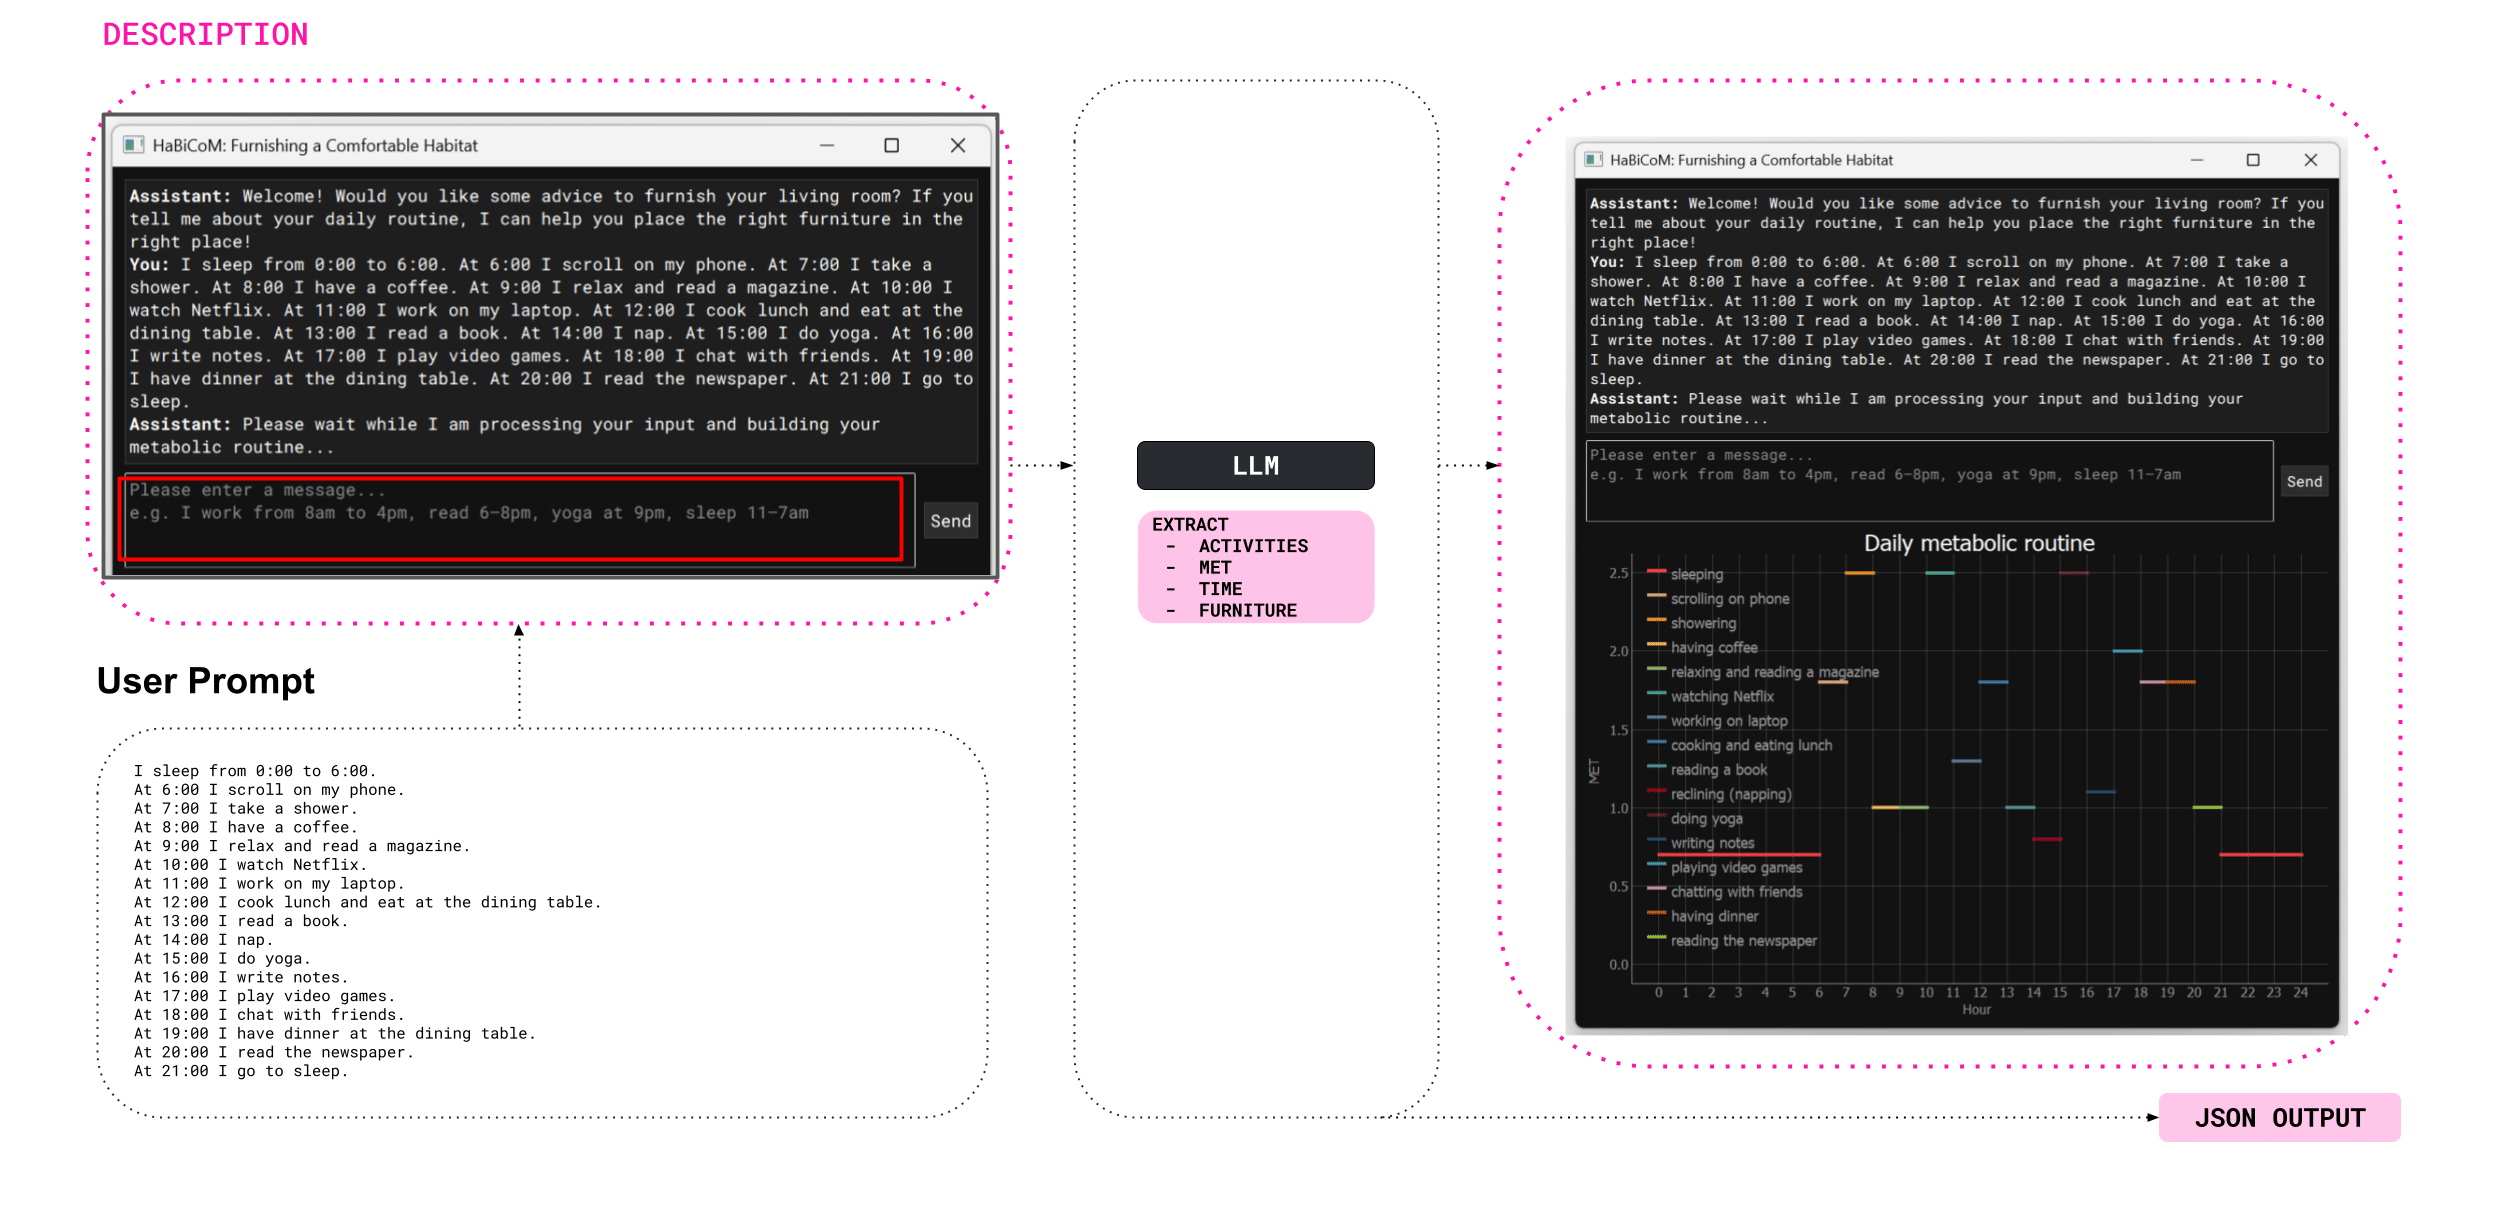
The HaBiCoM process begins with the user submitting their daily routine and preferences through a simple, intuitive interface. This natural language input is then processed to extract key details such as activity type and timing.
A large language model (LLM) enhances this data by associating each activity with a corresponding metabolic rate and relevant furniture. The information is then structured into a machine-readable JSON format for further analysis.
Next, the user either imports or generates their apartment layout within Rhino + Grasshopper. HaBiCoM accesses a curated database of spatial graphs collections of apartment plans encoded with room dimensions and furniture relationships. This allows the system to identify and decode the most suitable configuration for the user’s space.
A machine learning model then predicts thermal comfort across the layout, generating a heatmap that aligns each activity with the most thermally comfortable location.
The final output is a visualized, optimized furniture layout personalized to match both the user’s lifestyle and thermal comfort needs.
USER INTERFACE
The user begins by entering their daily routine in natural language through the HaBiCoM copilot interface. The system’s large language model (LLM) processes this input to extract key information such as activities, timing, and estimated metabolic rates. This data is then visualized as a daily metabolic profile, forming the foundation for thermal comfort analysis.
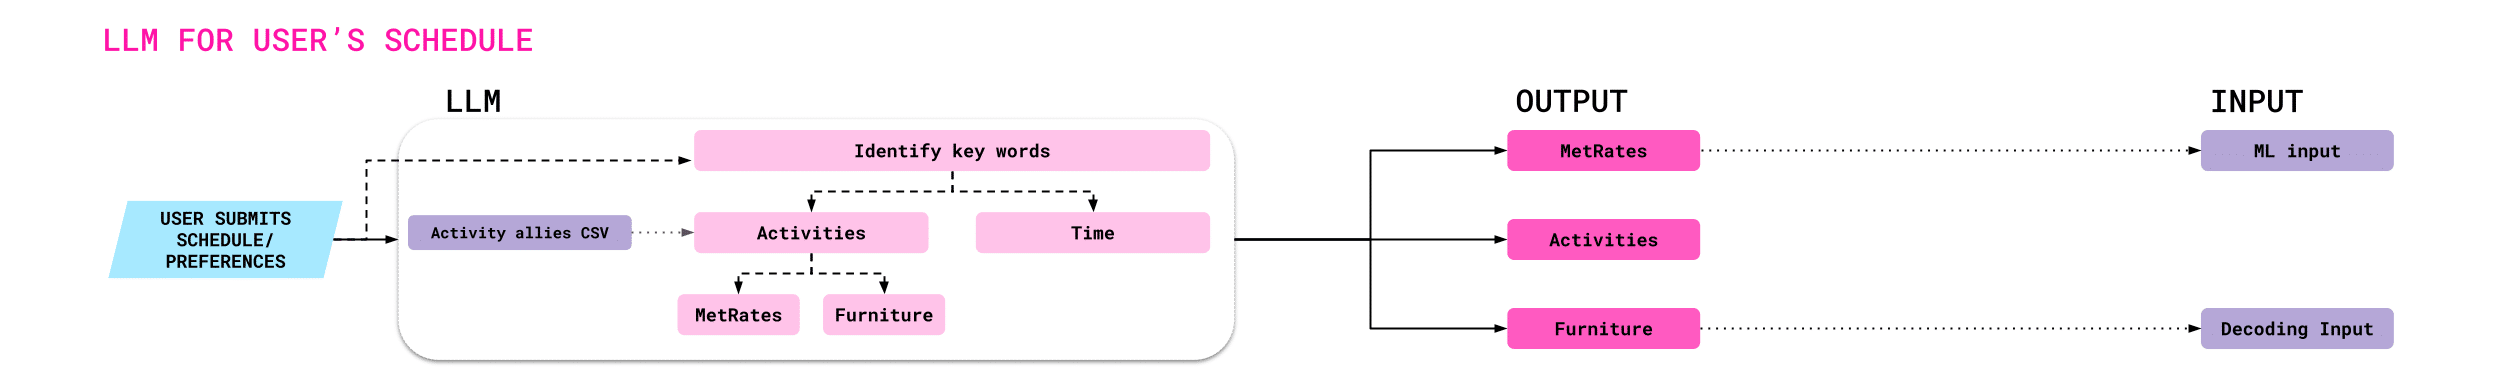
LLM
The LLM (Large Language Model) takes the user’s natural language schedule and extracts key information such as activities, timing, and associated furniture. To improve accuracy, it references an internal activity alias CSV for better recognition of routines. Based on each activity, the system estimates the user’s metabolic rate and organizes all outputs—metabolic data, timing, and furniture—into a structured JSON file. This file maps out the user’s routine hour by hour and prepares the data for environmental and comfort analysis.
THERMAL COMFORT PREDICTION
METHODOLOGY
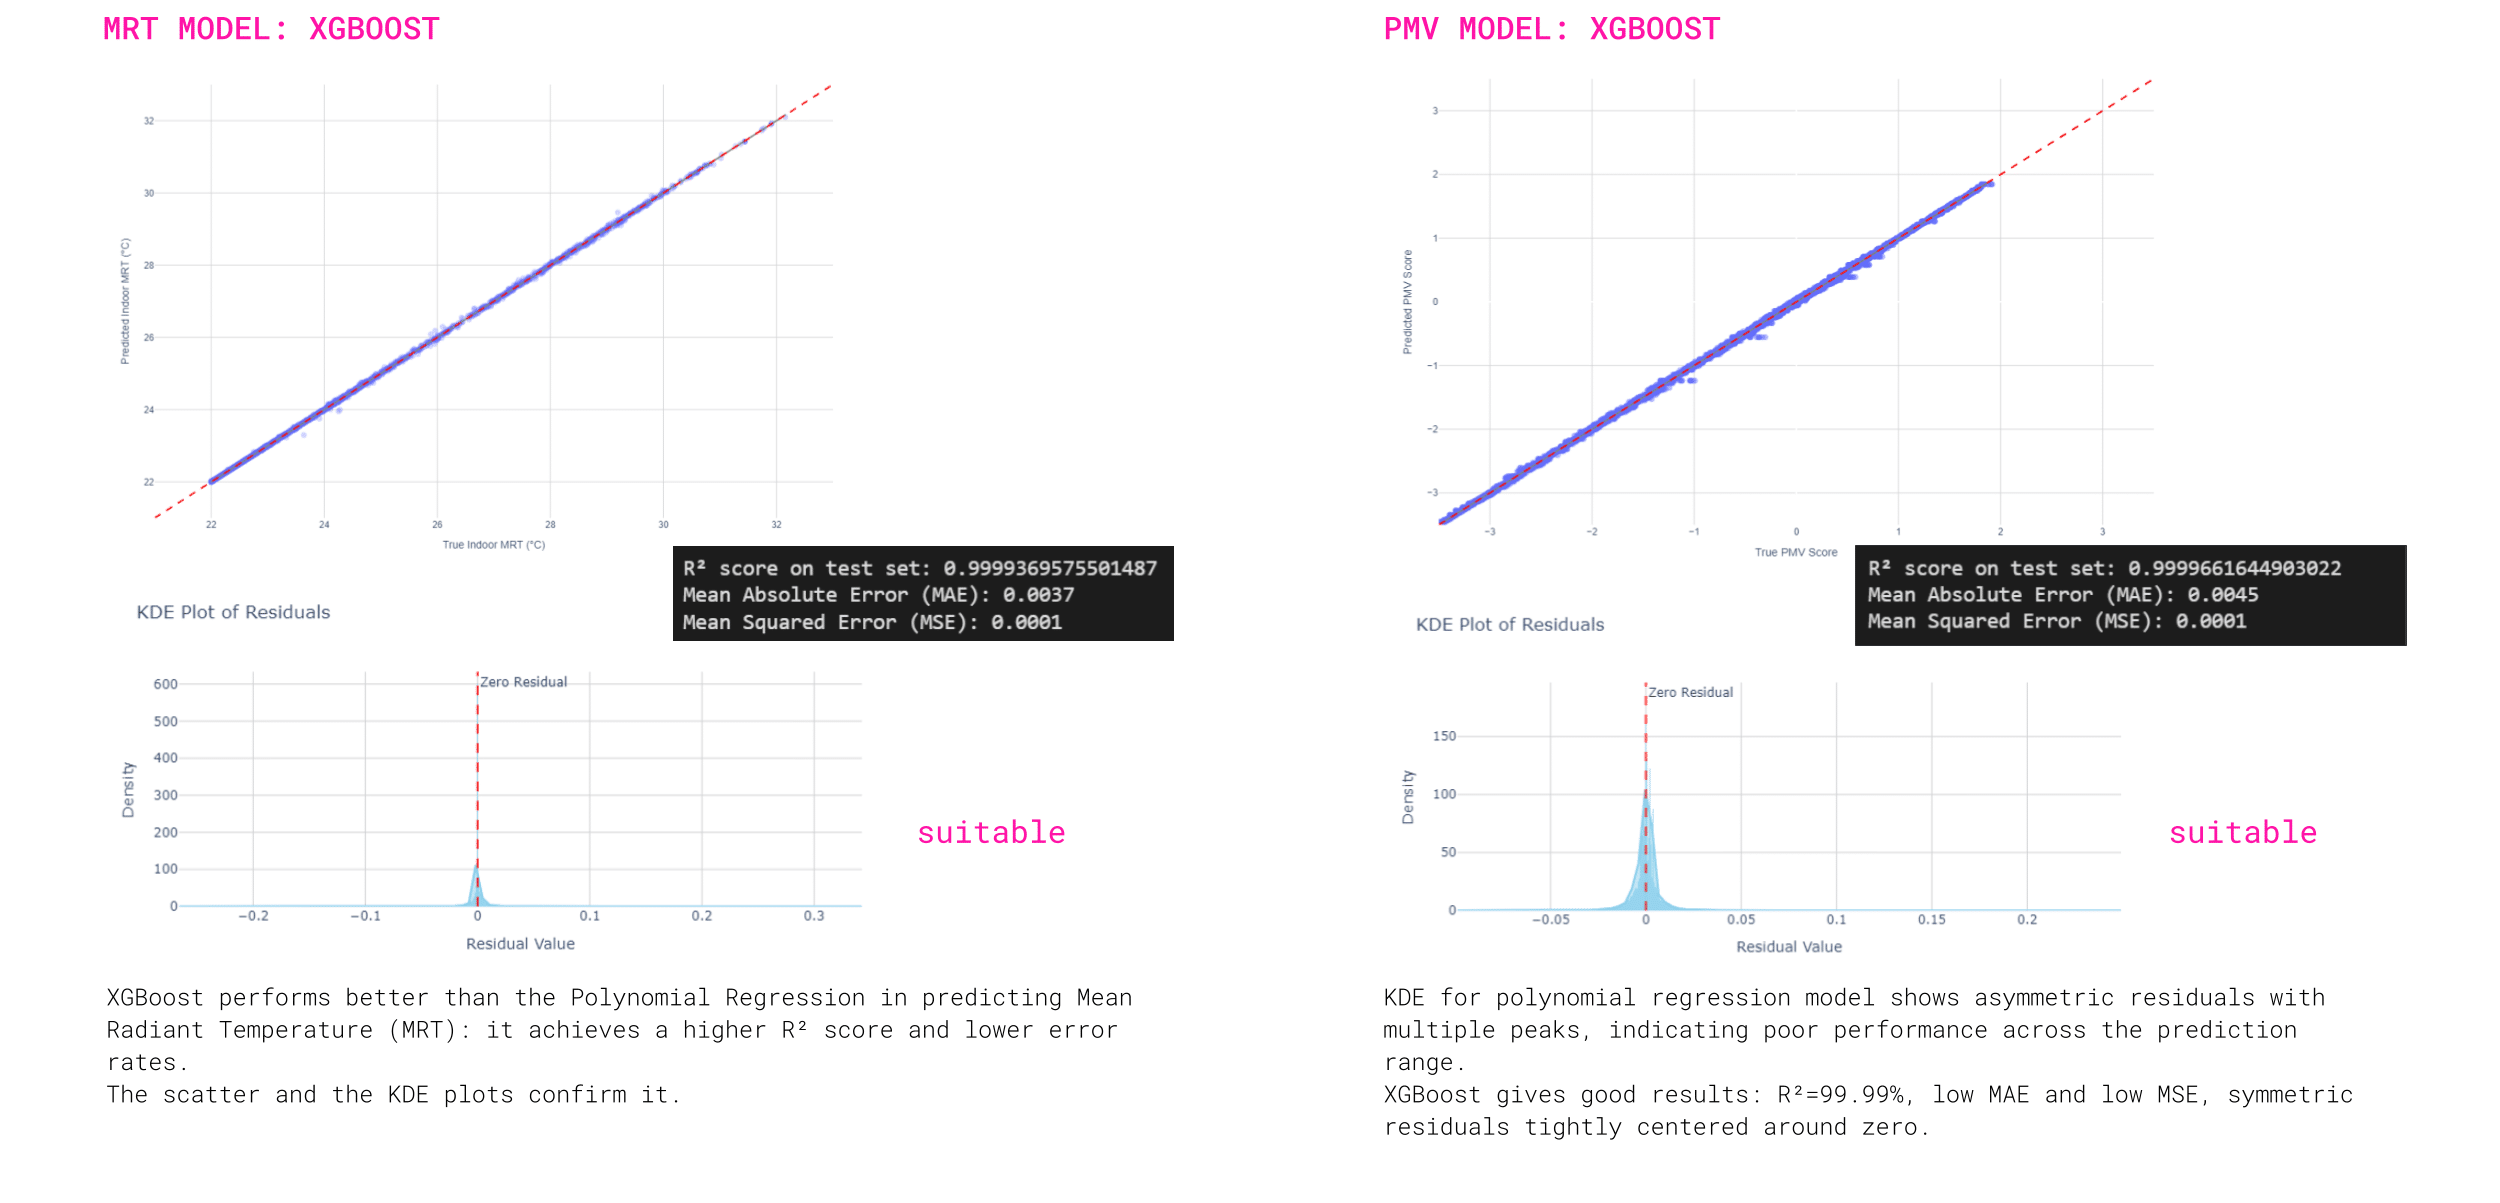
To enable real-time simulations, we replaced slow traditional environmental analysis with a machine learning model trained to predict thermal comfort using the Predictive Mean Vote (PMV) index, following the Ladybug workflow. Since PMV relies on complex variables like Mean Radiant Temperature (MRT) and the human-to-sky view factor, we developed a second predictive model specifically for MRT and integrated it into the PMV model. While most variables are now predicted instantly, the human-to-sky relation still requires a few seconds of computation, as it remains difficult to encode accurately.
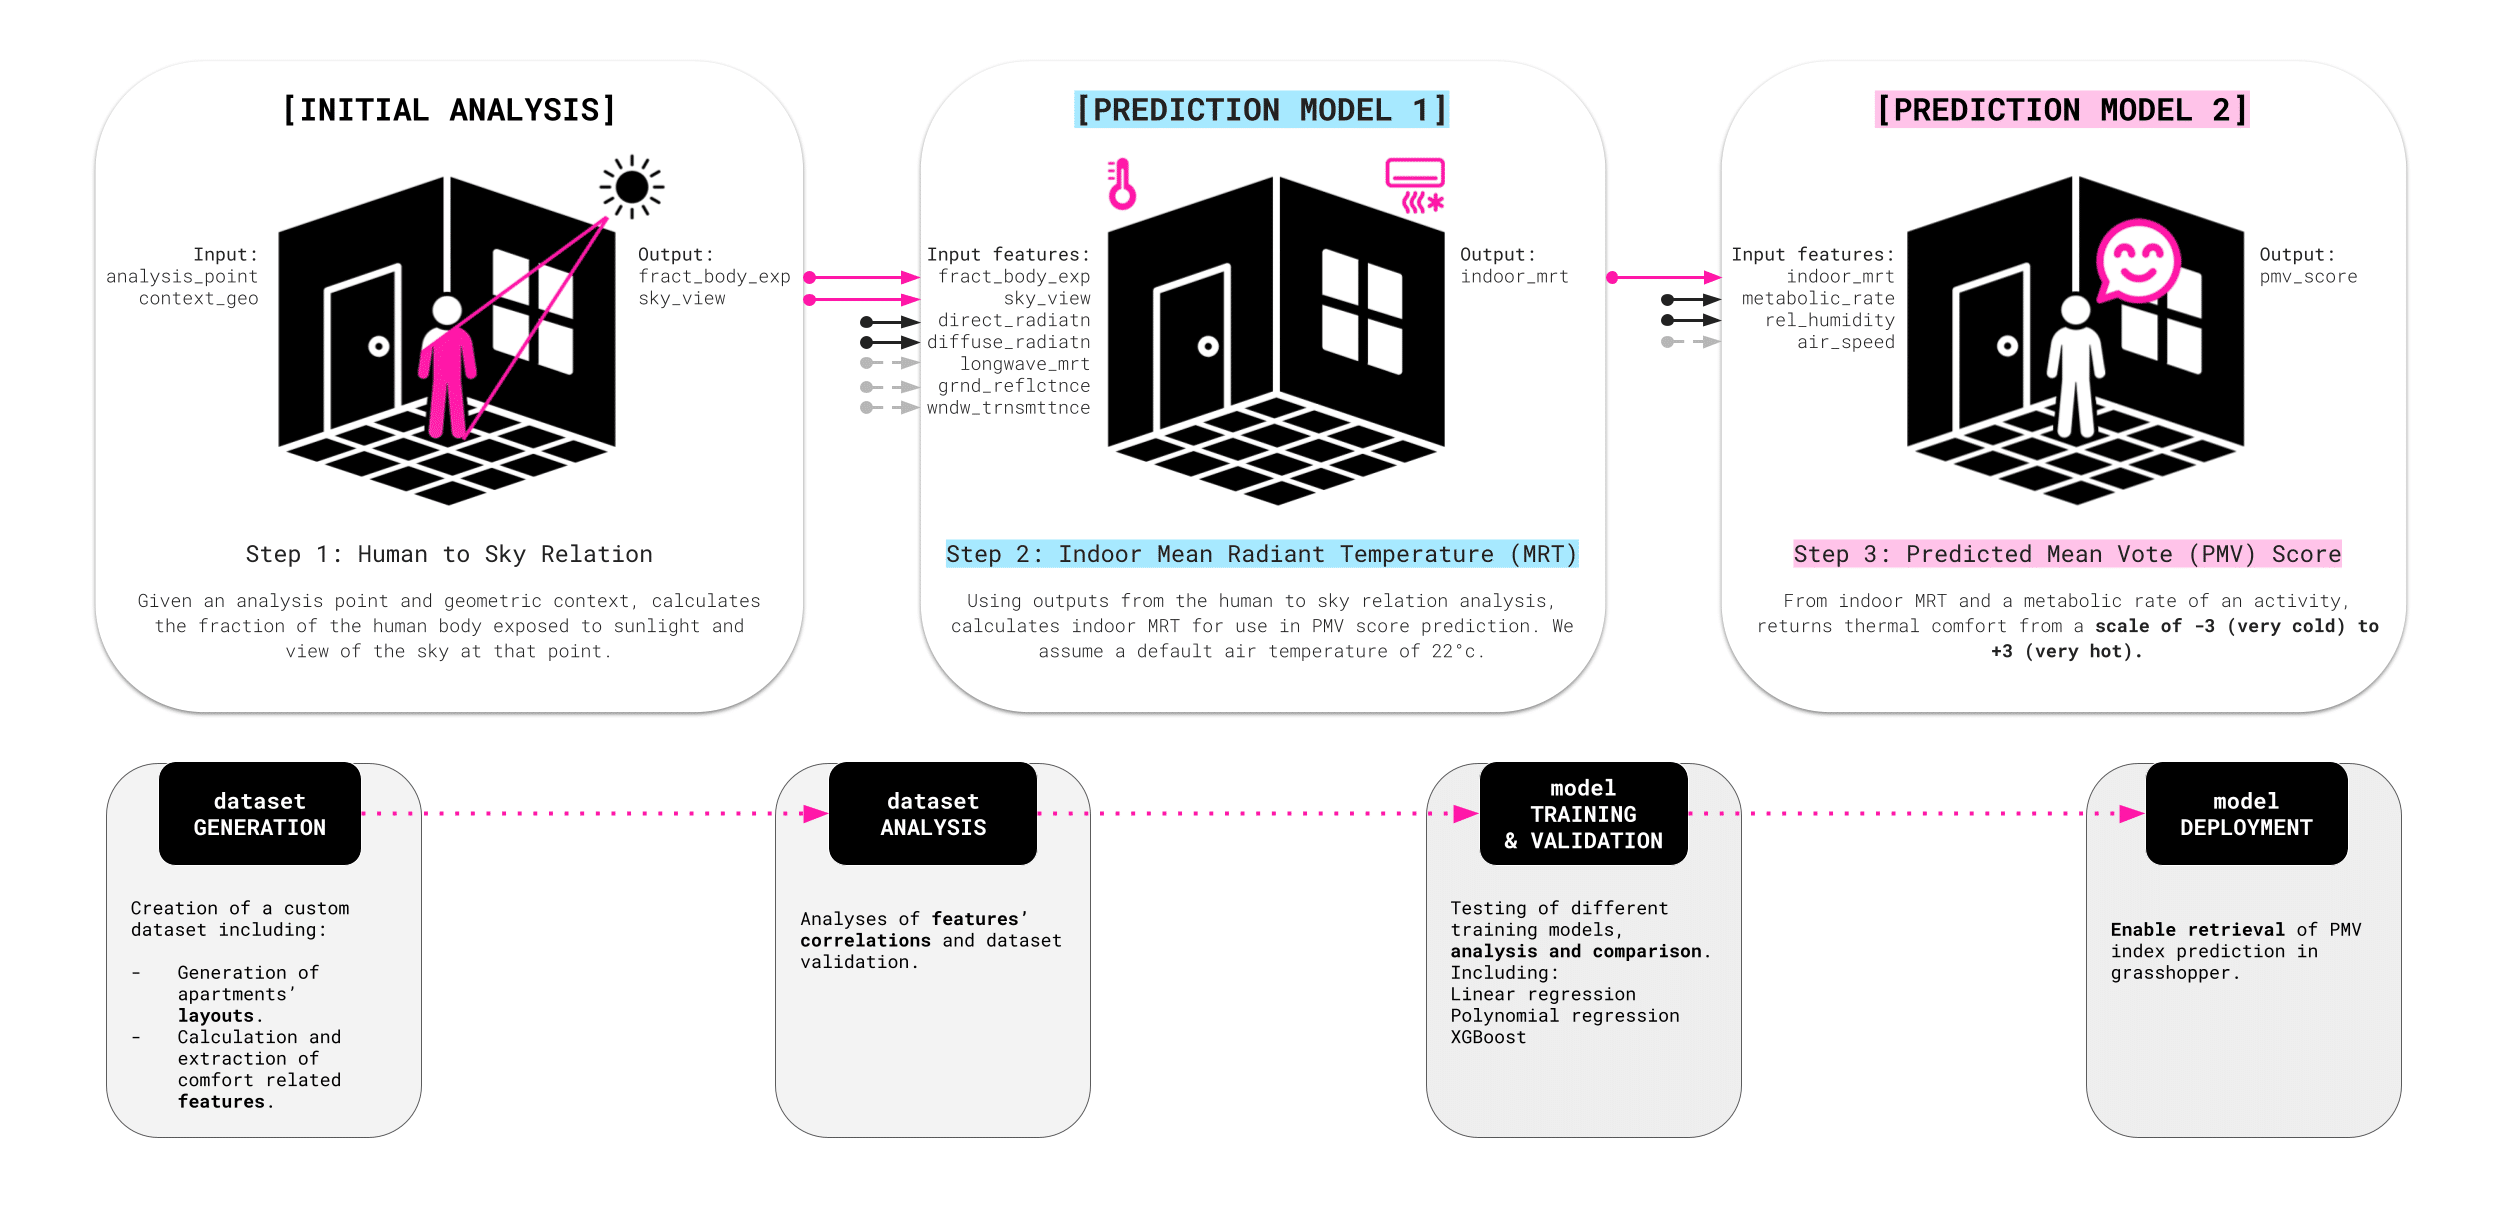
DATASET GENERATION
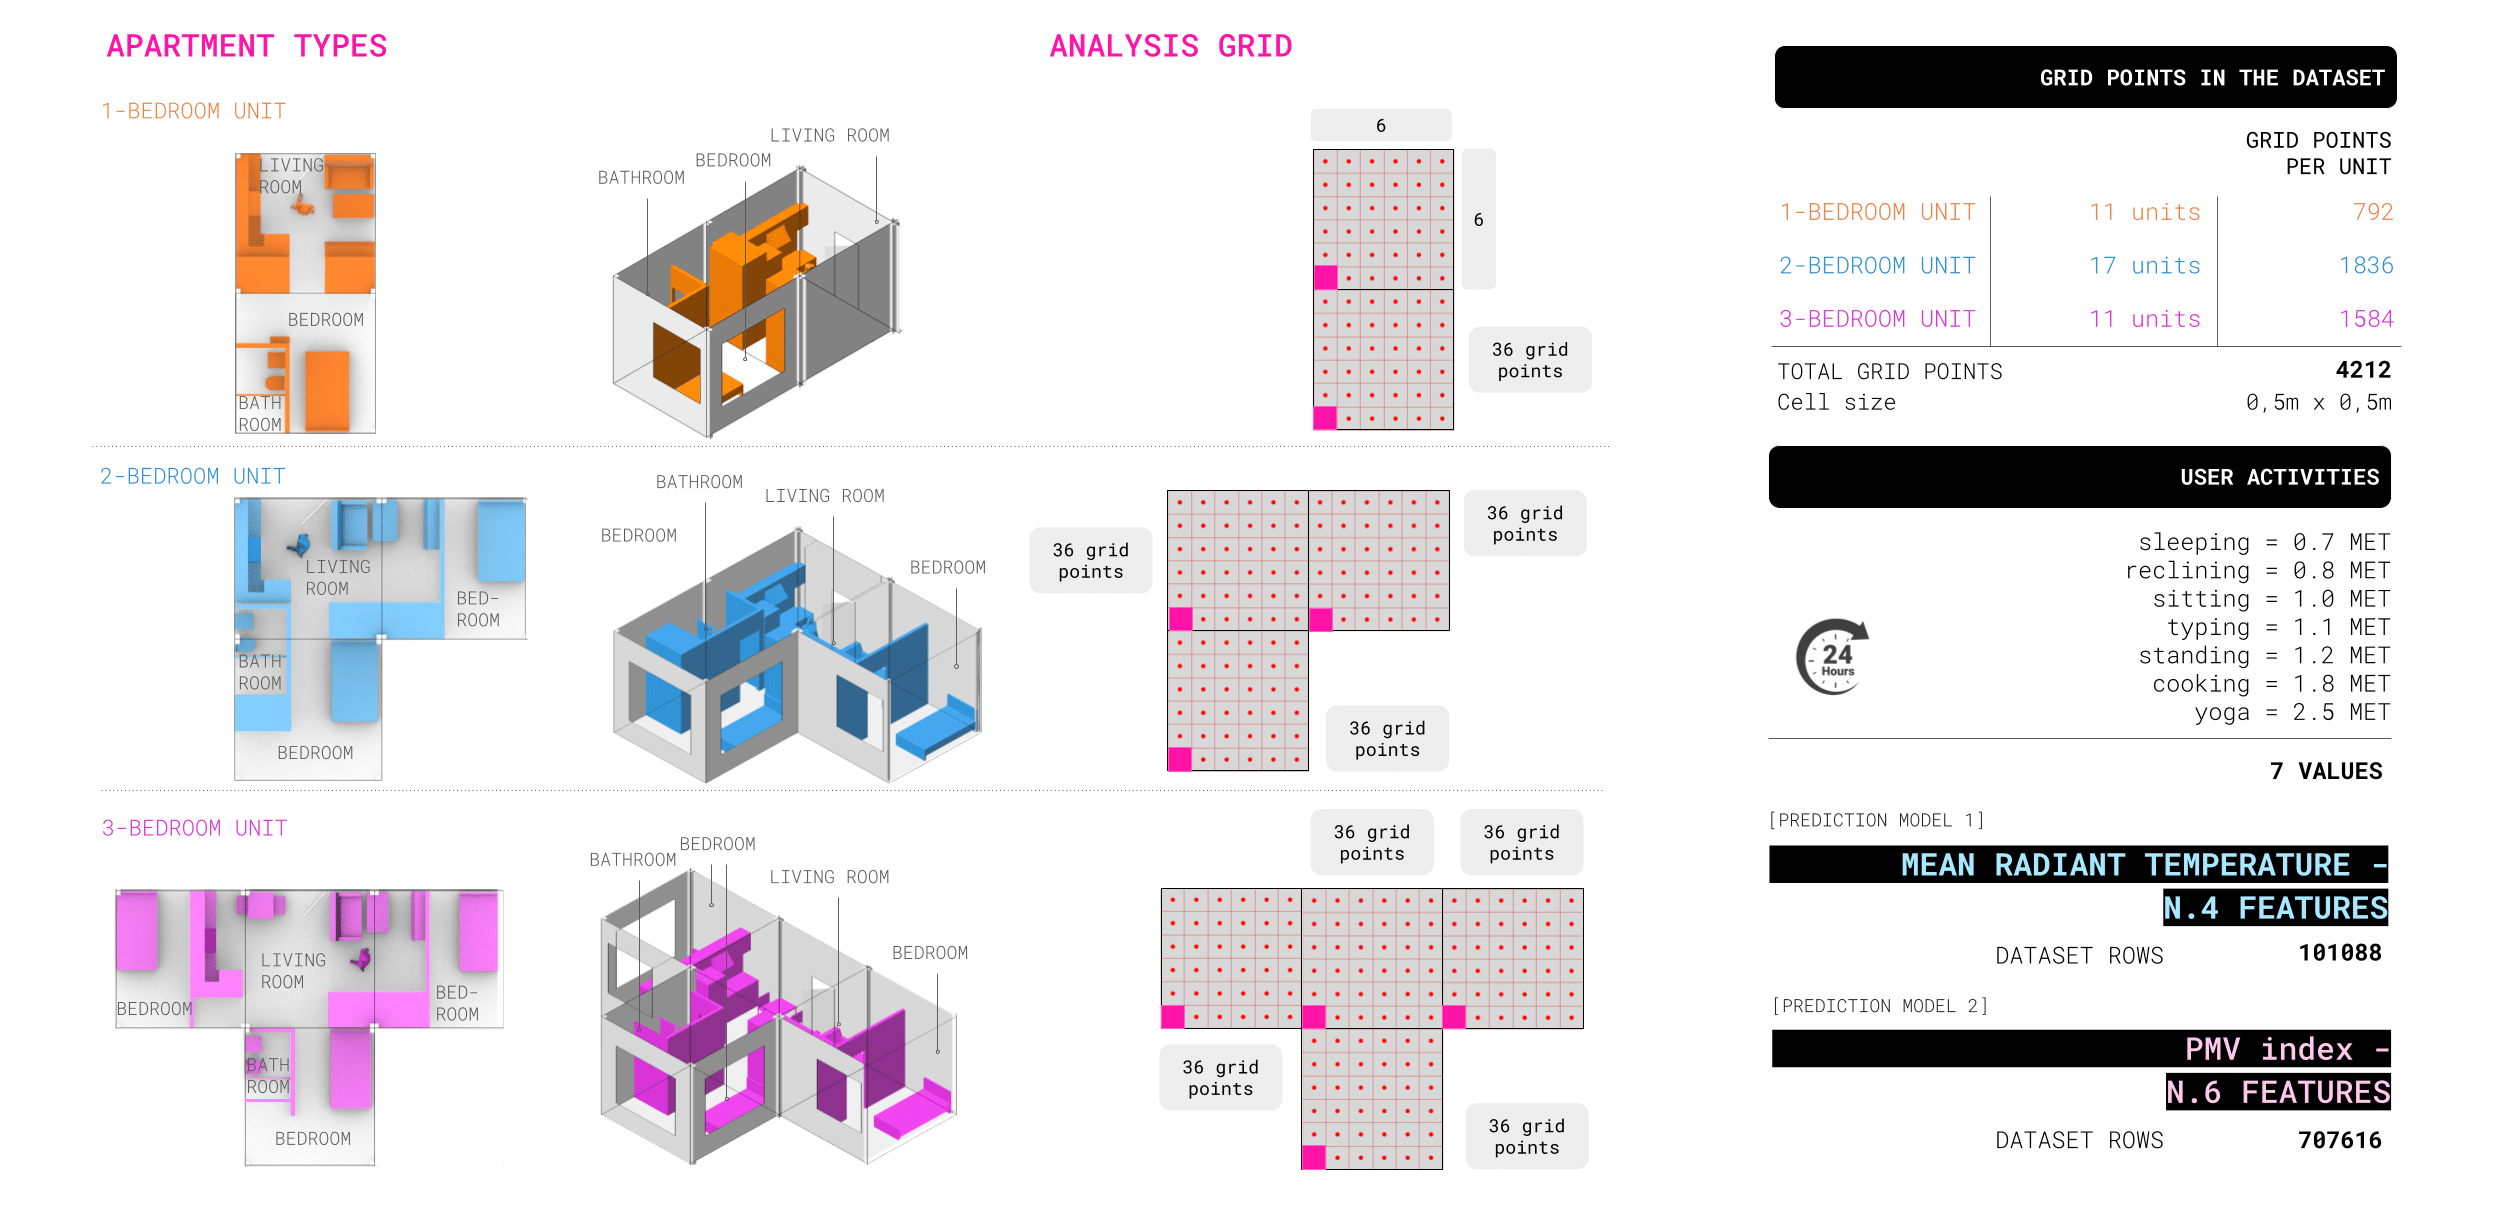
To train our MRT and PMV models, we used the Common Building Dataset Generator, analyzing over 4,000 grid points across a full 24-hour cycle and 7 different metabolic rates linked to user activities. This process resulted in a comprehensive dataset of more than 700,000 rows.
Initially, we also intended to use this tool for encoding and decoding furniture layouts. However, the internal space dimensions of the generated models were too constrained to capture the spatial variation required for our placement logic.
MODEL TRAINING
The surrogate MRT and PMV models achieved high performance, thanks to a large and diverse training dataset. An XGBoost algorithm was used to capture nonlinear feature relationships, and the model demonstrated strong accuracy with no signs of overfitting or underfitting confirmed by residual plots tightly clustered around zero.
ACTIVITY GRIDS
Once deployed, the model can instantly predict thermal comfort for any activity based on the user’s metabolic rate. For example, the visualization below shows PMV index predictions across a typical 3-bedroom apartment over the course of a day, in 2-hour intervals, for three different activities: standing, cooking, and doing yoga.
The top row displays the PMV scores, while the bottom grid uses a relative color scale—green indicating the most comfortable zones and red highlighting the least suitable areas for each activity within the apartment layout.
GRAPHML
GRAPH LOOKUP
aa
Using PlanFinder, a relational database of approximately 680 apartment floor plans was created to support nearest-neighbor searches. This enables quick matching between a user’s input dimensions and similar existing layouts. By encoding and decoding spatial elements with precision, the system can generate fully furnished floorplans in real time based on the closest spatial match.
PLAN LAYOUT GENERATION
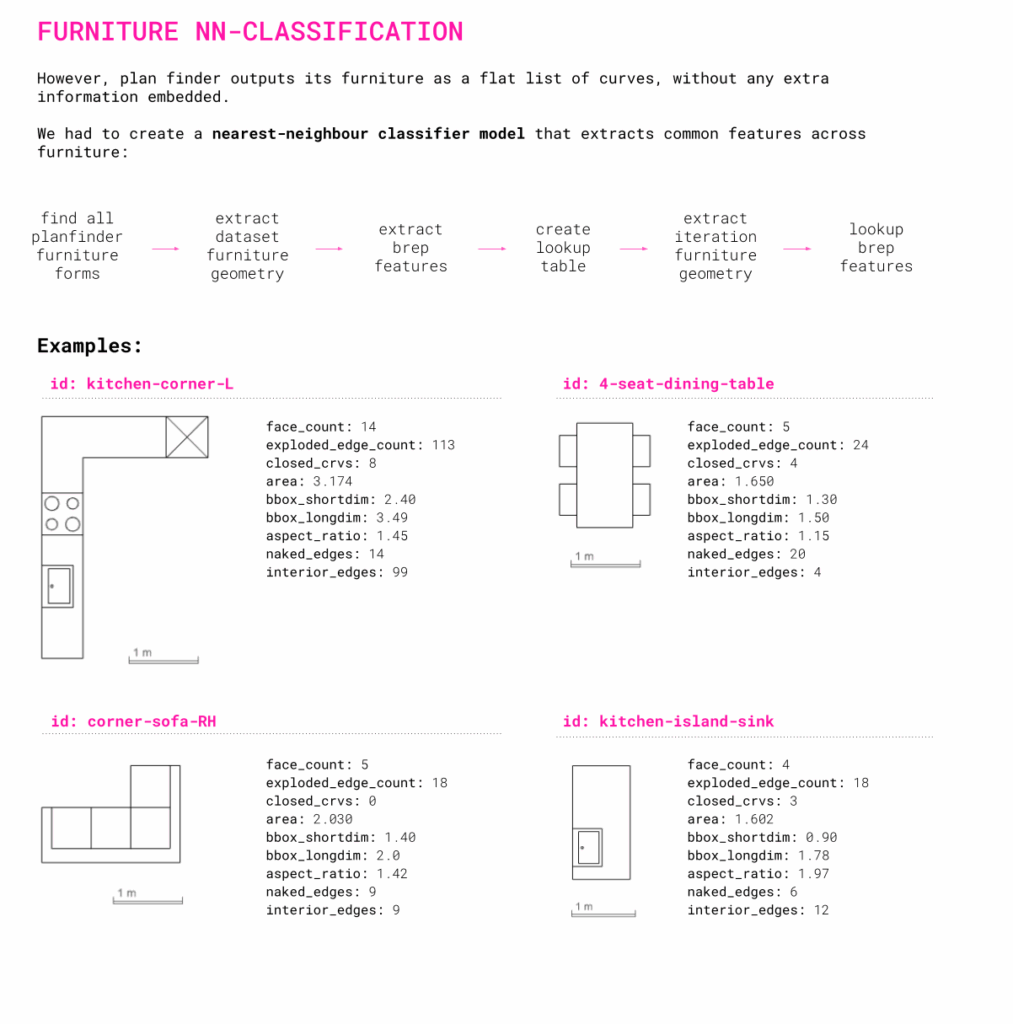
The PlanFinder workflow presented a challenge, as furniture was exported as a flat list of curves without embedded metadata. To resolve this, consistent anchor points such as windows, doors, and kitchen walls were used as spatial references. Touching furniture breps were grouped and encoded using geometric features like face count, bounding box dimensions, and aspect ratio. With this approach, a nearest-neighbor classifier can now efficiently identify and classify furniture elements for downstream semantic reasoning.
GRAPH DATA FROM LAYOUTS
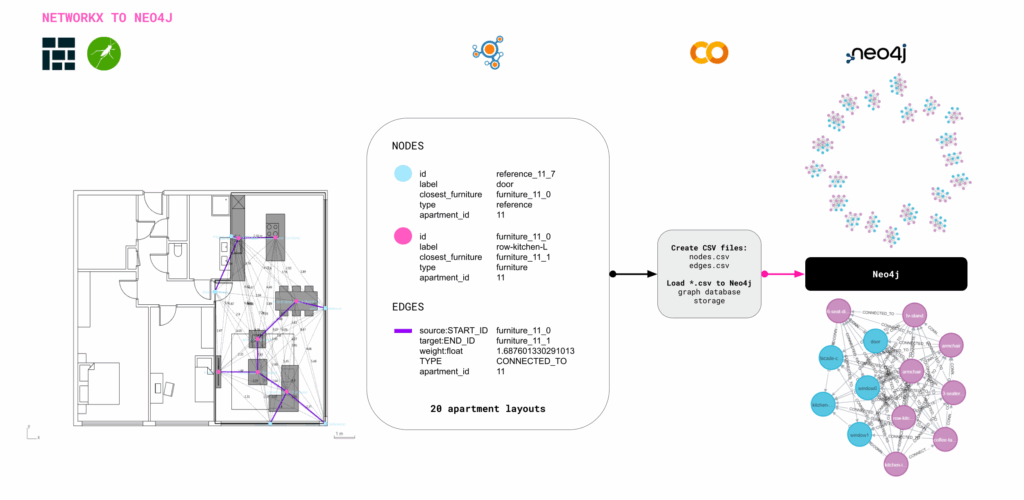
Several methods were tested for encoding and decoding apartment layouts. A key strategy involved generating a NetworkX graph for each furniture configuration, with nodes, edges, and distance-based weights exported as CSV files and imported into Neo4j for spatial reasoning. Starting from consistent reference nodes such as windows or doors the system aimed to sequentially place furniture items by expanding the graph toward areas of optimal thermal comfort, progressively completing the apartment layout.
GRAPH DECODING TRIALS USING NEO4J
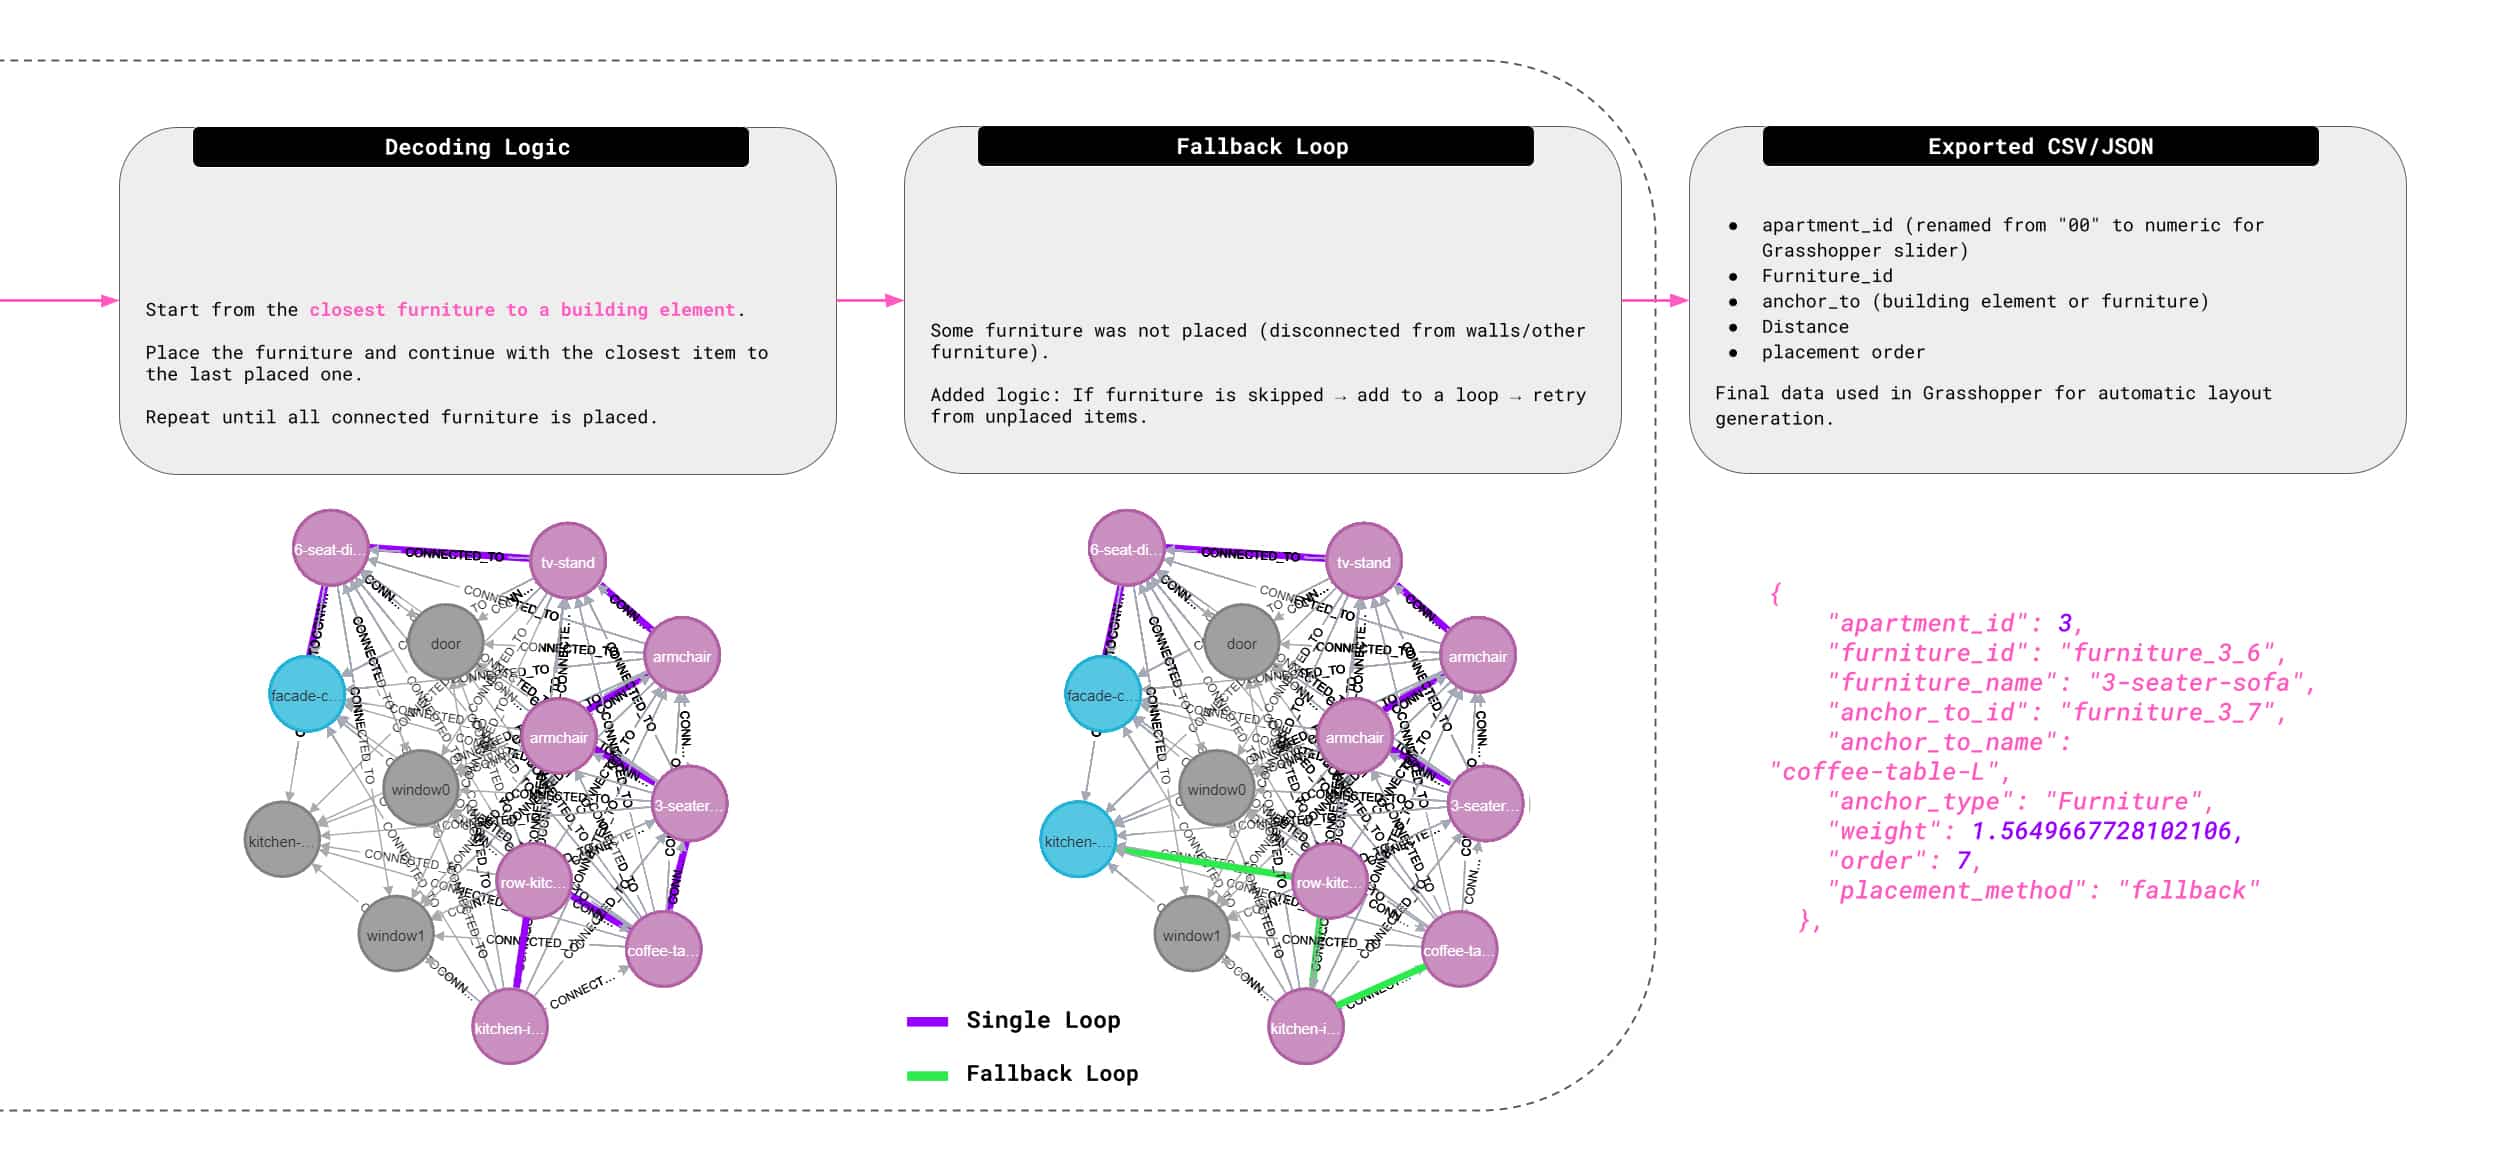
This approach ultimately proved ineffective due to a lack of semantic depth between nodes. Relationships were based solely on proximity, without encoding functional dependencies such as coffee tables typically being placed near sofas, which in turn face TV stands. As a result, the graphs became disjointed and lacked meaningful spatial logic. While fallback logic was introduced to recover the workflow, it was not sufficient to produce consistent or reliable results.
GEOMETRY DECODING
A more effective approach involved using the previously established graph lookup method. For each input apartment, the system queried the spatial graph database to retrieve furniture arrangements from the closest matching layout. Because furniture nodes and their bounding boxes were normalized, it became possible to accurately reconstruct furniture positions and seamlessly map geometry back into the new apartment configuration.
With the apartment layout in place, the LLM decodes the user’s input schedule to identify which activities occur in the space and when. This time-activity data is then passed into the PMV surrogate model, which calculates thermal comfort levels for each activity throughout the day. The results are visualized as a comfort grid, showing where and when each activity can be performed most comfortably within the apartment.
For each activity in the user’s schedule, the LLM also identifies the required furniture. The copilot then attempts to match these items to existing furniture in the apartment layout. If a match is found, it suggests a directional adjustment to improve thermal comfort. If the item is missing, the system visualizes the ideal placement as a vertically dropped placeholder, indicating where it should be added for optimal performance.
LIMITATIONS
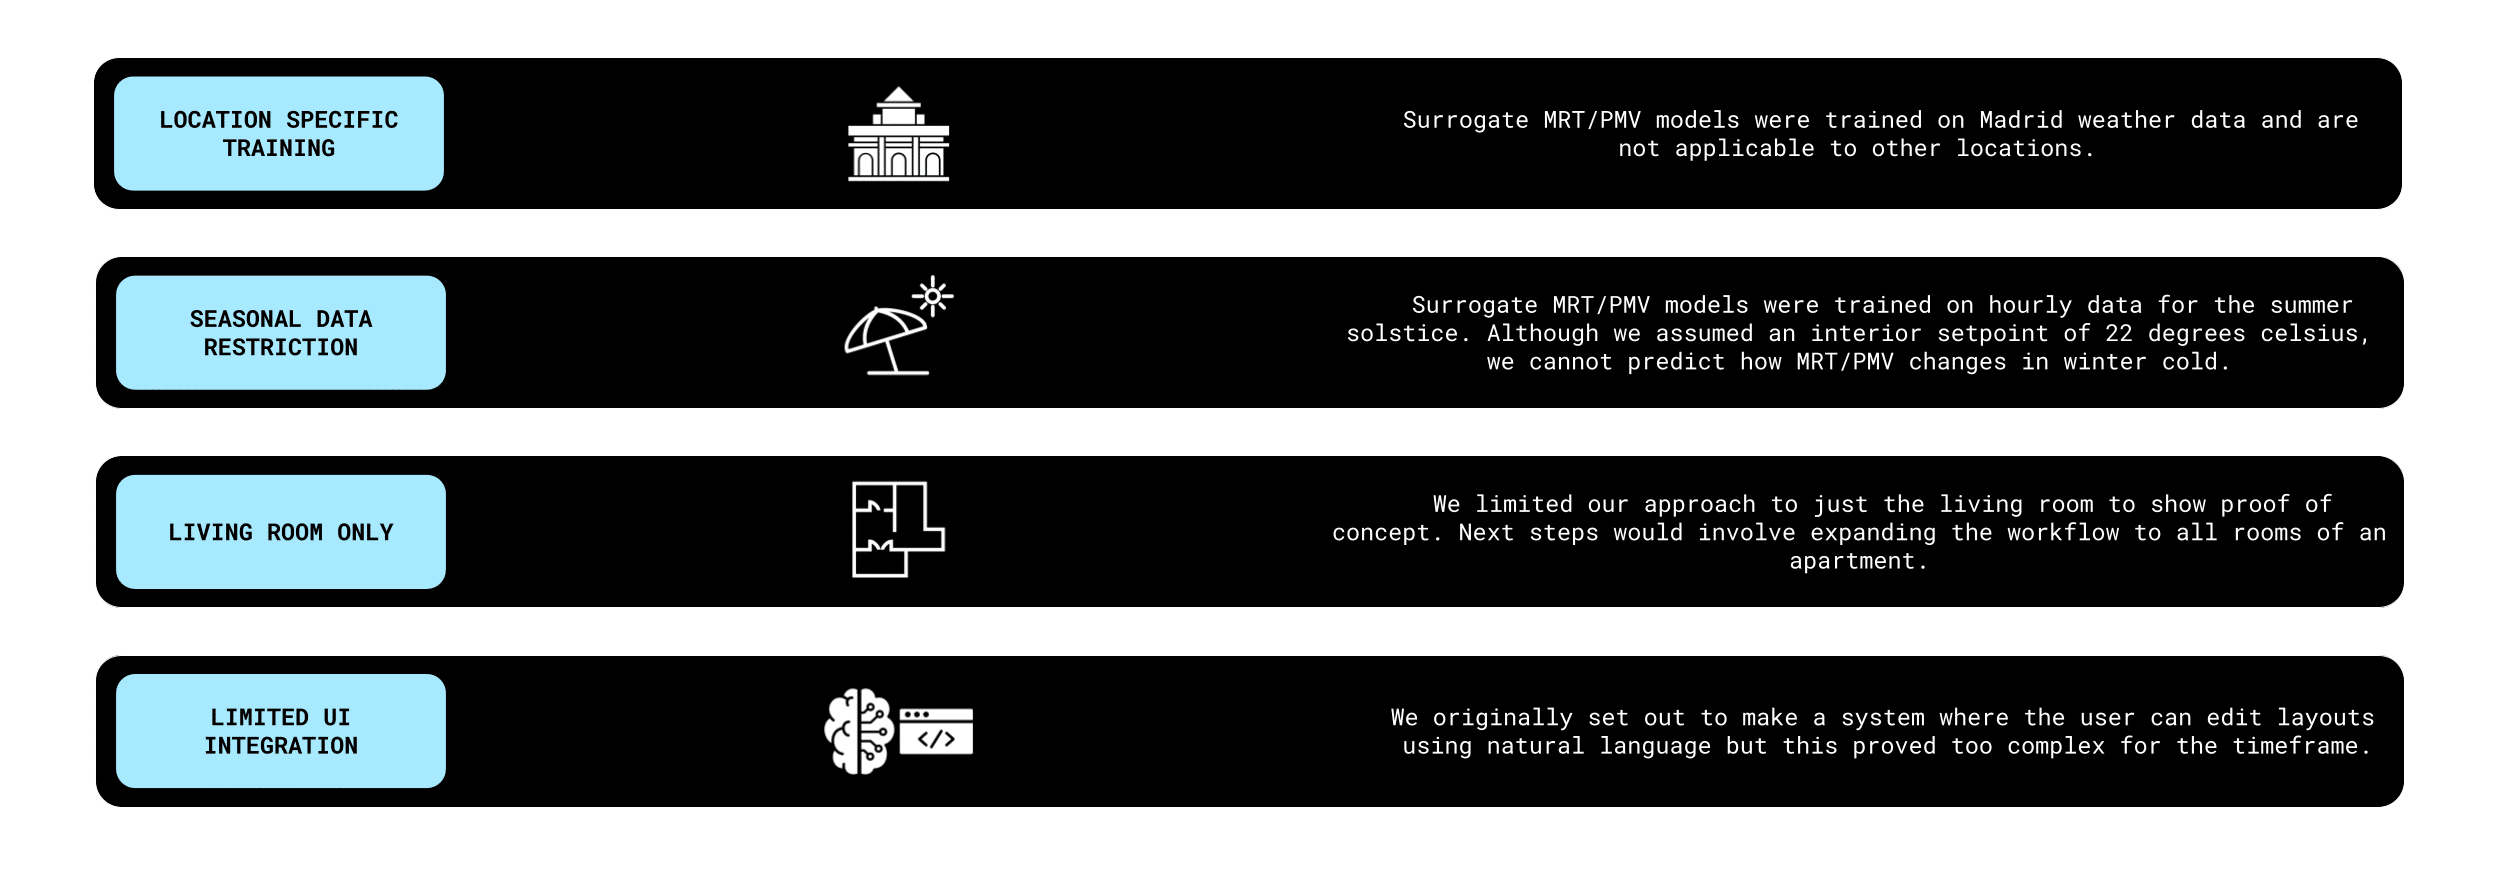
As a proof of concept, the HaBiCoM copilot comes with several limitations:
- Climate Scope: The surrogate models were trained using hourly summer solstice data for Madrid, making the predictions less applicable to other climates or seasons.
- Spatial Scope: The system currently focuses only on living rooms. Expansion to other rooms was planned but could not be completed within the available timeframe.
- Comfort Criteria: The current model evaluates only thermal comfort. The original vision included a more holistic comfort score incorporating factors like luminous comfort, glare risk, spatial daylight autonomy, and sky view.
- LLM Integration: Full natural language control for furniture editing was part of the intended functionality, but this milestone was not achieved due to time constraints.
NEXT STEPS
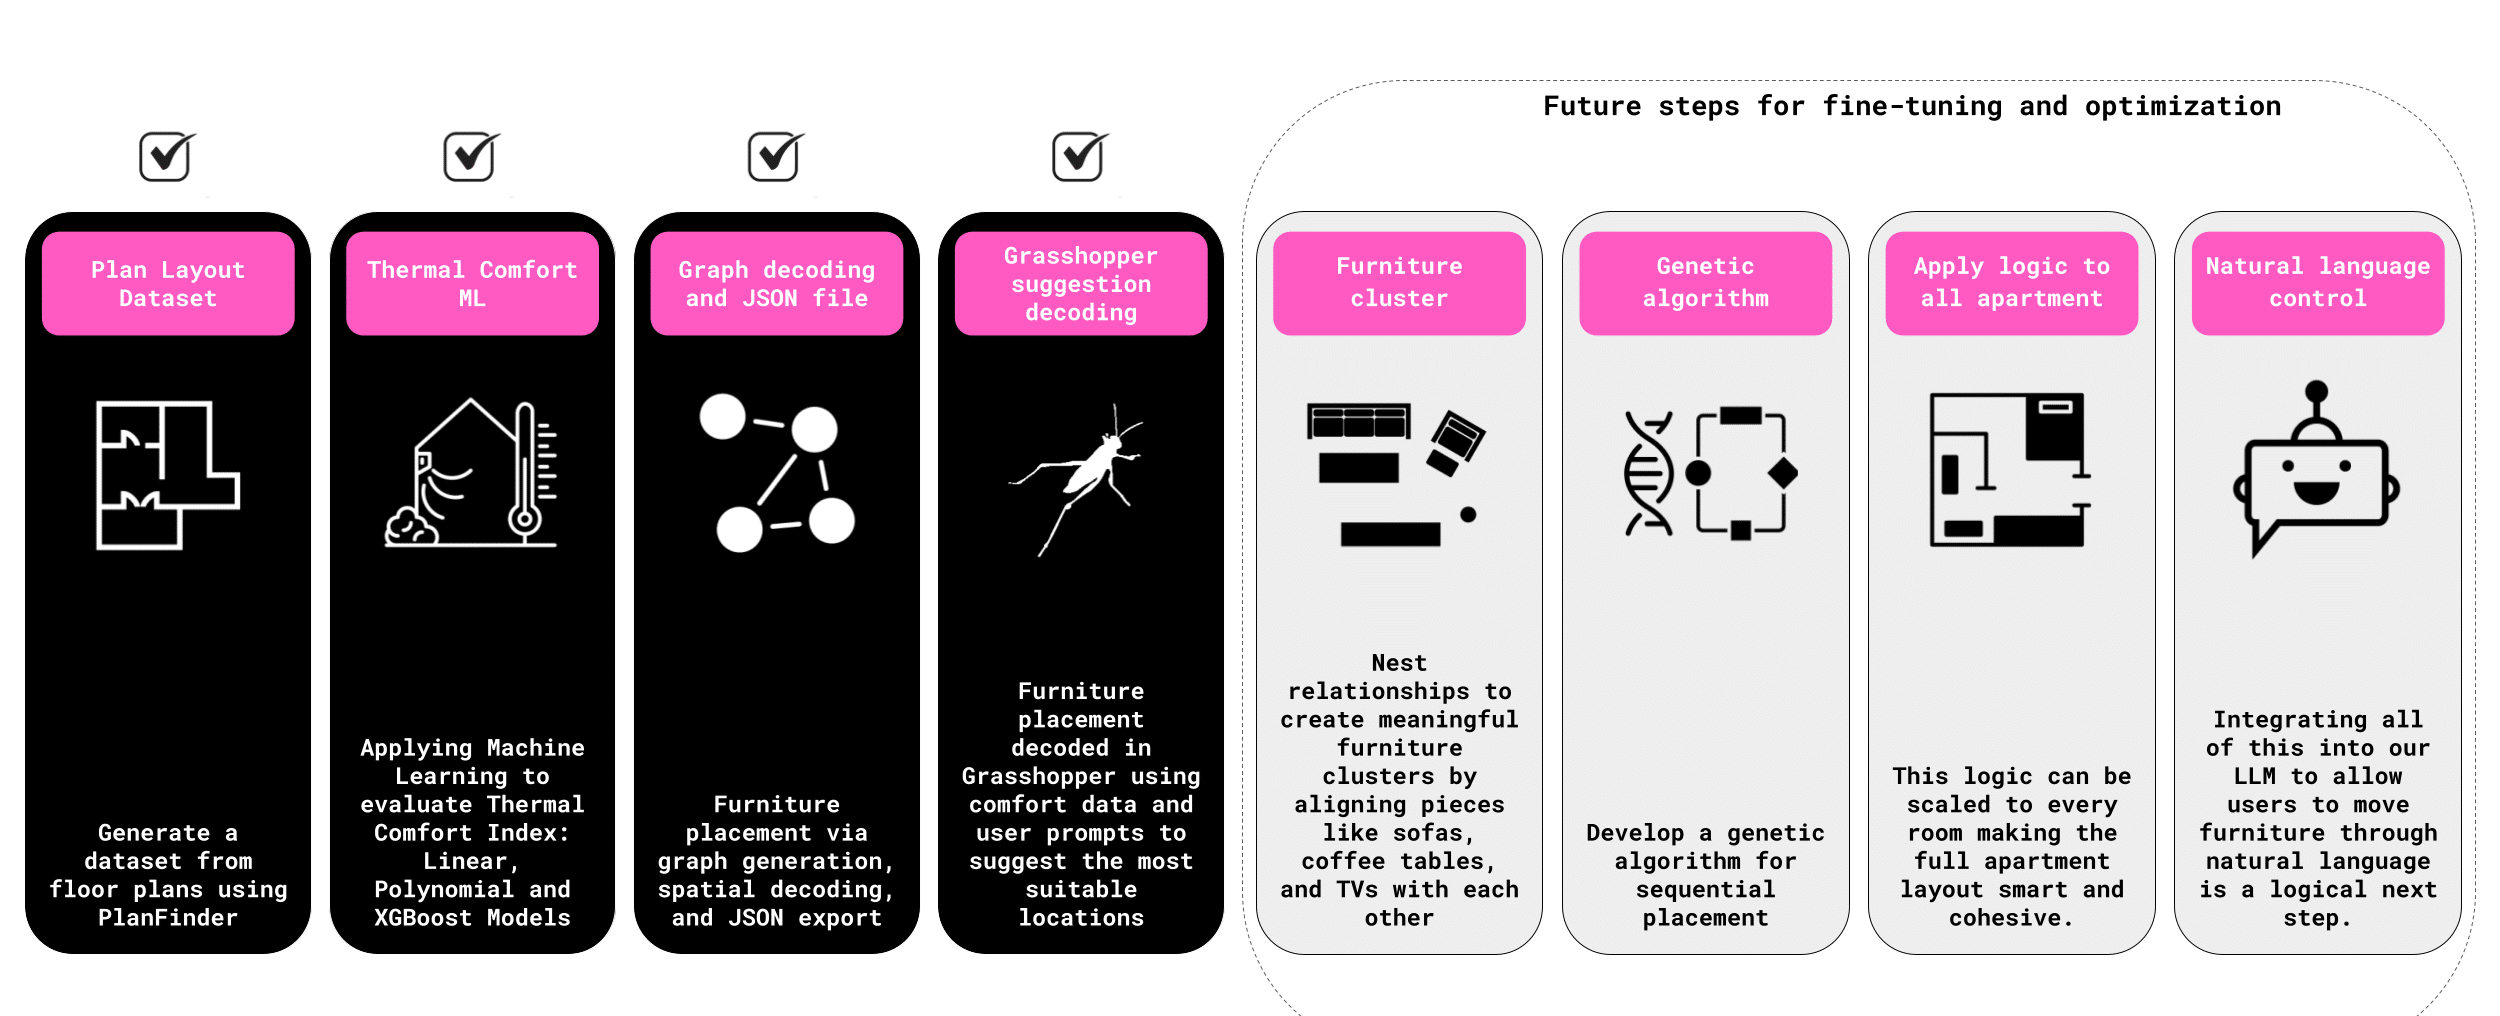
This proof-of-concept journey involved exploring multiple design strategies, learning through iteration, and identifying clear paths for refinement. So far, the system has:
- Generated a dataset of apartment layouts
- Applied machine learning models to predict thermal comfort
- Built graph-based relationships between furniture and space
- Decoded these into JSON files and integrated them into Grasshopper for comfort-driven furniture suggestions
Looking ahead, several key improvements are planned:
- Nested furniture relationships to enable meaningful clustering
- A genetic algorithm to manage sequential furniture placement across all rooms
- Enhanced LLM capabilities, allowing users to move or edit furniture via natural language
- Expansion from thermal comfort to a multi-dimensional comfort score, incorporating factors like light, view, and spatial quality
HaBiCoM aims to evolve into a robust AI copilot that seamlessly aligns interior design with user routines and environmental intelligence.
