
The building
The Narkomfin Building was completed in 1930 in Moscow, designed by Moisei Ginzburg and Ignaty Milinis. It is one of the most recognized examples of Soviet Constructivist housing — a dom-kommuna, or communal house. The design was deliberately unconventional: kitchens were minimal because residents were expected to eat in a shared canteen, and living rooms doubled as social space. Ginzburg called these units social condensers — architecture meant to reshape how people live together.
The building has 54 units across 6 floors, organized into two main apartment types:
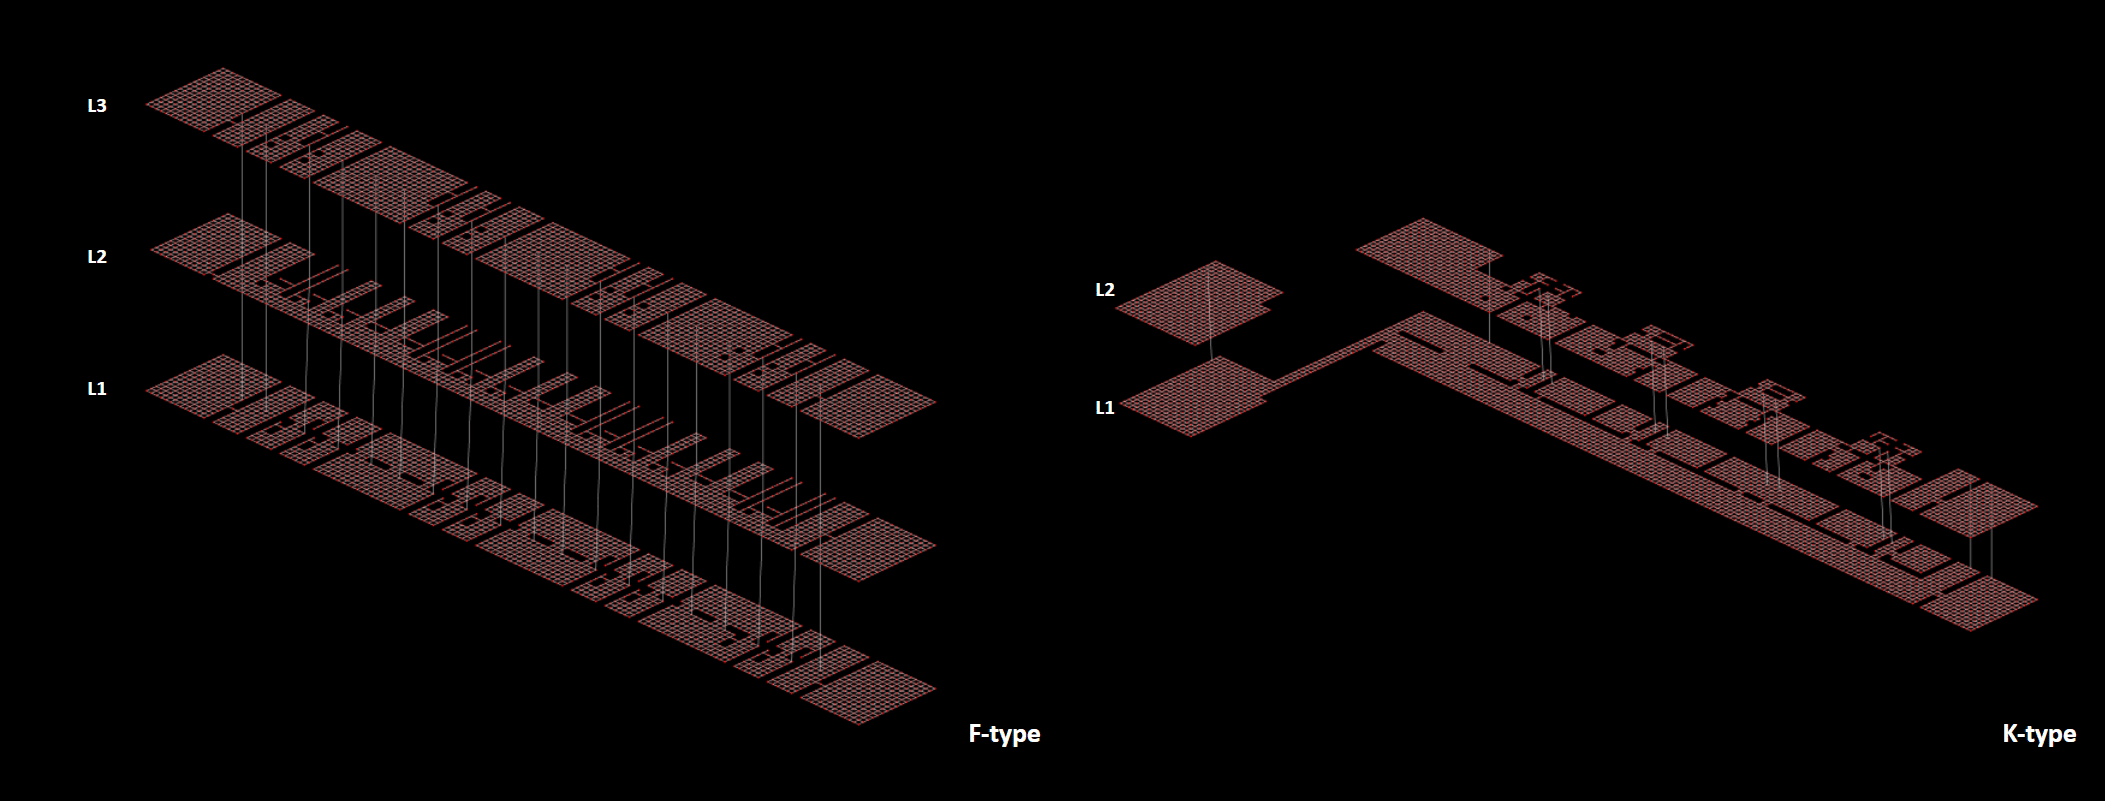
- Type K — a two-storey duplex for families. A continuous corridor runs along the bottom floor (L1), with eleven fragmented rooms above (L2), connected by twelve staircases.
- Type F — a three-storey unit for singles. The corridor sits on the middle floor (L2), with rooms both below (L1) and above (L3), connected by nineteen staircases.
From floor plan to graph
We rebuilt both apartment types in Rhino and exported each as an OBJ file — one for Type K (two floors + stairs), one for Type F (three floors + stairs). The challenge was turning these into graphs that could run spatial metrics across multiple floors.
We used grid sampling: overlay a regular grid (0.5-unit spacing) on each floor, test which points fall inside the floor boundaries using ray-casting, then connect neighboring points with edges to form a graph. Floors are stitched together with stair edges — each staircase creates a vertical connection between the grid cells at its landing on each floor.
We tried grid resolutions of 1.0, 0.5, and 0.2. The finest resolution looked best but was too slow to run, so we settled on 0.5 as the working resolution. The tradeoff is that grid cells don’t conform to the room boundaries — but the graph still captures the topology accurately.
The two graphs immediately show the structural difference. Type K is asymmetric — one dense floor, one fragmented. Type F is symmetric — sparse, dense, sparse. Both organize around a single corridor spine, but the corridor sits at the base in K and in the middle in F.
Closeness centrality — where is the most accessible point?
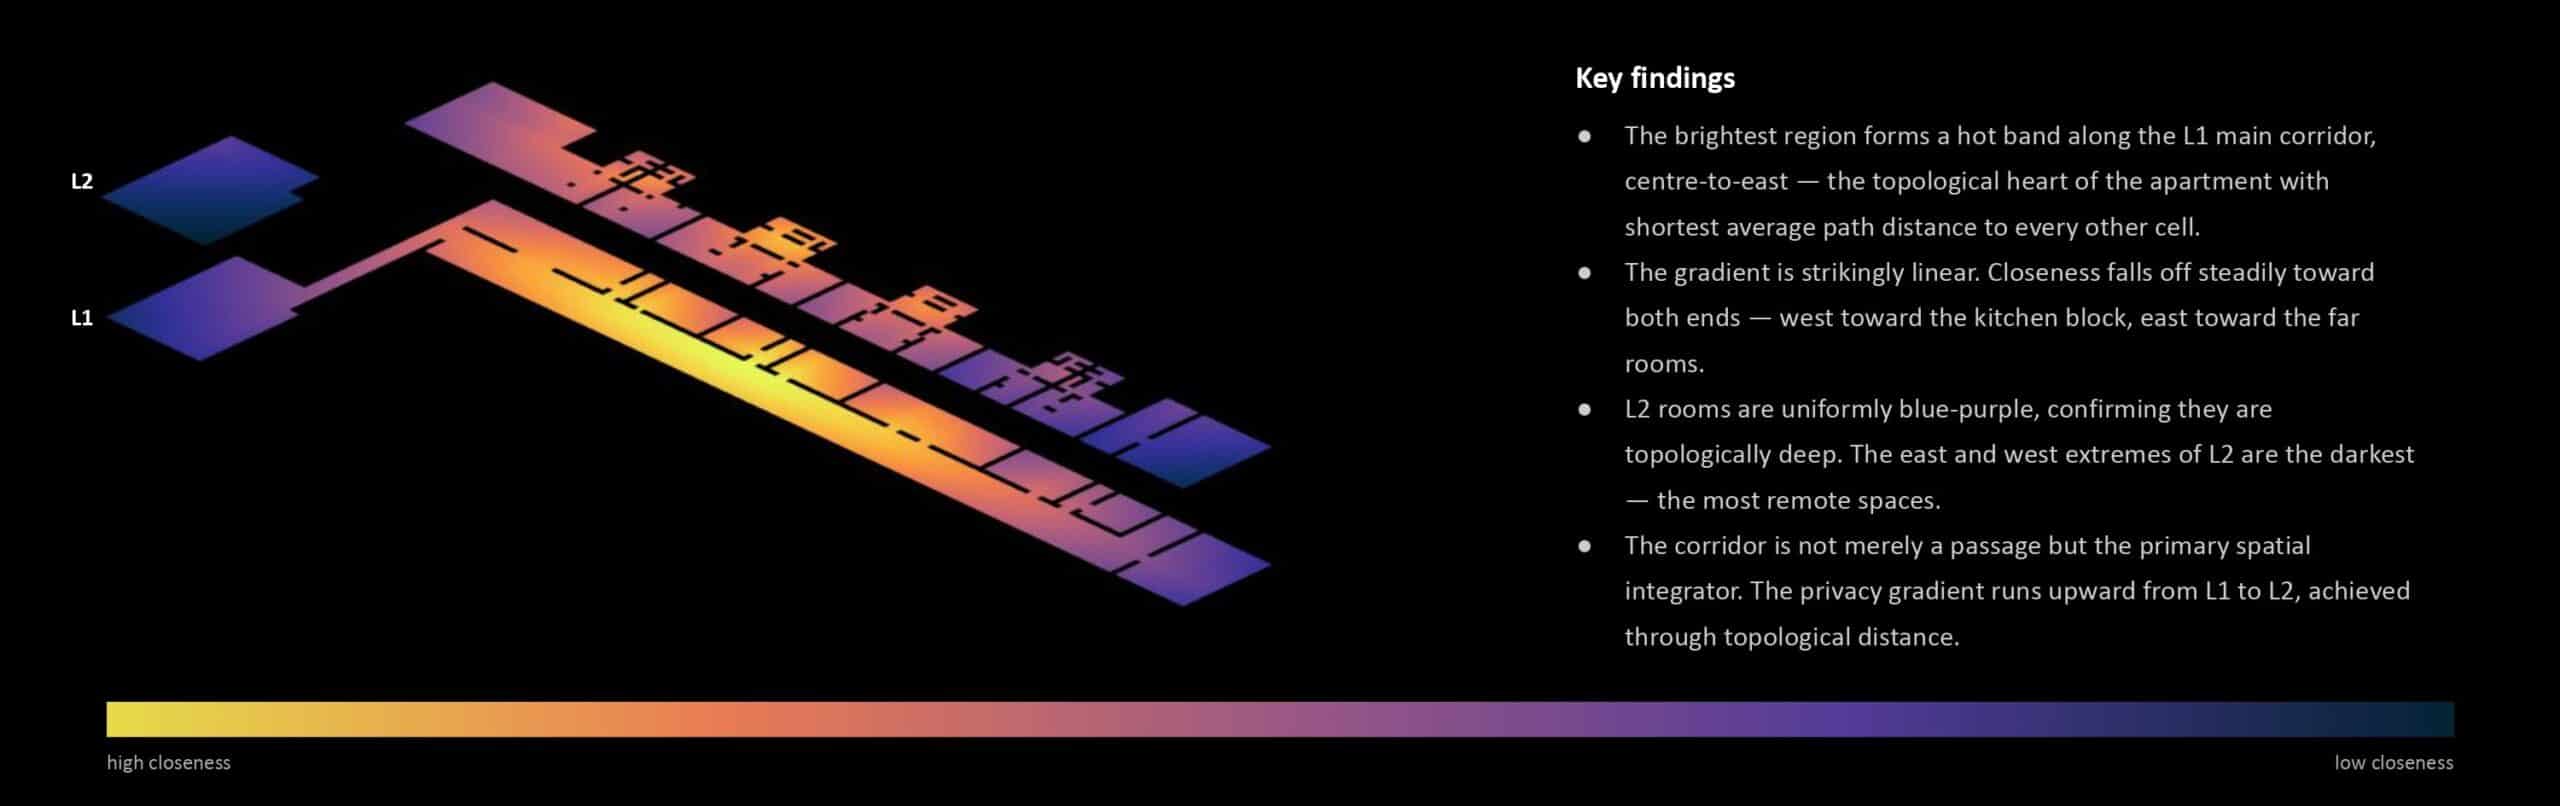
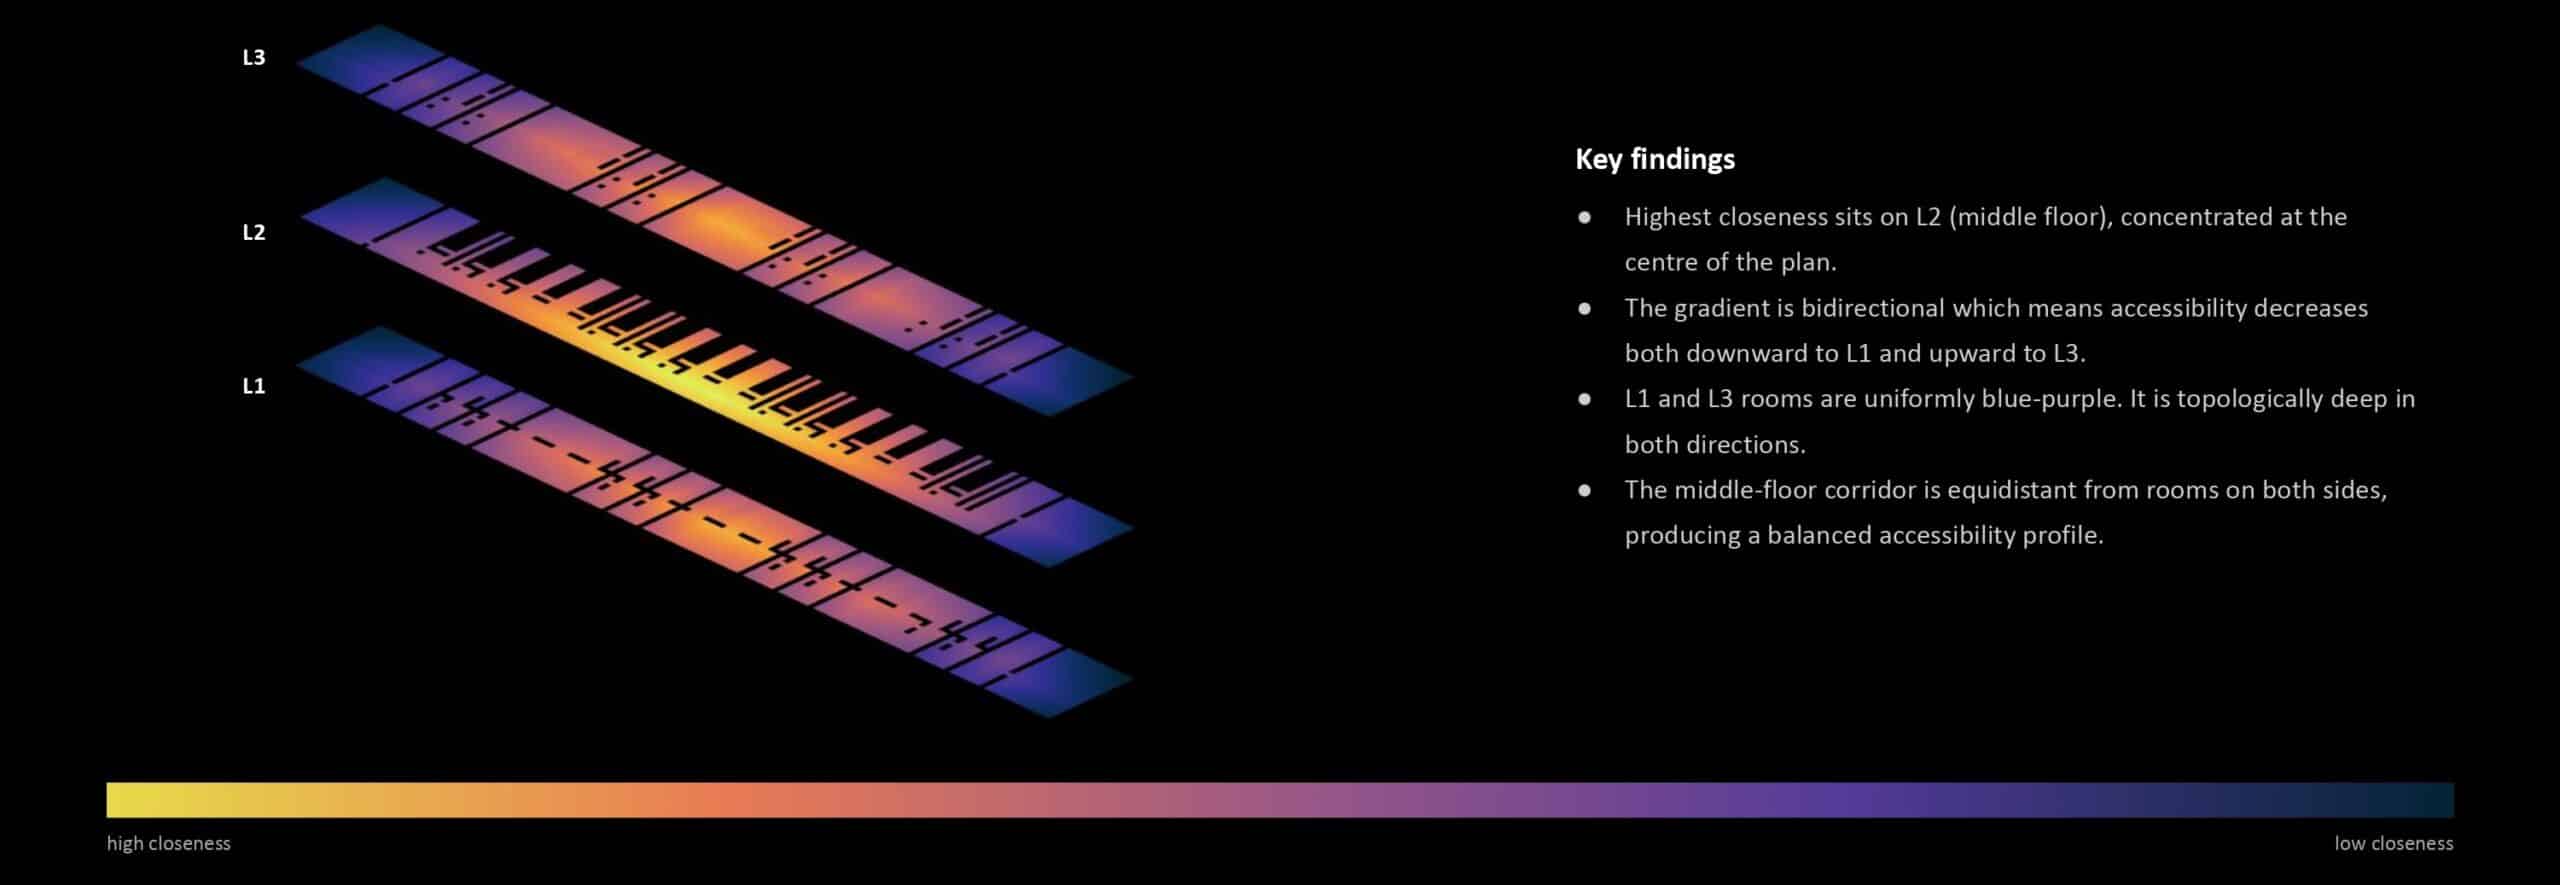
Closeness centrality measures how many steps it takes, on average, to reach every other cell from a given cell. The brighter the cell, the more globally accessible it is.
In Type K, the hottest band runs along the L1 corridor, peaking at the center. L2 rooms are uniformly cold — they’re topologically deep, reachable only by going to a stair and climbing. The gradient is one-directional: accessibility decreases upward from the corridor
In Type F, the hottest zone is on L2 — the middle floor. But unlike K, closeness drops in both directions, downward to L1 and upward to L3. The corridor is equidistant from both room floors, producing a balanced, symmetric privacy gradient.
Betweenness centrality — where does all the traffic flow?
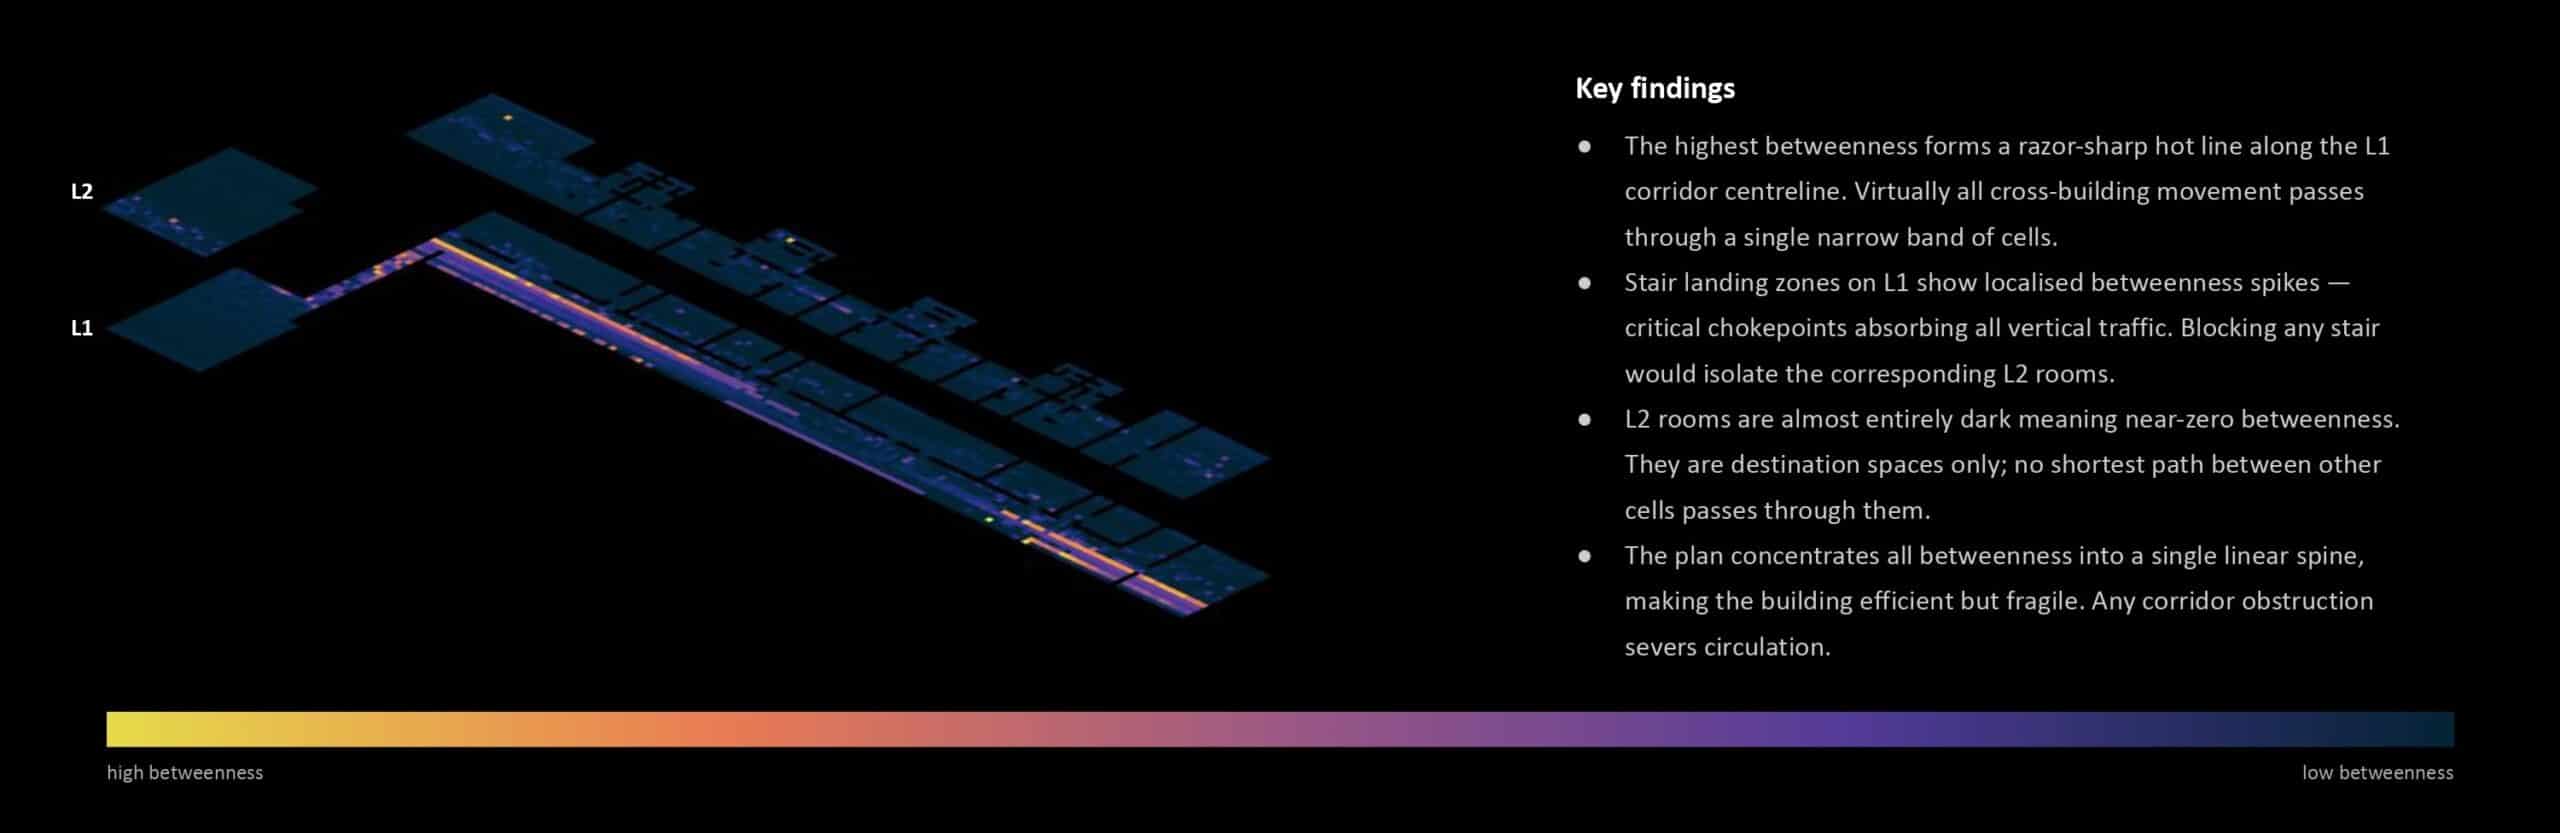
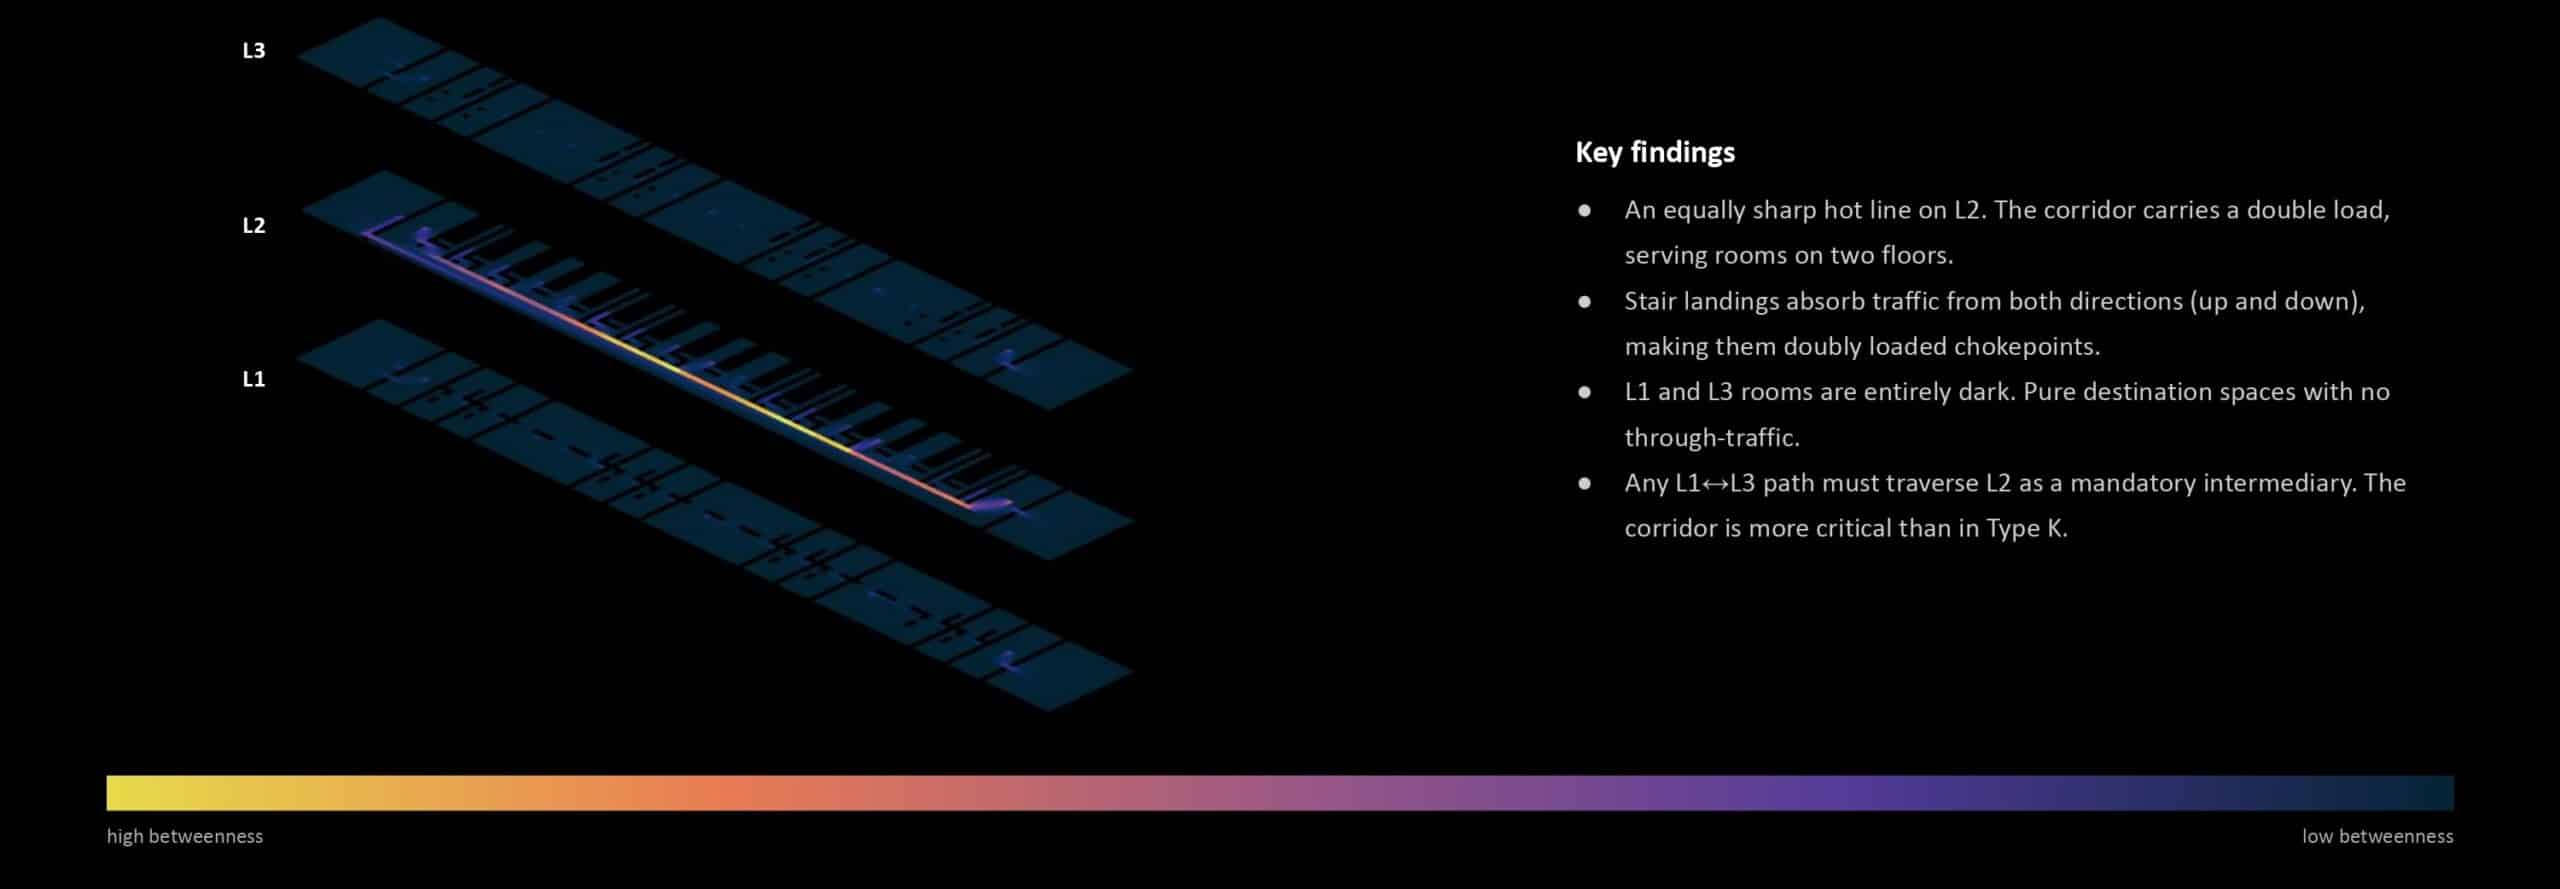
Betweenness centrality shows how often a cell sits on the shortest path between every other pair of cells. It reveals bottlenecks — the spaces that carry the most through-traffic.
Both types produce the same pattern: a sharp bright line along the corridor. Every path in the building funnels through that one band. The stair landings light up as the only way between floors. The room floors are completely dark — they’re endpoints, not throughways.
You can see a corridor on a floor plan. But what betweenness shows is that every single path runs through it.
The difference is load. The Type F corridor carries double: it serves rooms on two floors instead of one. Any L1-to-L3 journey must cross L2 as a mandatory intermediary. Blocking the corridor in K disconnects one floor of rooms. Blocking it in F disconnects two.
Shortest path — how do you cross the building?
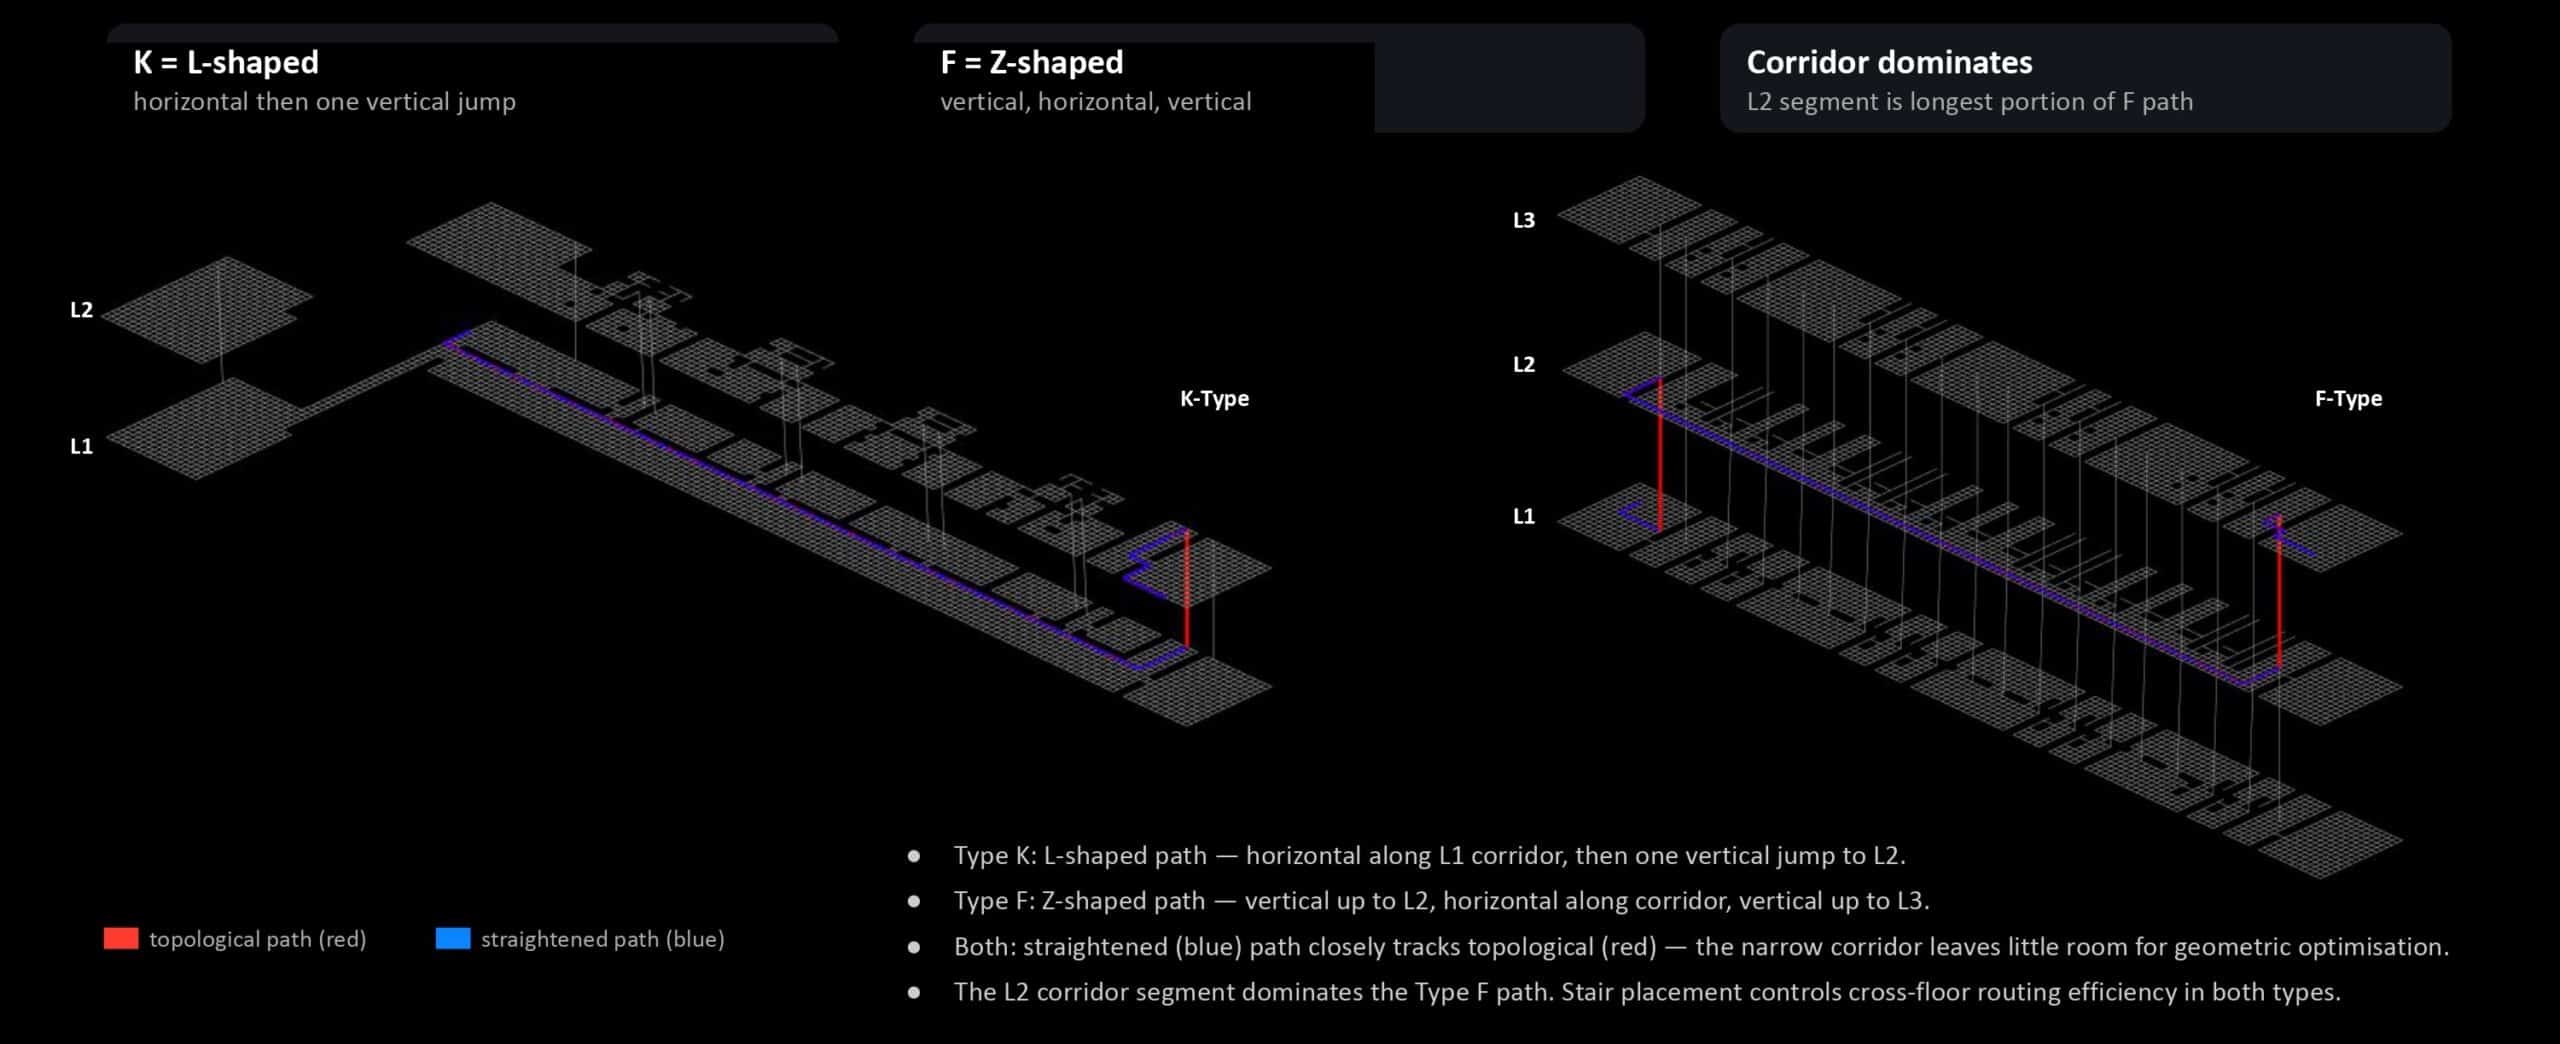
The shortest path analysis traces a route from one corner of the building to the opposite — a full diagonal traversal across all floors.
Type K makes an L-shape: horizontal along the corridor, then one stair up. Type F makes a Z-shape: up to L2, across the full corridor, then up again to L3. In both cases, the straightened geometric path barely improves on the topological one — the corridor is too narrow to optimize around.
Degree centrality and clustering coefficient — the flat metrics
Not every metric reveals hierarchy. Degree centrality — how many direct neighbors each cell has — is almost entirely uniform across both types. The only outliers are stair landings, where vertical connections bump the count up. The spatial hierarchy only shows at the global scale, not the local one.
Clustering coefficient is zero everywhere. The grid can’t form triangles, so there are no loop connections. Both apartments enforce strictly sequential movement — no ring corridors, no courtyards, no shortcuts.
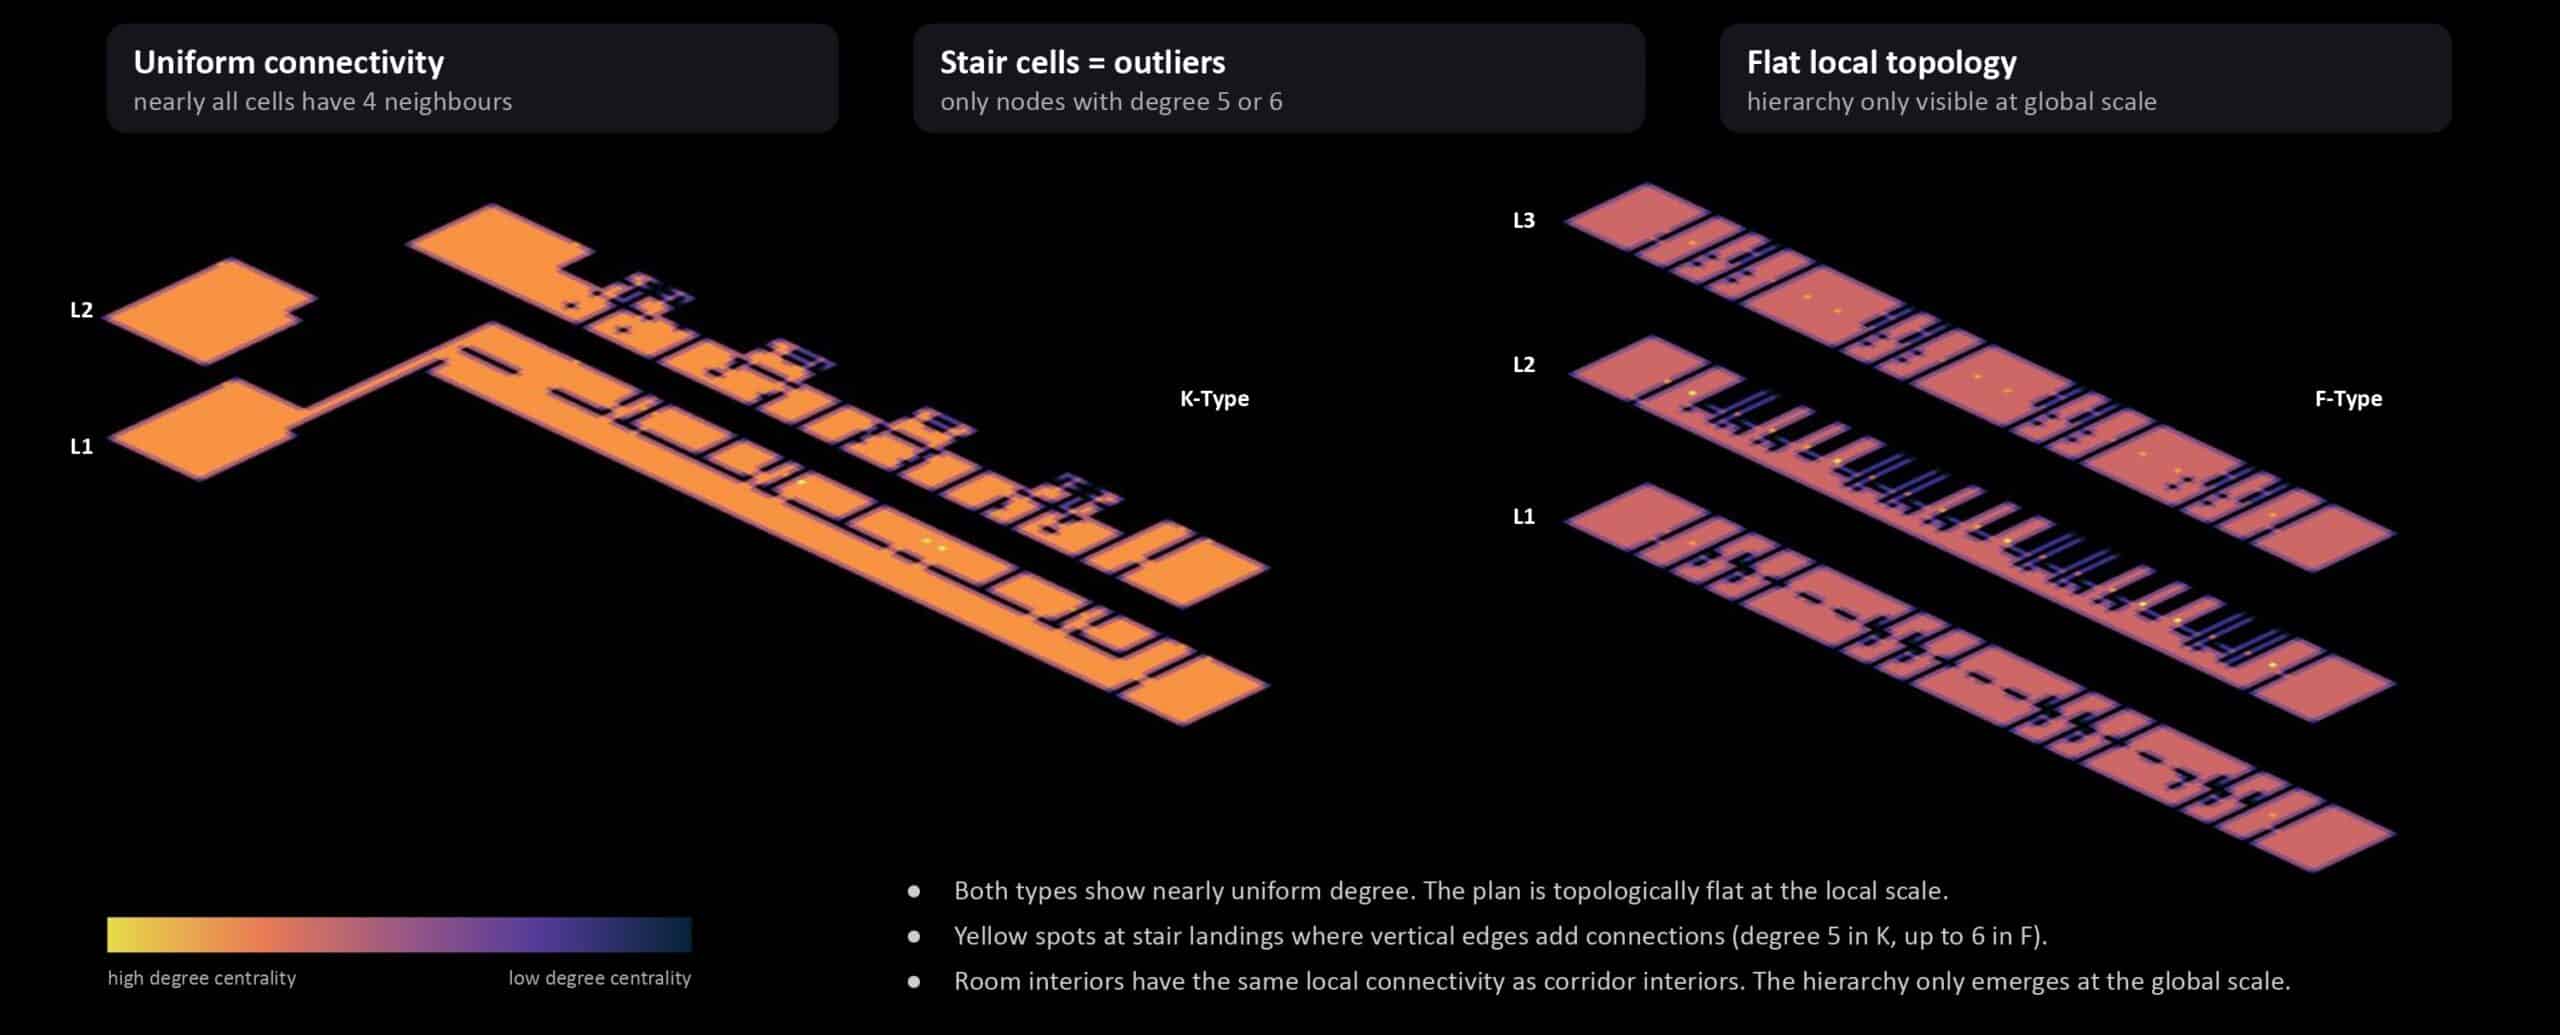
These “flat” results are still meaningful. They confirm that the building has no locally clustered zones — the entire spatial logic is linear and hierarchical, legible only through global metrics like closeness and betweenness.
Community detection — what are the real spatial units?
The Louvain algorithm groups cells into communities — clusters that are more densely connected internally than to the rest of the network. It knows nothing about rooms or floors; it only sees the graph.
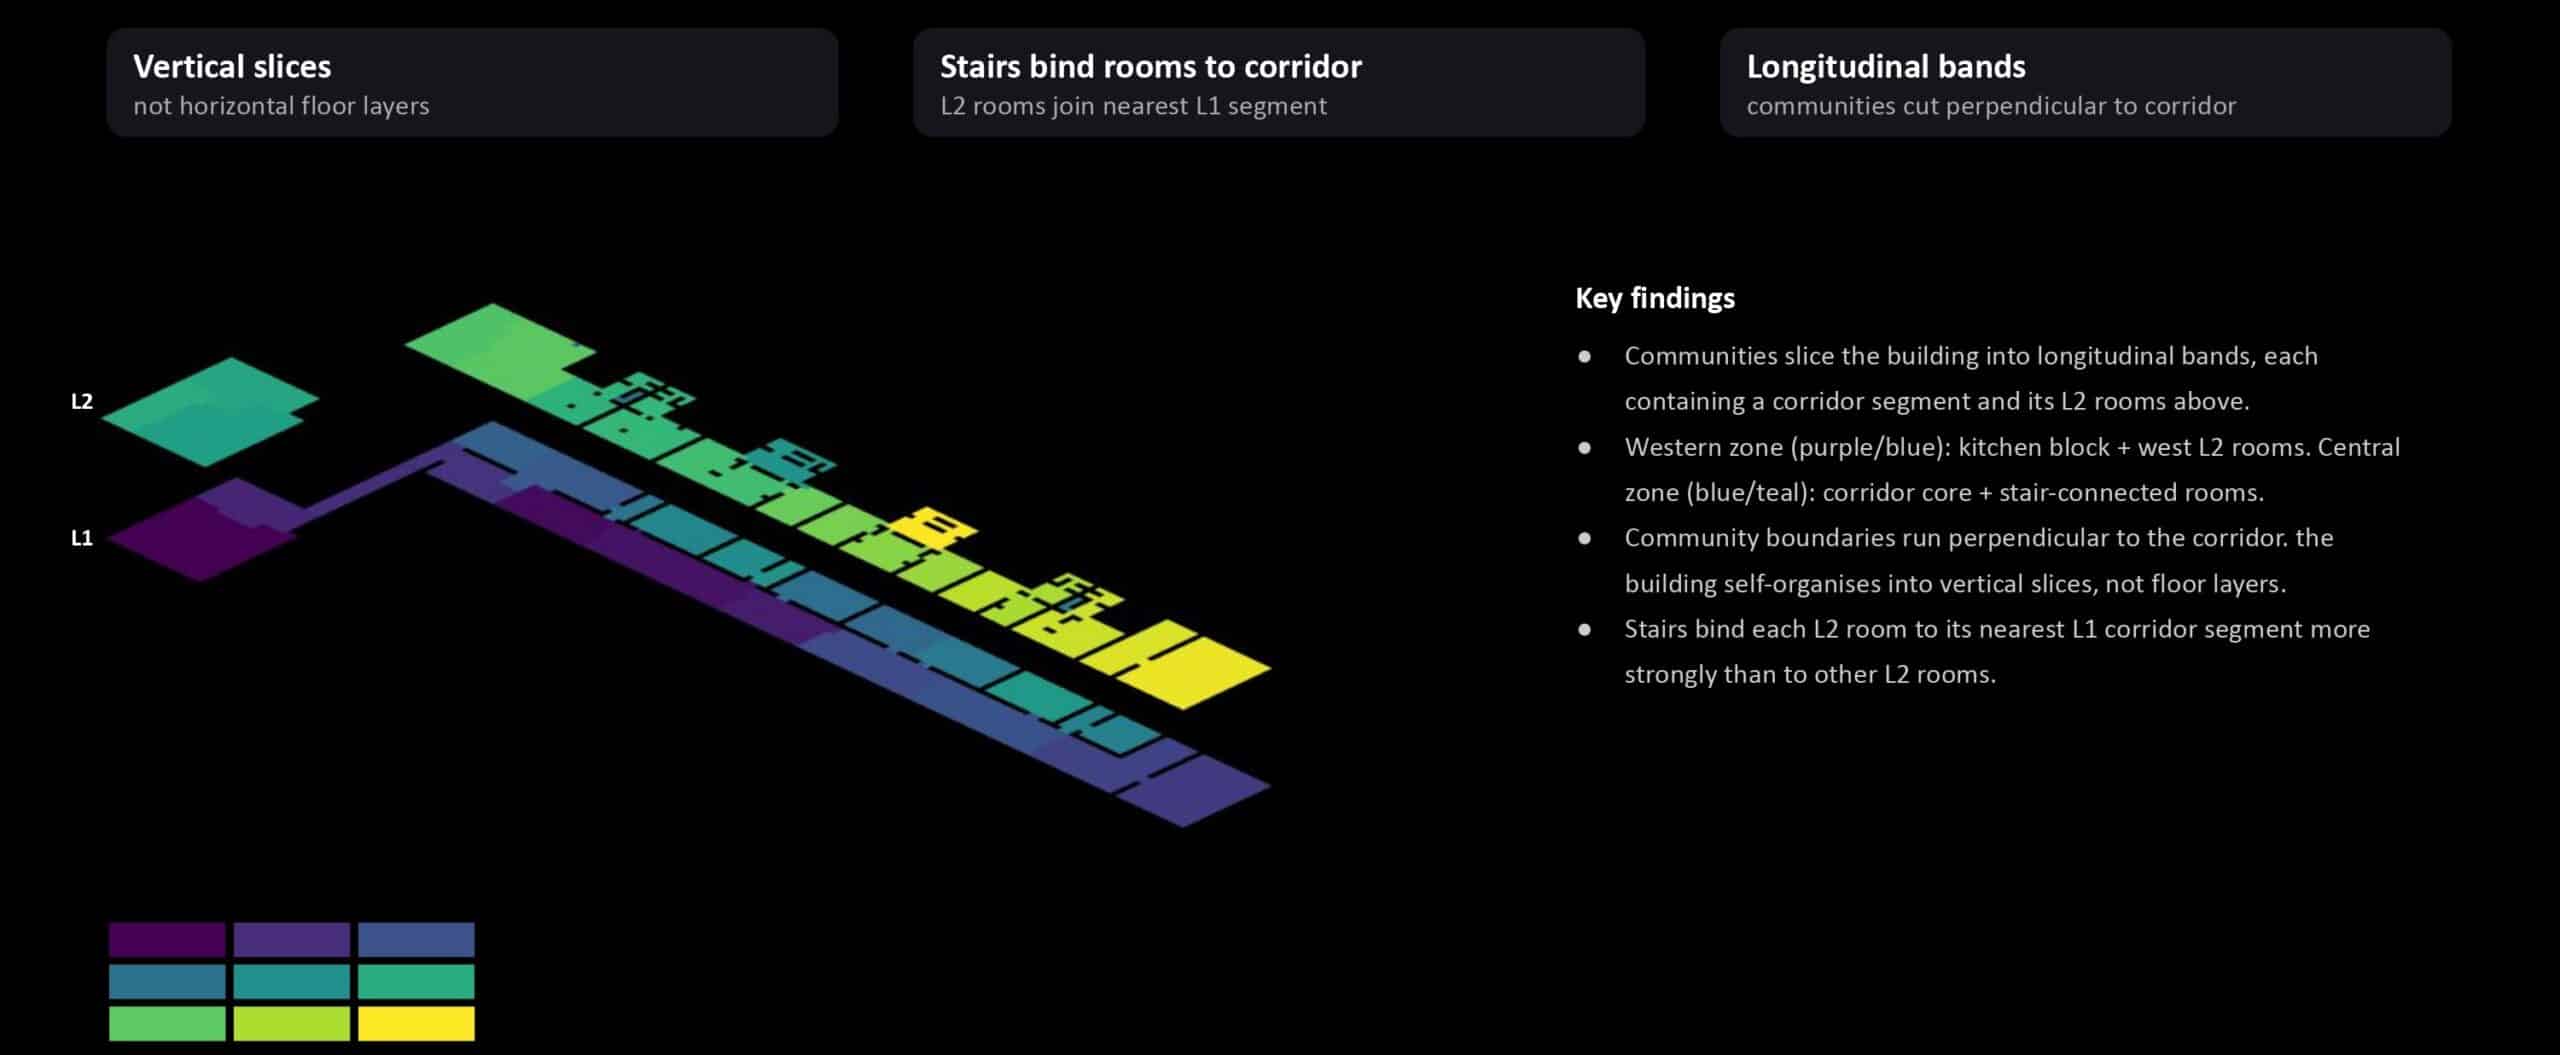
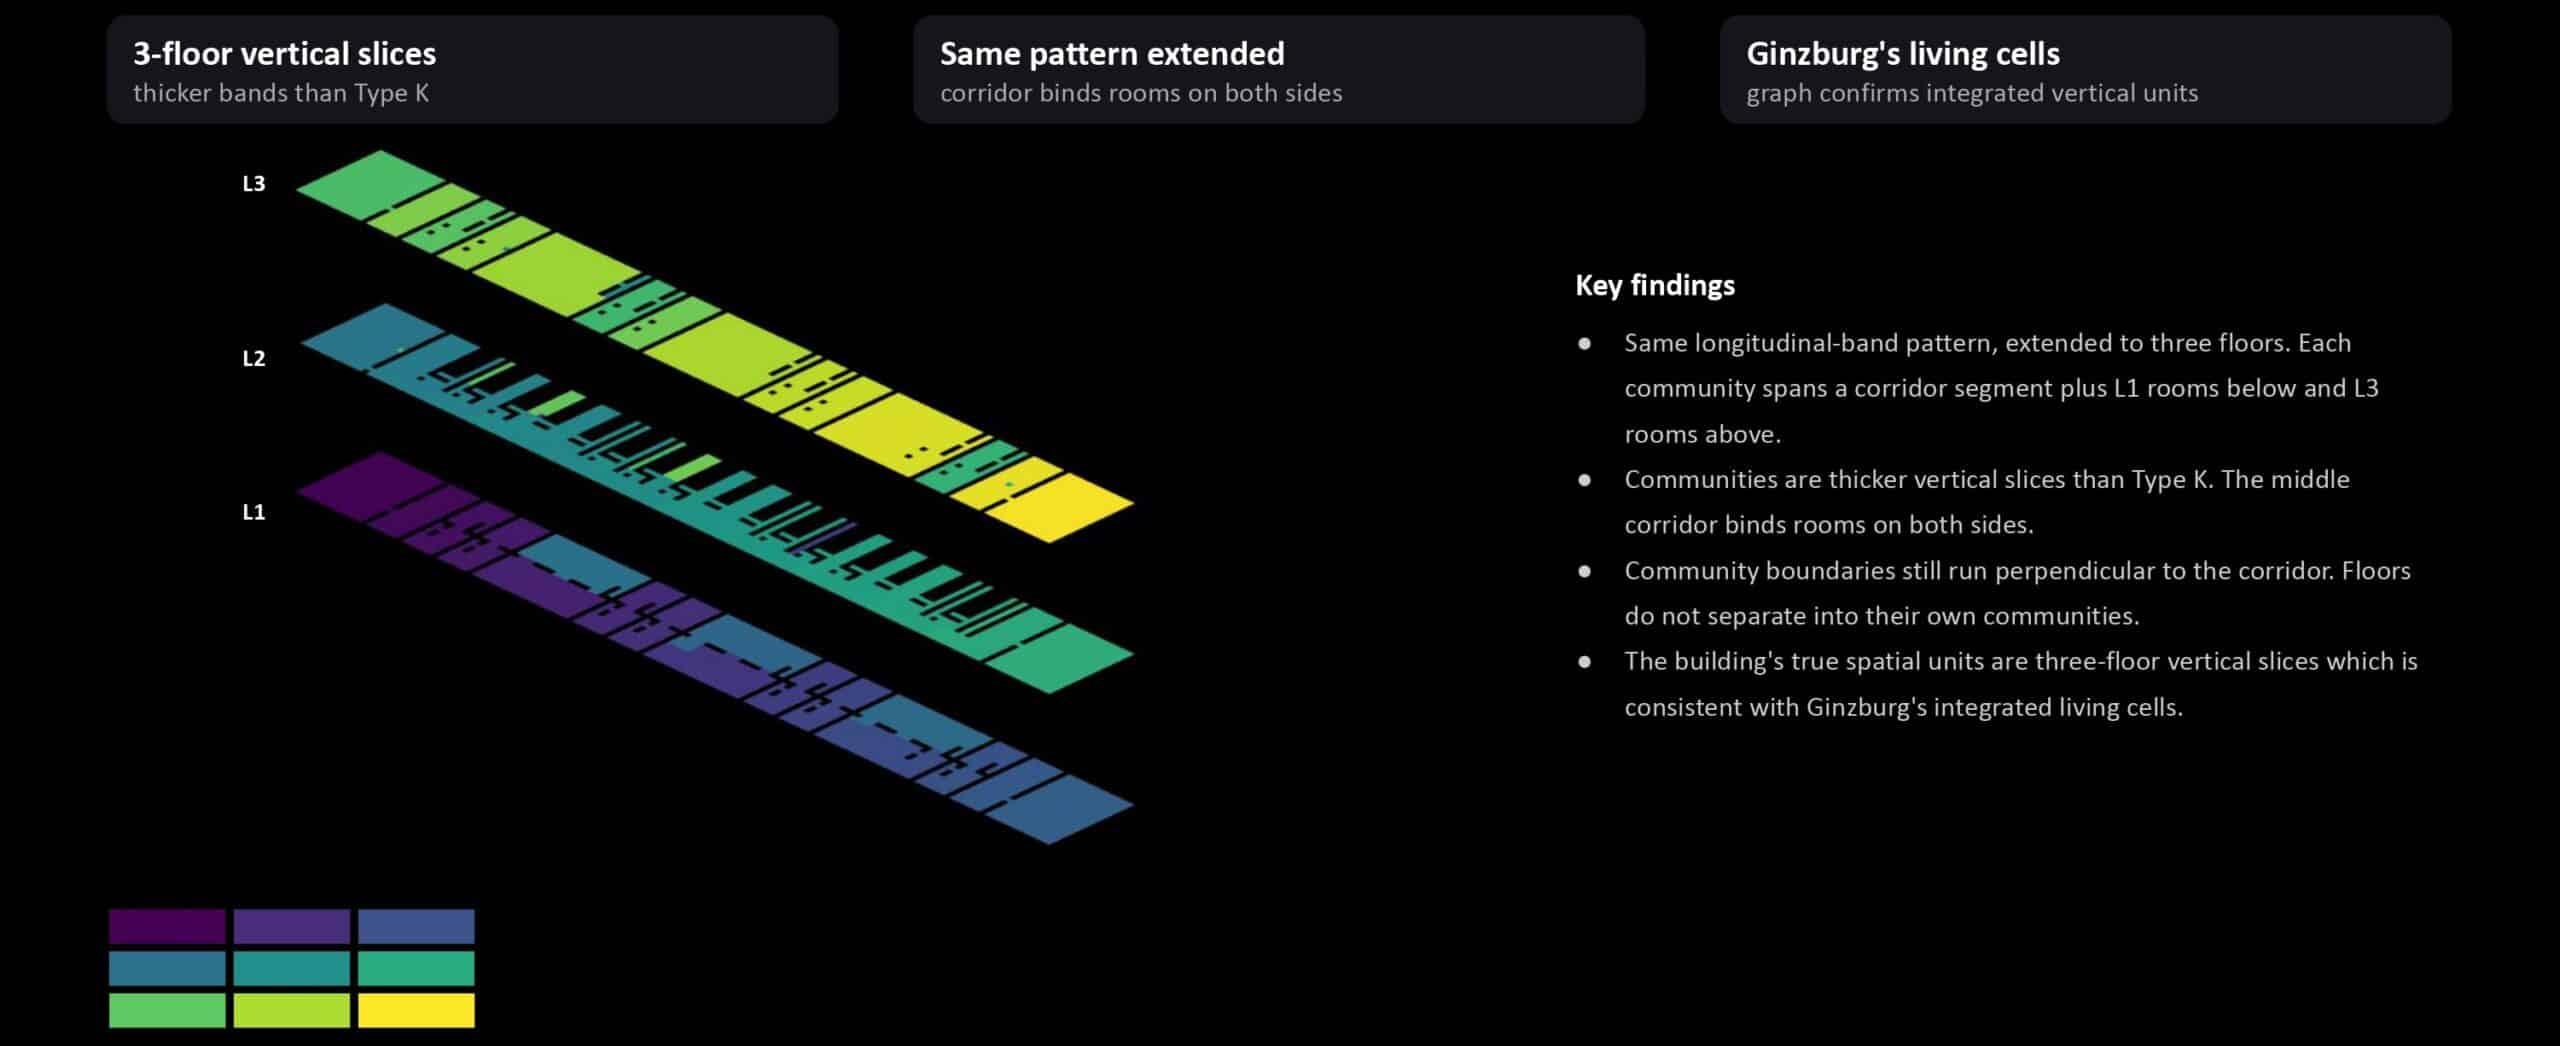
In both types, communities slice the building into longitudinal bands that run perpendicular to the corridor. Each band contains a segment of the corridor plus the rooms directly above (and in Type F, below) it. The stair connections are strong enough to bind rooms to their nearest corridor segment across floor boundaries, rather than letting the floors separate into their own groups.
The building’s true spatial units are not rooms or floors — they’re vertical slices.
This matches Ginzburg’s design intent. He called these units integrated living cells: vertical sections of corridor and rooms that function as a single spatial system. The community detection finds exactly that, from topology alone.
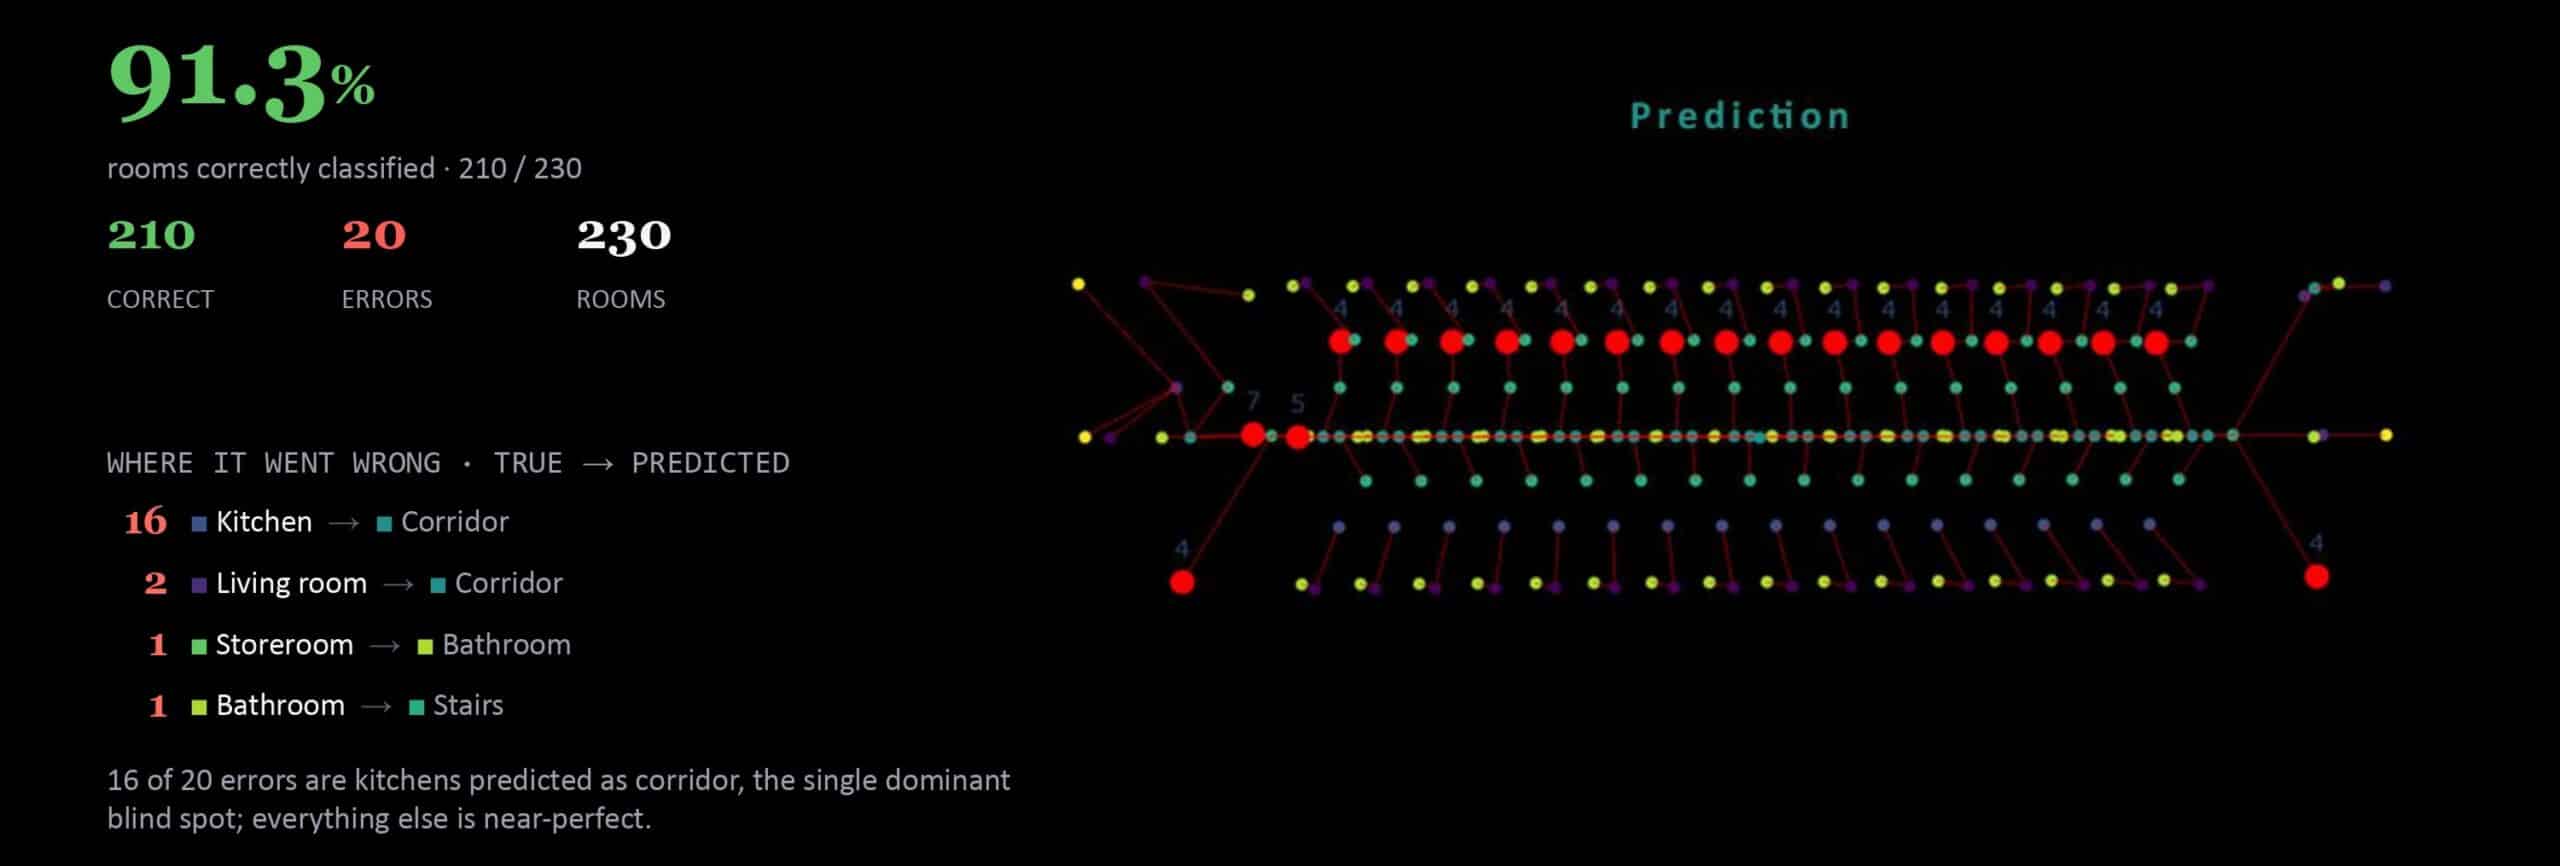
Room type prediction — can topology alone identify rooms?
We fed both apartment types into a pretrained GraphSAGE-Pool model trained on the Modified Swiss Dwellings dataset — 5,372 Swiss floor plans. The model sees only zone type and connectivity (doors, entrances). No geometry, no sizes. From that alone, it predicts the room type.
Type F scored 91.3% (210 of 230 correct). Sixteen of the twenty errors were open kitchens misread as corridors — a single blind spot. Everything else was near-perfect. The F-type layout resembles the Swiss apartments the model was trained on.
Type K scored 67.9% (55 of 81 correct). The errors are systematic: ten living rooms read as kitchens, nine stairs as storerooms, six living rooms as corridors. All rooms with nearly identical connectivity that the model can’t separate.
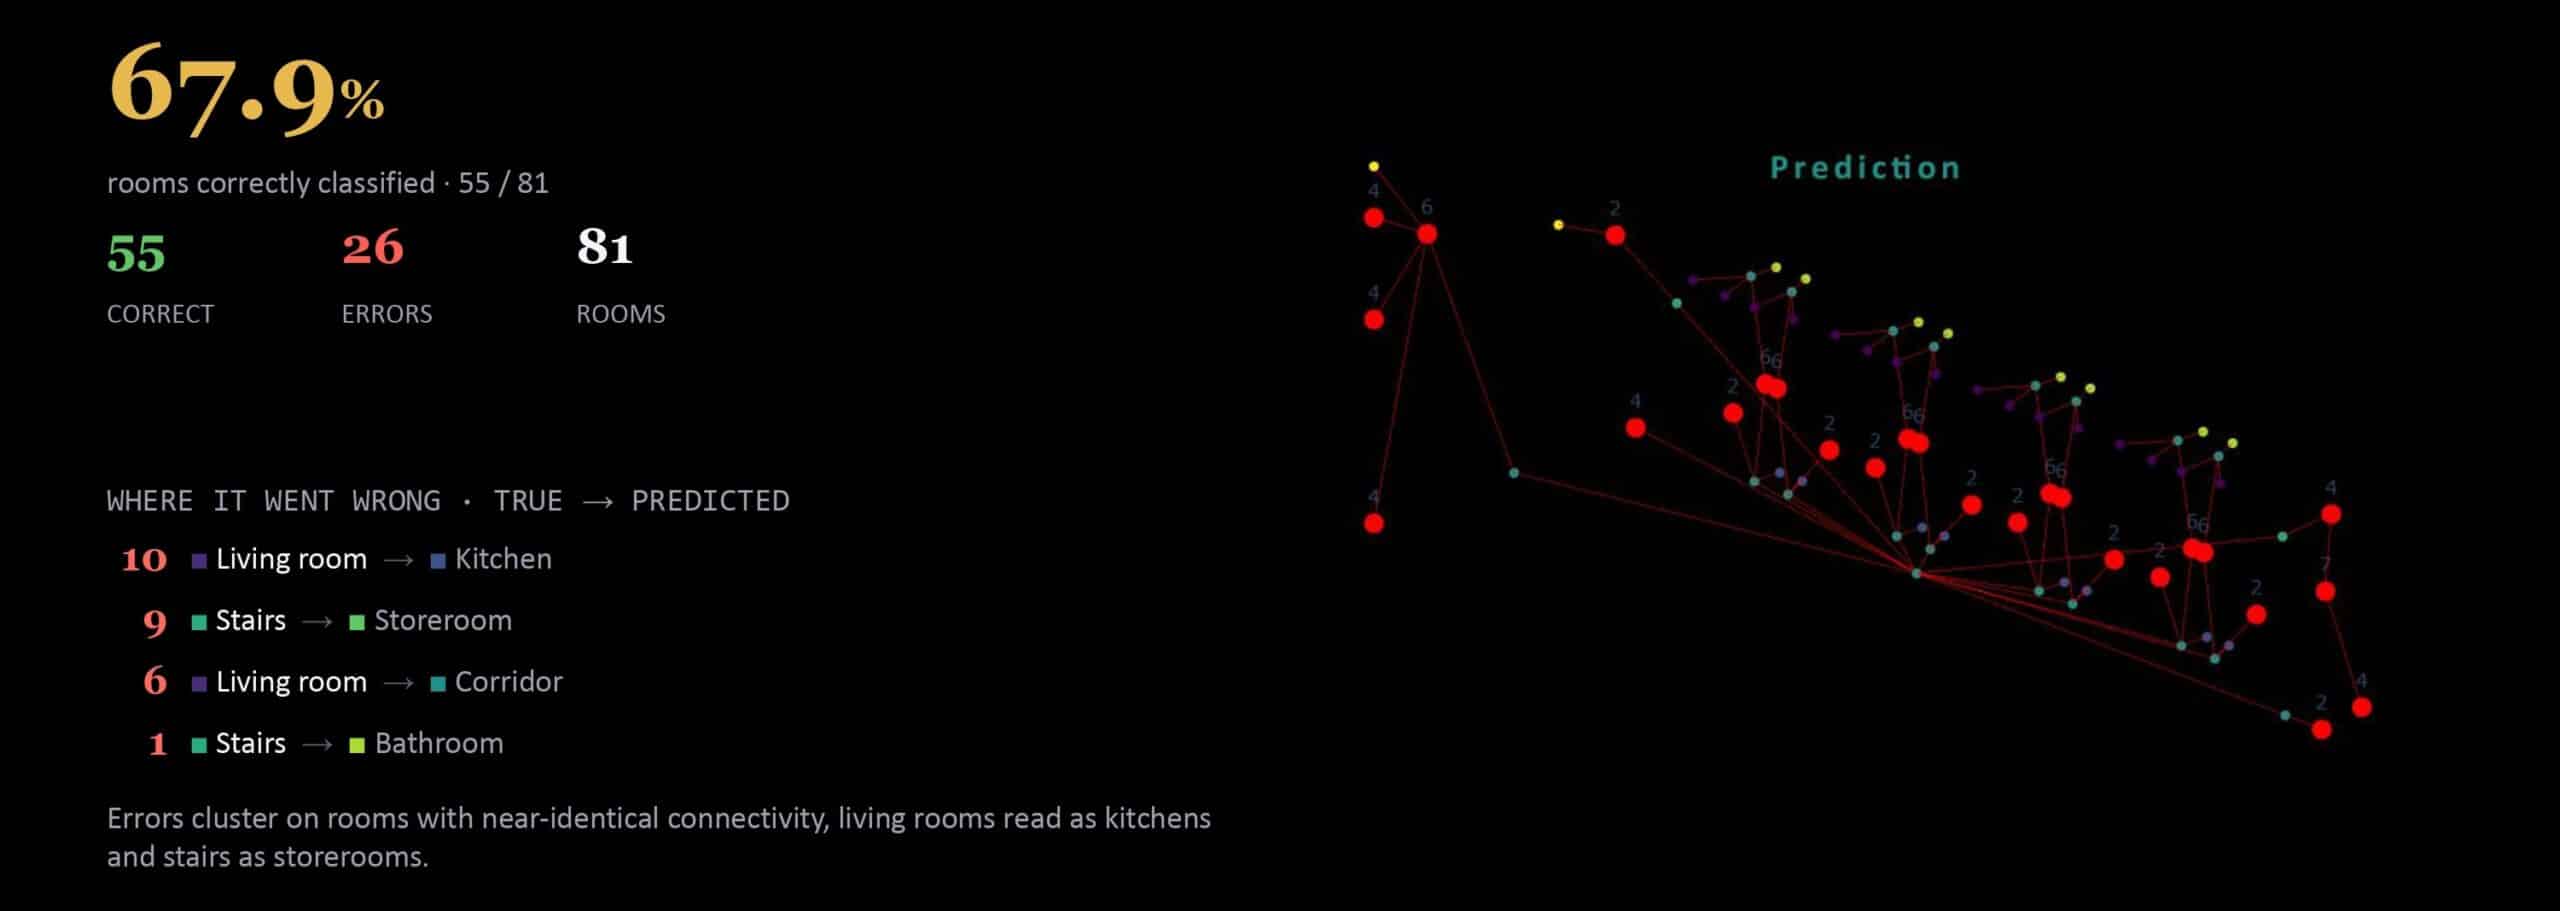
The gap is not a failure — it’s a finding. The K-type’s communal layout is unlike anything in the Swiss training set. Kitchens were minimal because residents were expected to eat communally. Living rooms doubled as social space. These rooms sit in familiar positions but serve unfamiliar functions. The model fails on them because Narkomfin was designed as a social condenser — architecture that deliberately breaks the domestic conventions the model learned.
The 68% is the model telling you this building doesn’t follow the rules.
What the graph reveals that the plan can’t
Viewed in plan, Type K and Type F look like variations on the same narrow corridor scheme. The graph analysis exposes the structural difference:
The F-type’s middle-floor corridor is topologically more central but also more critical. It quantifies a tradeoff between integration (the middle position connects equally in both directions) and resilience (the middle position concentrates all risk into a single layer). These are invisible in a floor plan but legible in the graph.
Every spatial metric confirmed the corridor spine and vertical cells. The prediction model confirmed the building’s unconventional program. Same building, two readings — one structural, one functional — and they converge on the same conclusion: Narkomfin was designed to work differently, and the graph can see it.
