
How borders shape frontiers of urban life?
I. Introduction
Borders are often perceived as abstract lines on maps, yet they deeply shape how cities grow, connect, and fragment. Cities located along international borders experience unique spatial, social, and political conditions that distinguish them from inland urban areas. This project investigates borders not as static lines, but as active agents that structure urban life, mobility, governance, and everyday experience.
Through a multi-layered spatial analysis, Cities on the Edge explores how borders simultaneously connect and fragment cities, producing varied urban realities across the globe.
_____________________________________________________________________________________________________________________________________________________________________
II. History of Borders
In the beginning, there were no borders. The Earth’s surface was once a continuous landmass—Pangea—where natural processes such as tectonic movement, rivers, mountains, and seas gradually formed the first divisions. These natural borders shaped early human settlement, movement, and interaction.
Political borders emerged much later, often as products of war, treaties, colonialism, and nation-state formation. However, borders have never been fixed. Historical maps reveal constant shifts over time, influenced not only by political elites but also by local communities.
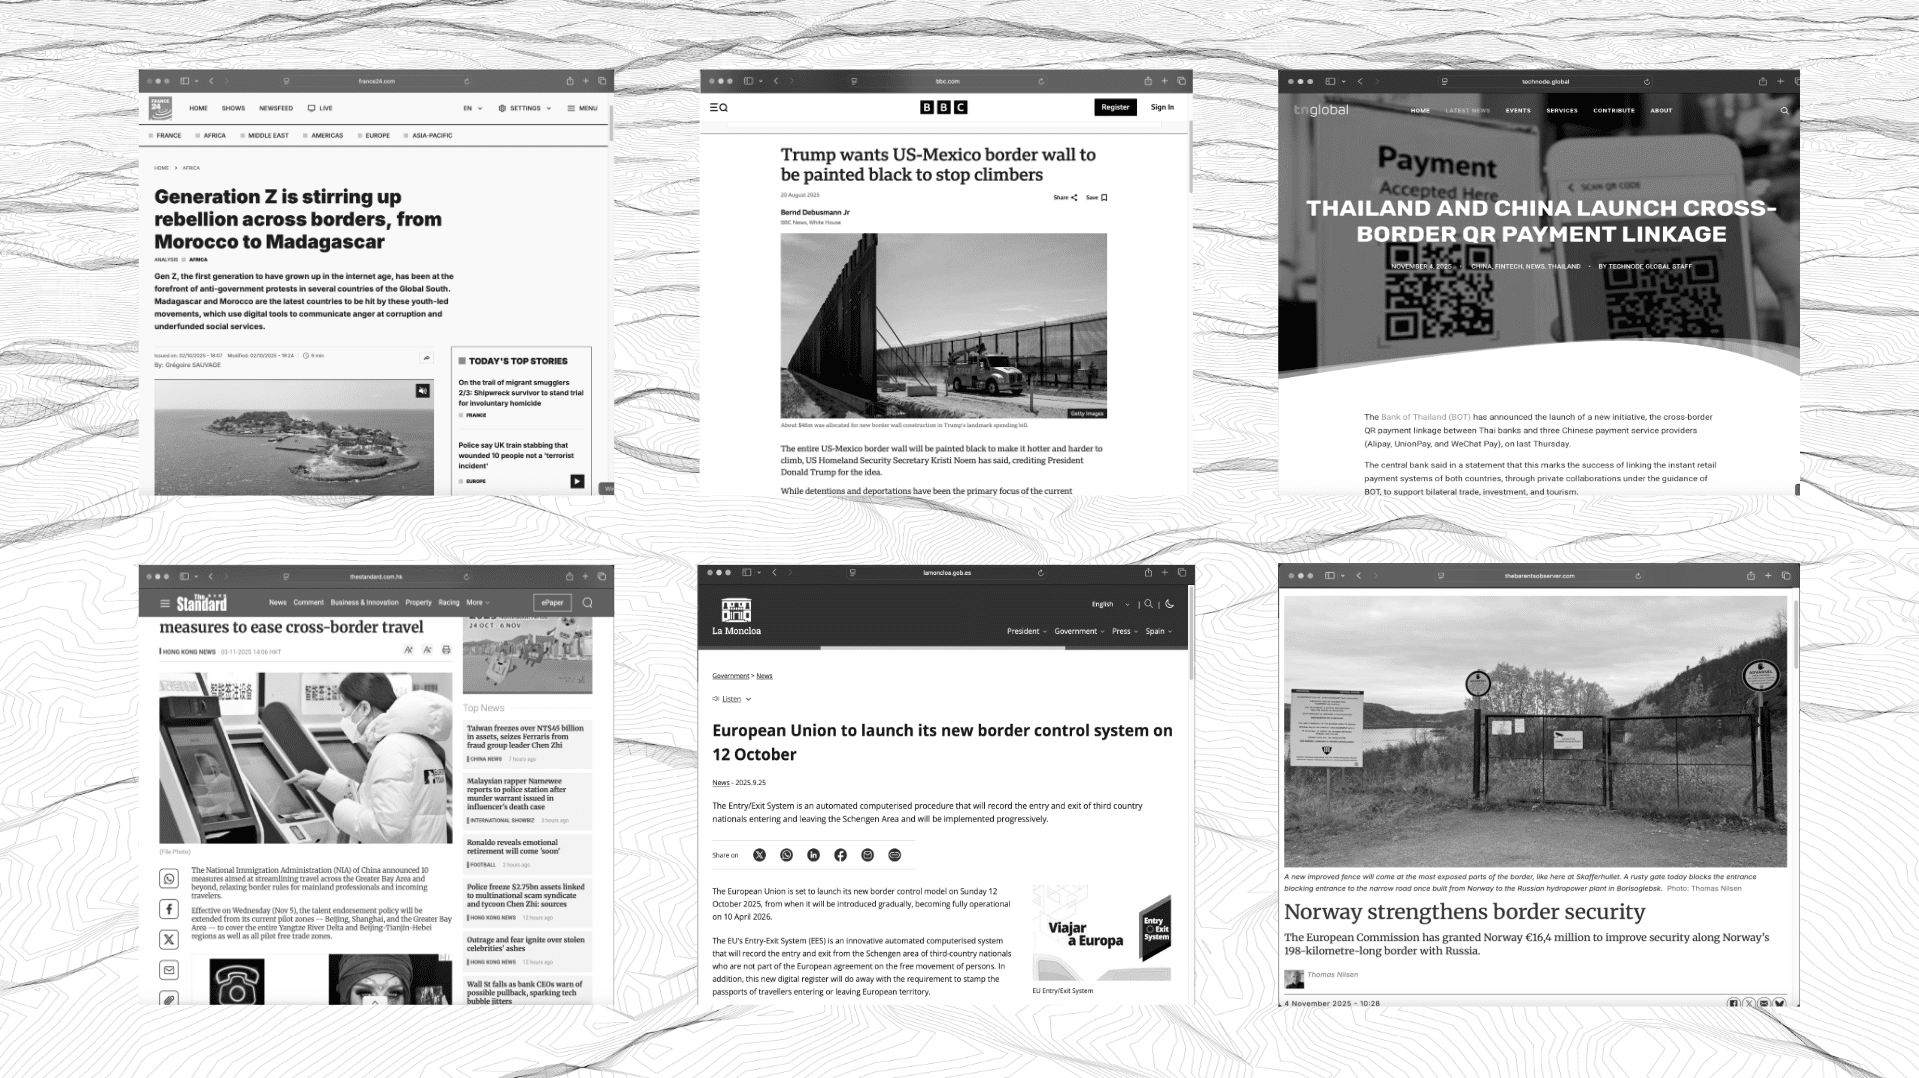
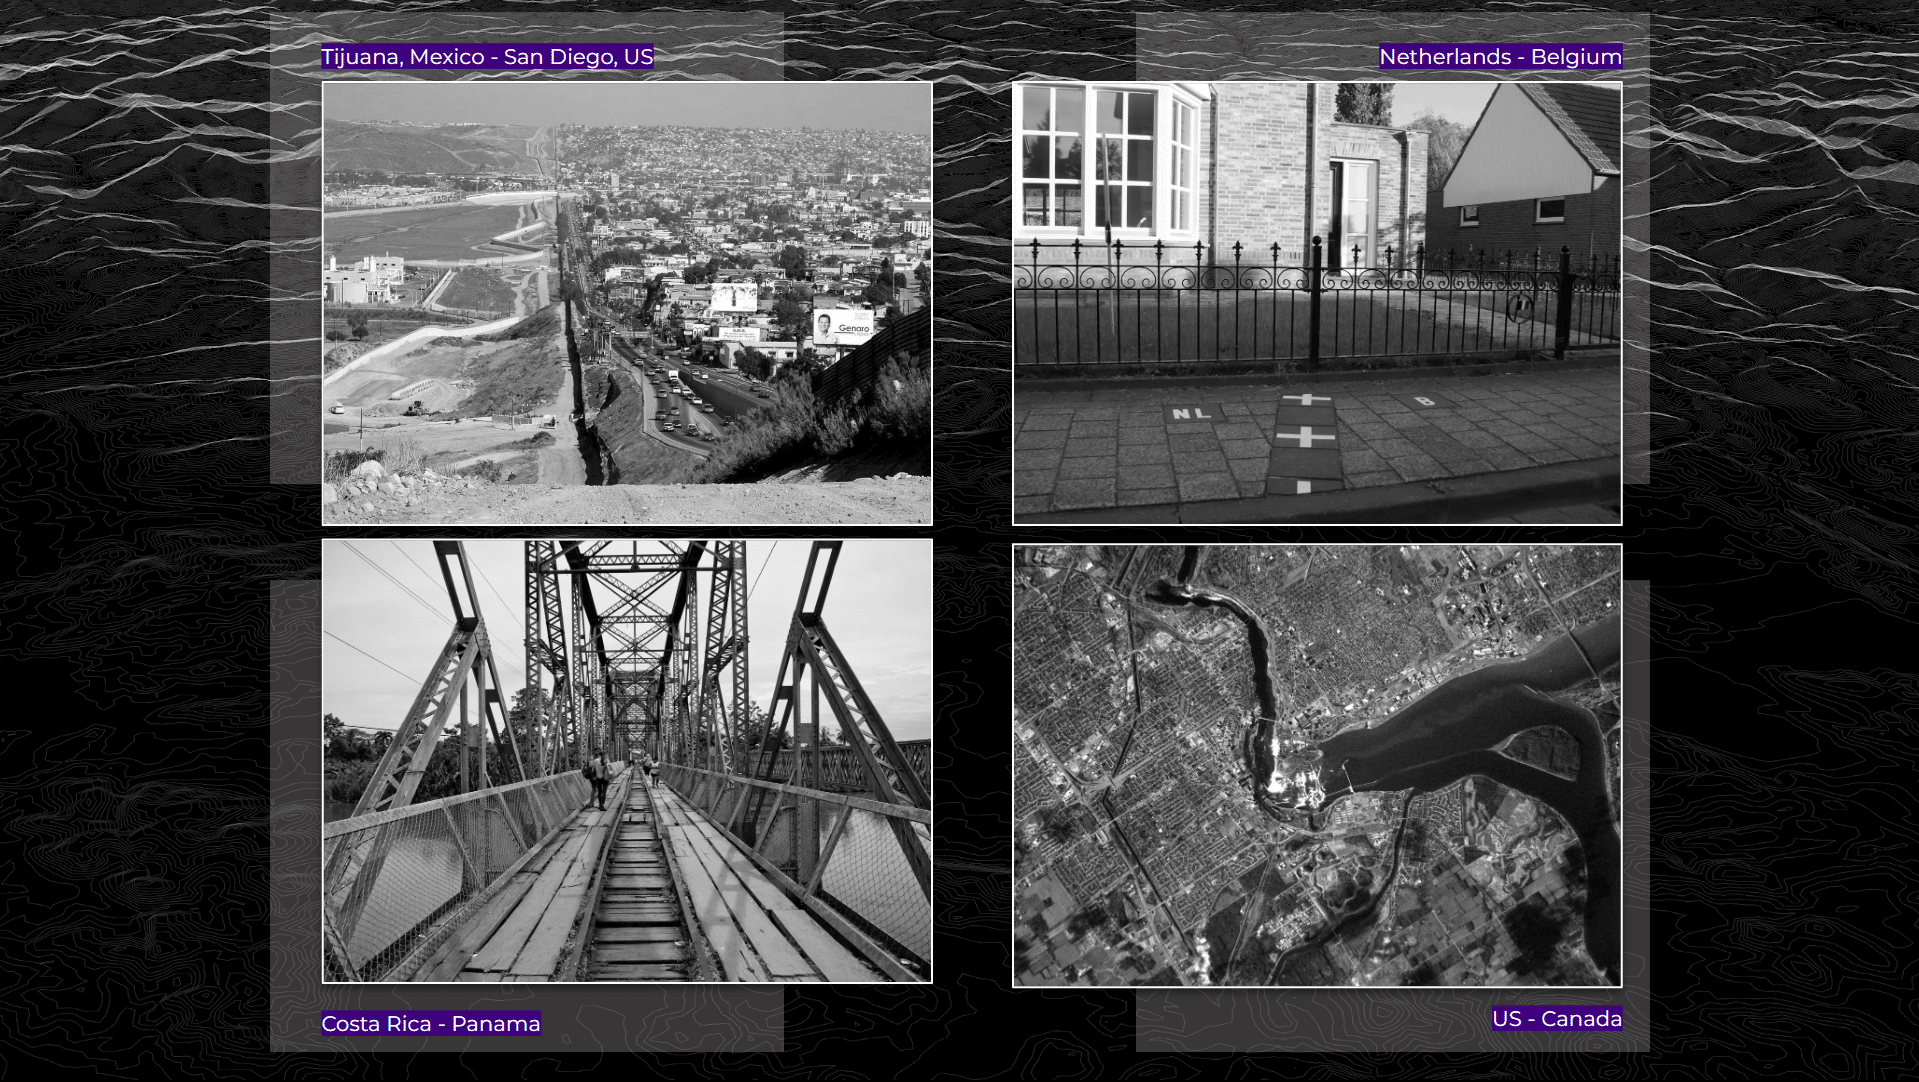
Although we live in an increasingly globalized world, borders remain powerful spatial filters. The ability to cross a border depends on geography, infrastructure, legal status, and political context. Some borders are barely perceptible, while others are reinforced through checkpoints, walls, and militarized zones.
As anthropologist Peter Sahlins argues, borders are continuously negotiated through everyday practices, producing spaces that are both shared and divided.
For cities located along these lines, borders directly influence: Urban form and expansion, Infrastructure and connectivity, Social and cultural continuity, Economic exchange and mobility
Understanding borders is therefore essential to understanding the cities shaped by them.
_____________________________________________________________________________________________________________________________________________________________________
III. Research Question
Why to study? To understand how borders shape the dynamics of connected yet fragmented cities along them.
_____________________________________________________________________________________________________________________________________________________________________
IV. Methodology
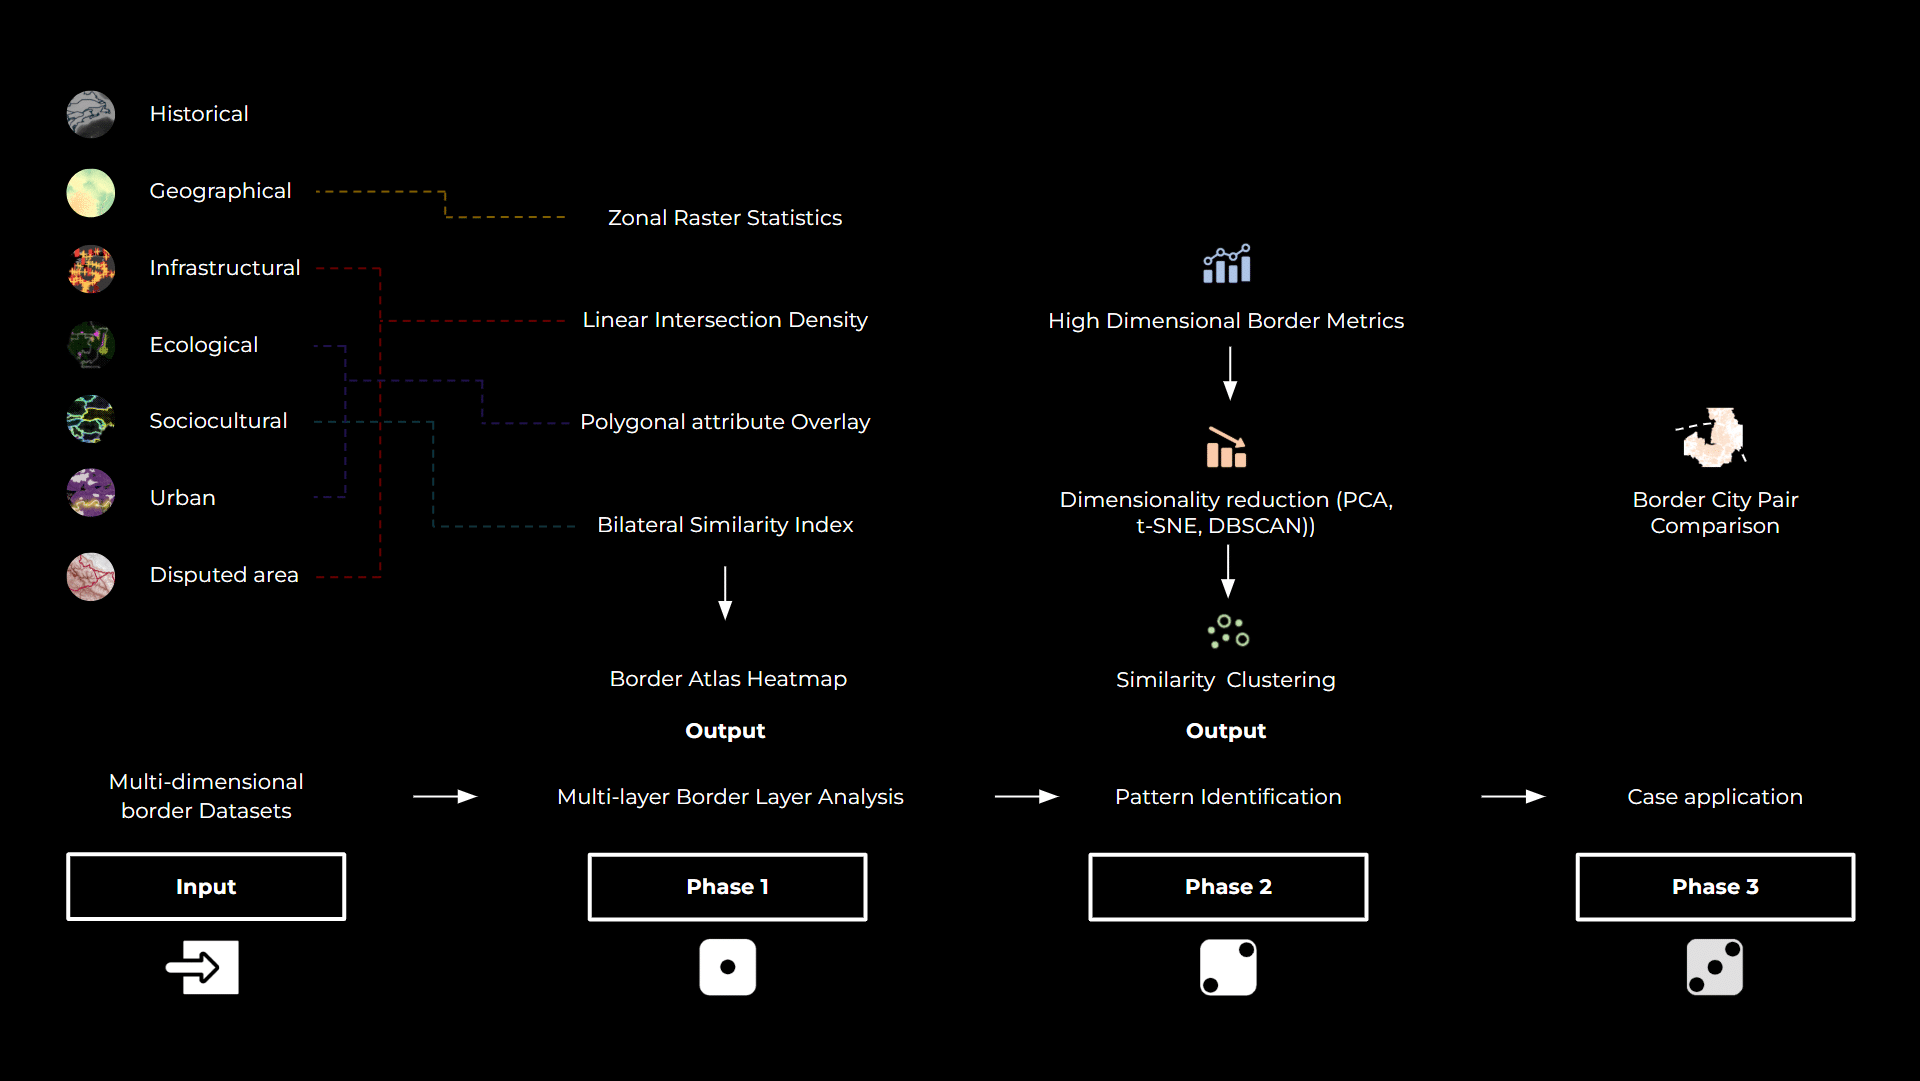
The project is structured in three main phases:
Phase 1: Construction of a multi-layered Atlas of Borders
Phase 2: Similarity-based clustering to identify border typologies
Phase 3: Speculative analysis of border city pairs
Each phase builds upon the previous one, moving from global-scale analysis toward urban-scale interpretation.
_____________________________________________________________________________________________________________________________________________________________________
V. Phase 1 — Atlas of Borders
Phase 1 compiles and analyzes multiple datasets to create a comprehensive spatial atlas of international borders. Each border segment is treated as a unit of analysis and enriched with attributes derived from different thematic layers. Because datasets vary in structure (raster, line, polygon), different analytical models were applied accordingly.
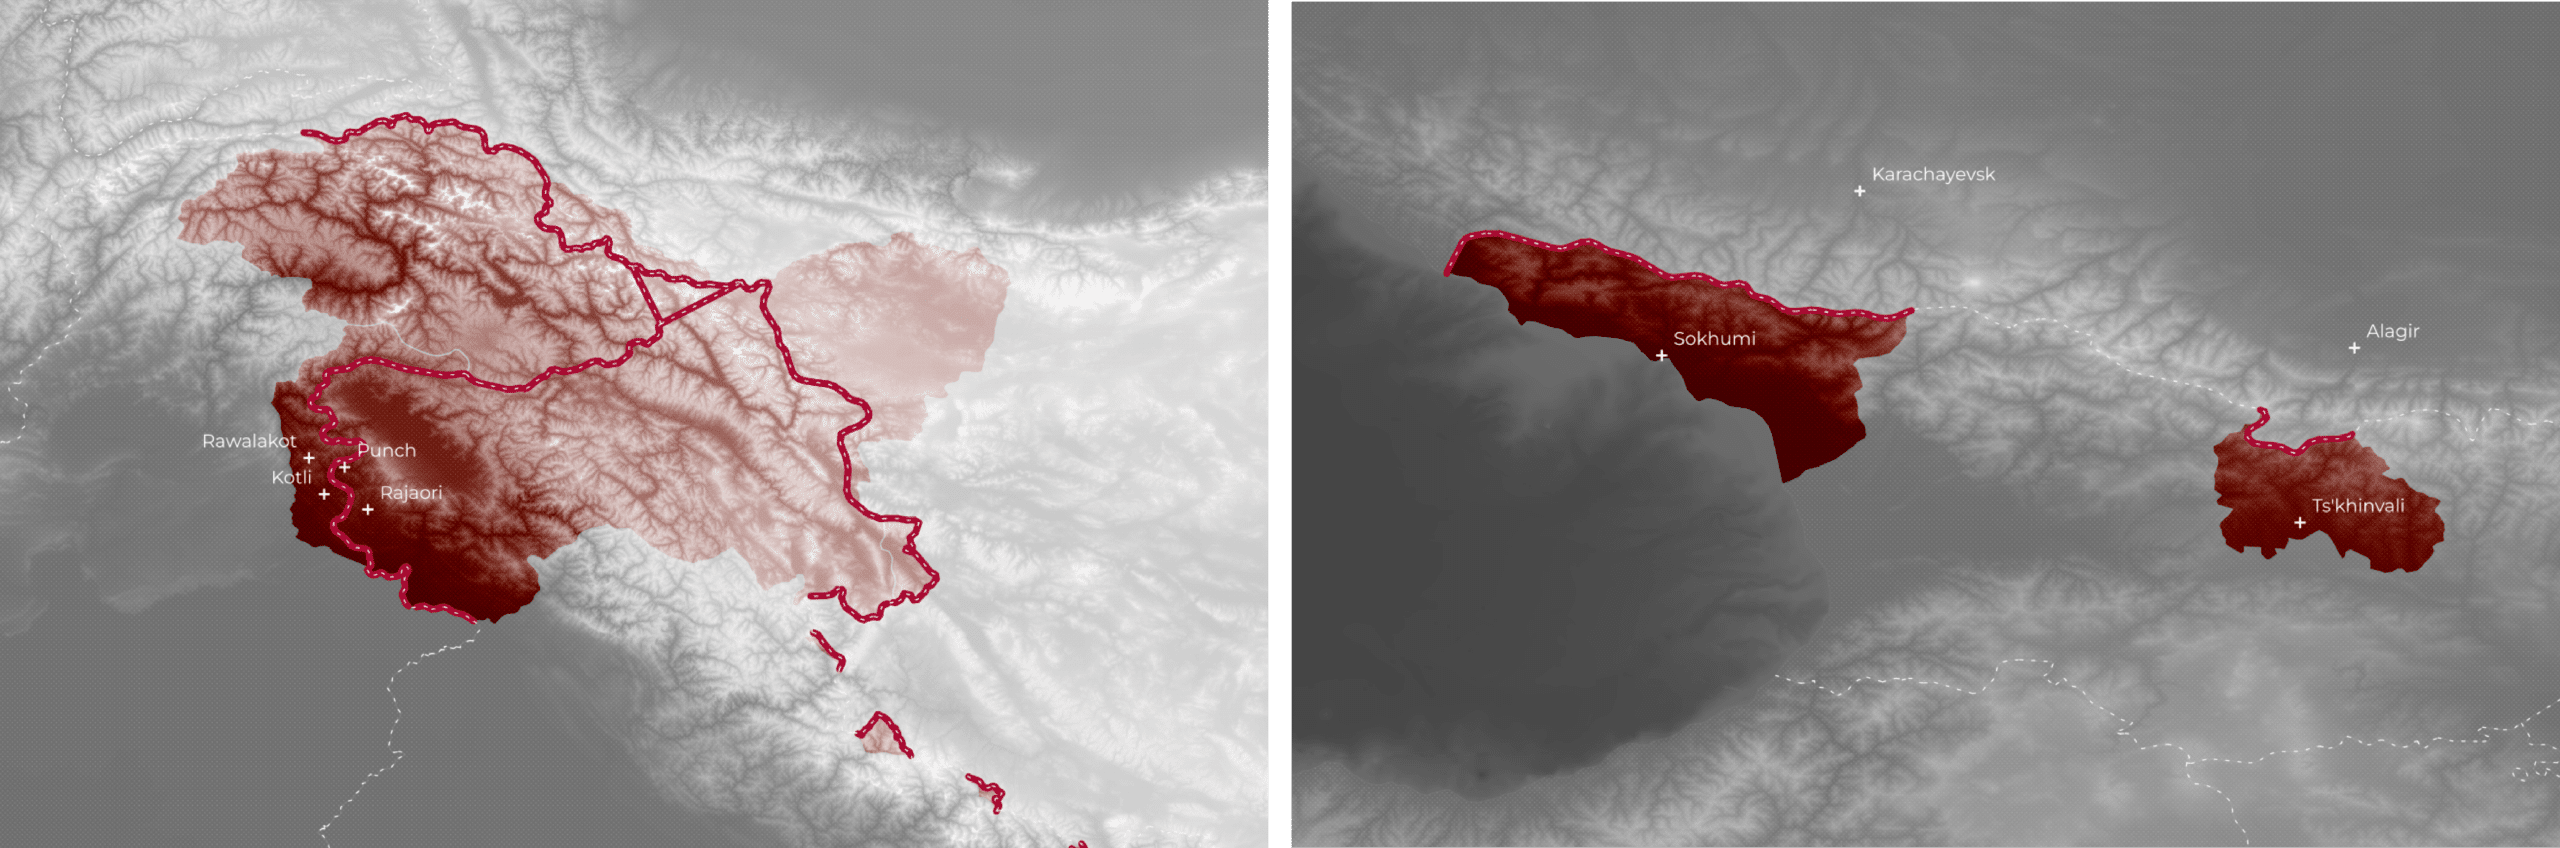
Model 1 — Zonal Raster Statistics (Geographical & Urban Layers)
This model aggregates continuous raster data within a fixed buffer along each border segment.
Layers analyzed: Digital Elevation Model (DEM), GHSL Built-Up Surface, GHSL Population Density
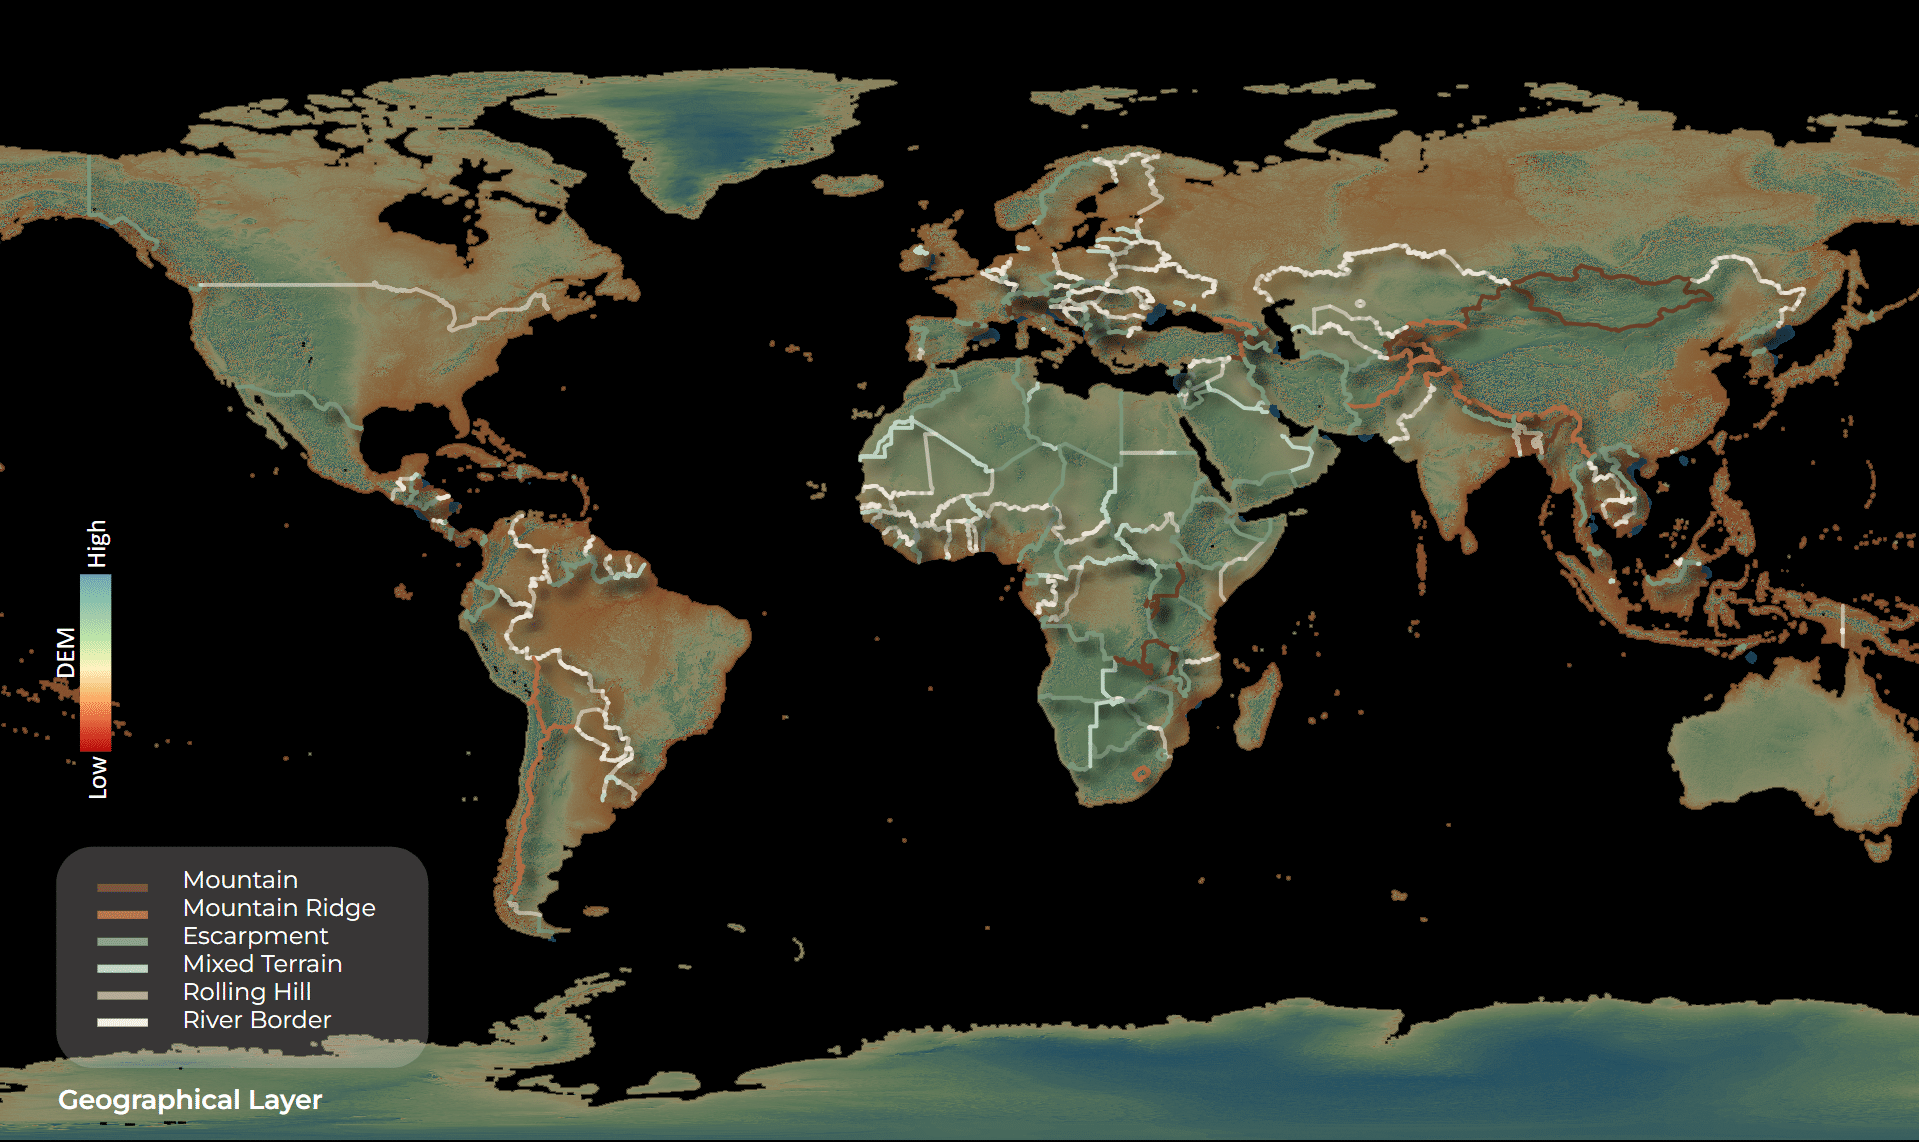
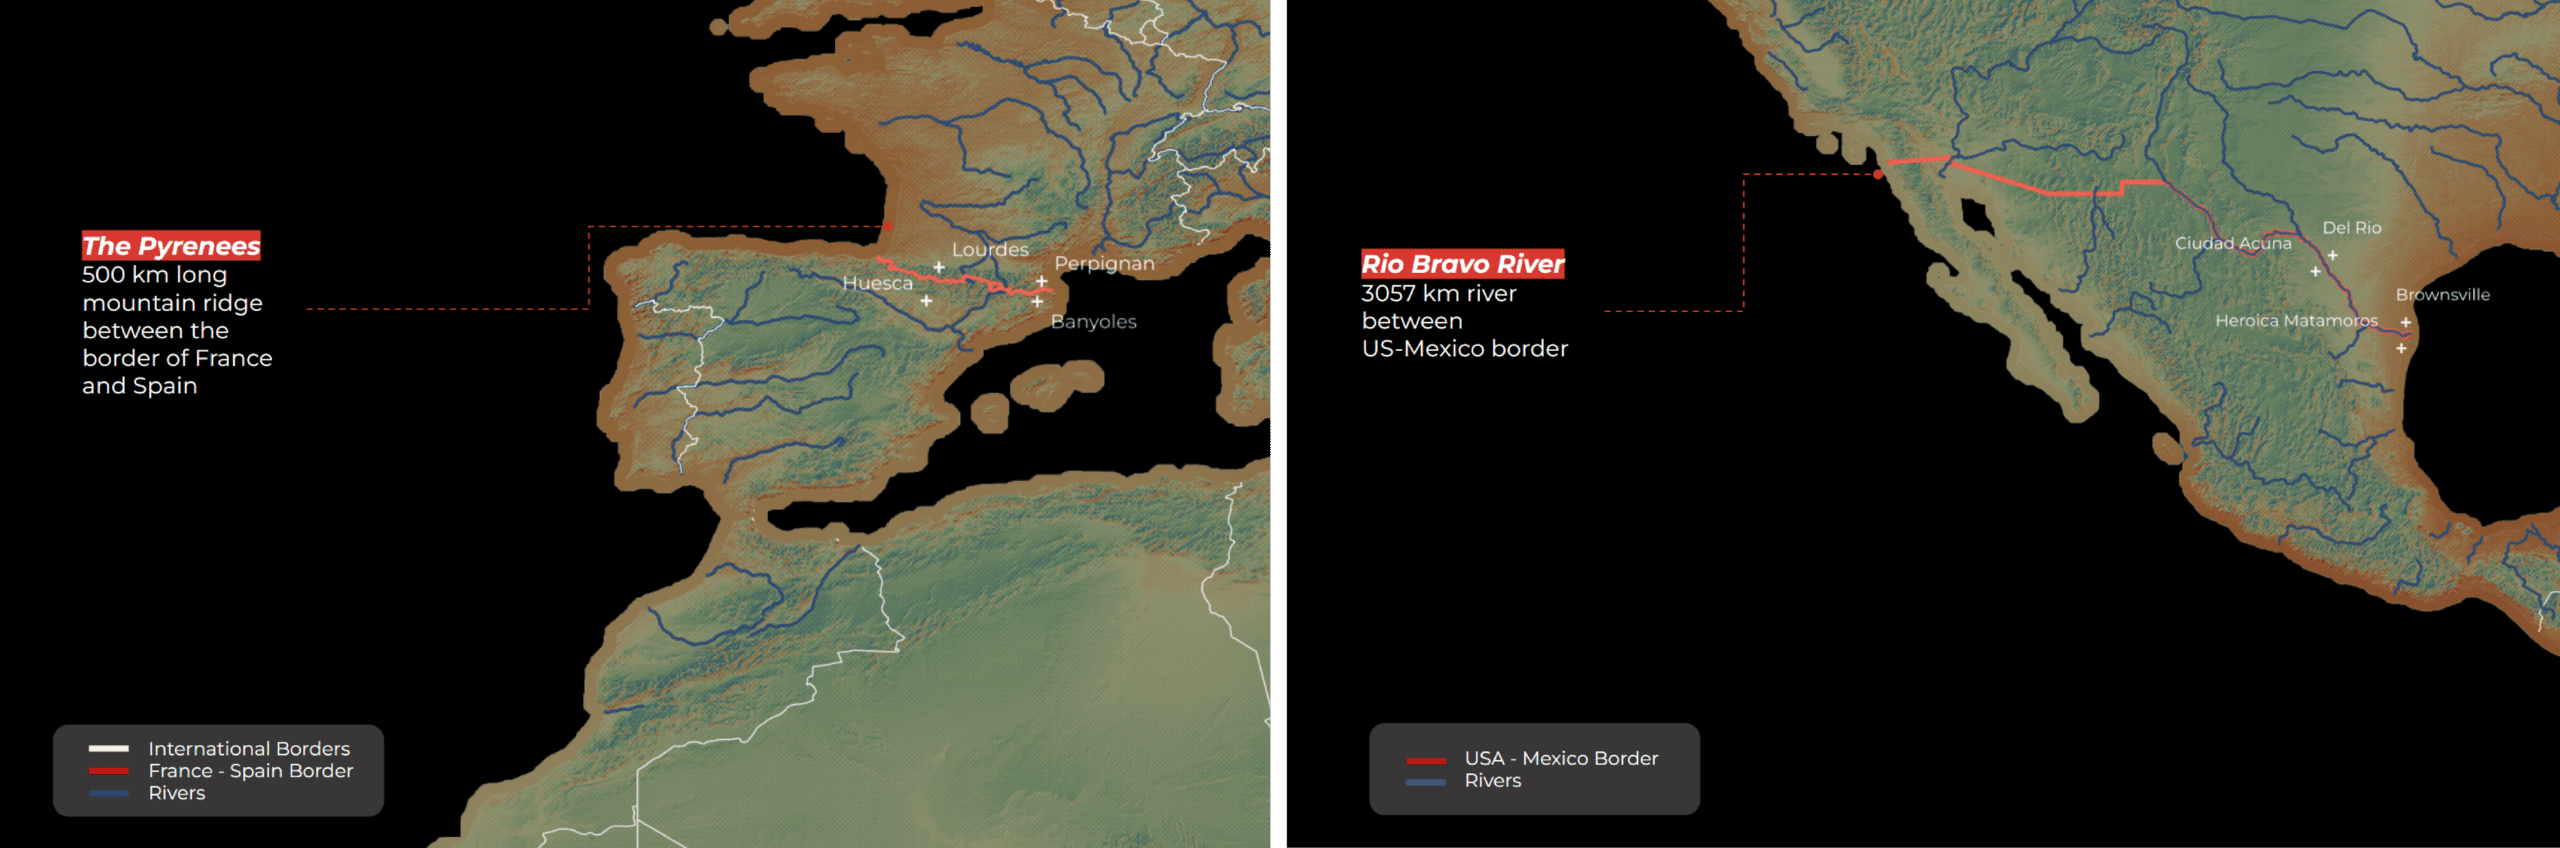
These layers reveal how natural landforms and urbanization patterns interact with borders. Results highlight borders shaped by mountain ridges, rivers, escarpments, and flat plains, demonstrating how geography influences mobility, defense, and settlement patterns.
_____________________________________________________________________________________________________________________________________________________________________
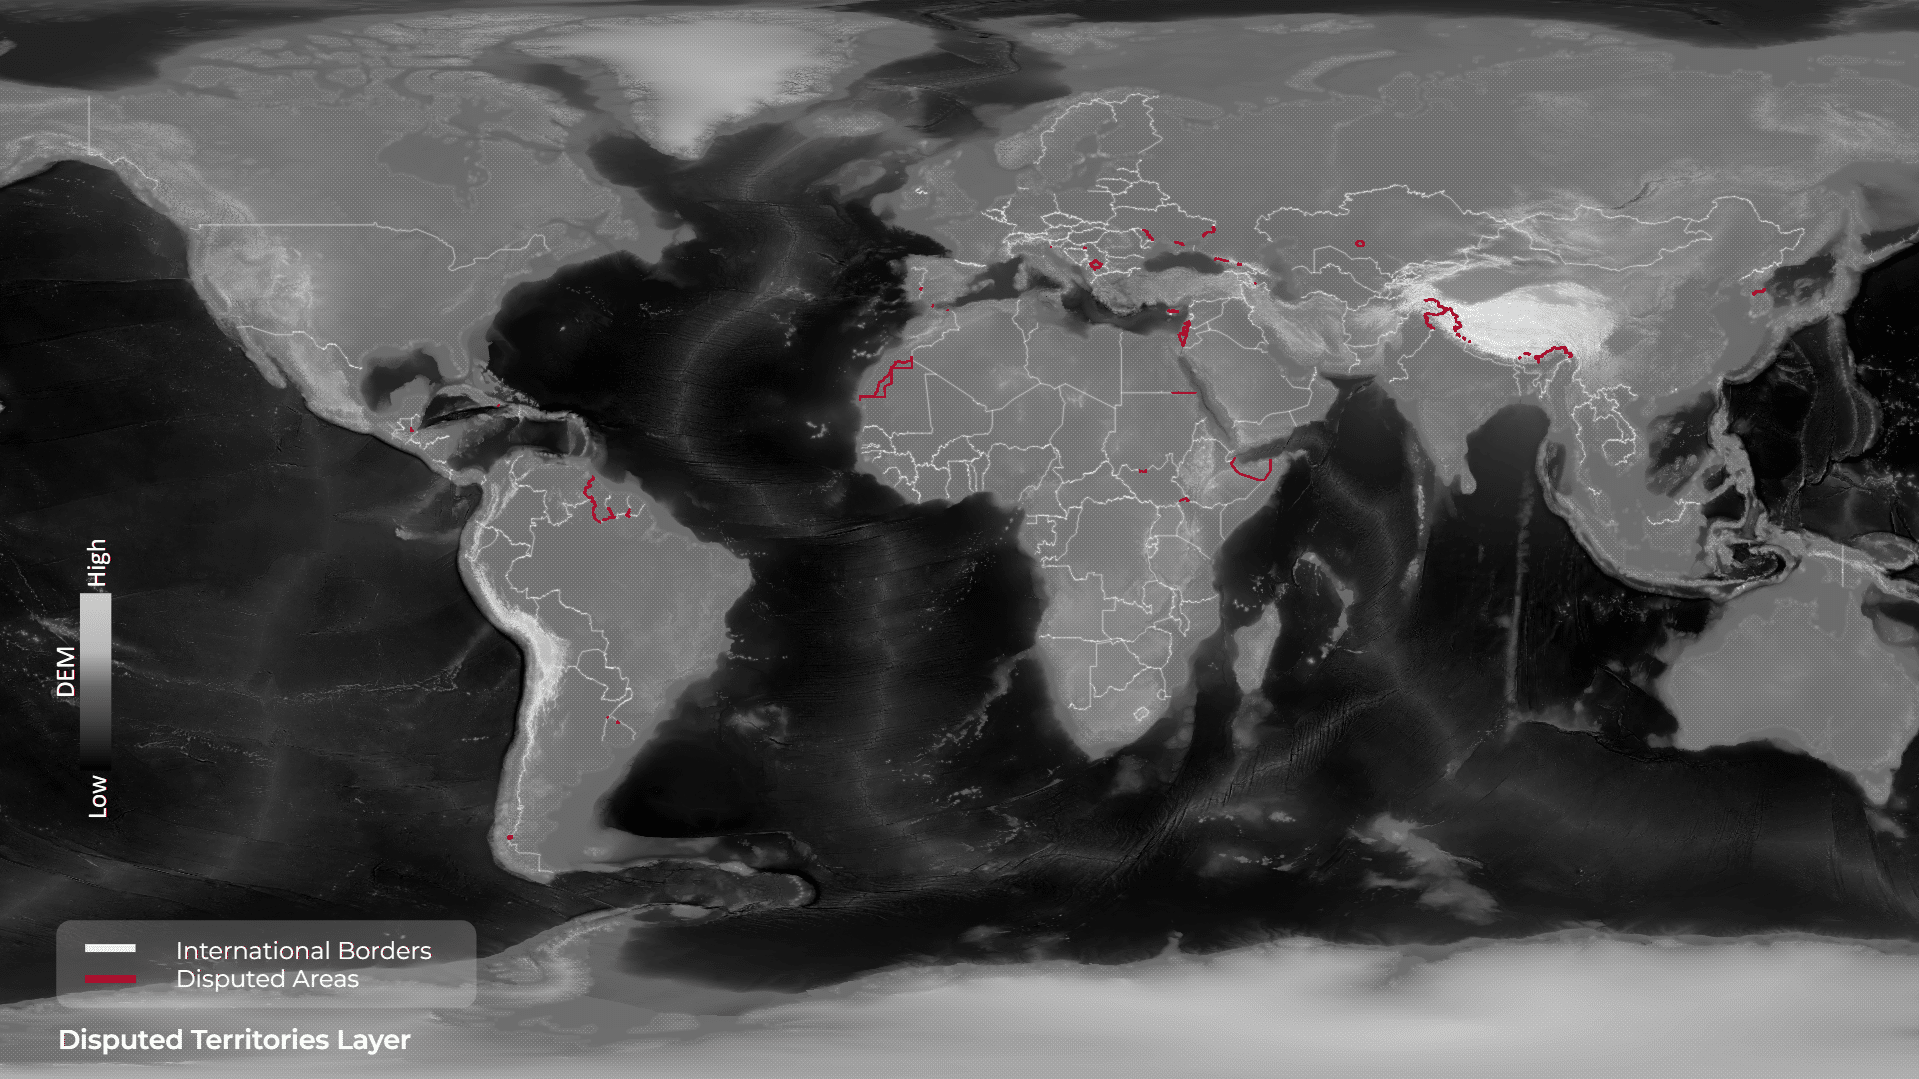
Model 2 — Linear Intersection Density (Infrastructure & Disputed Borders)
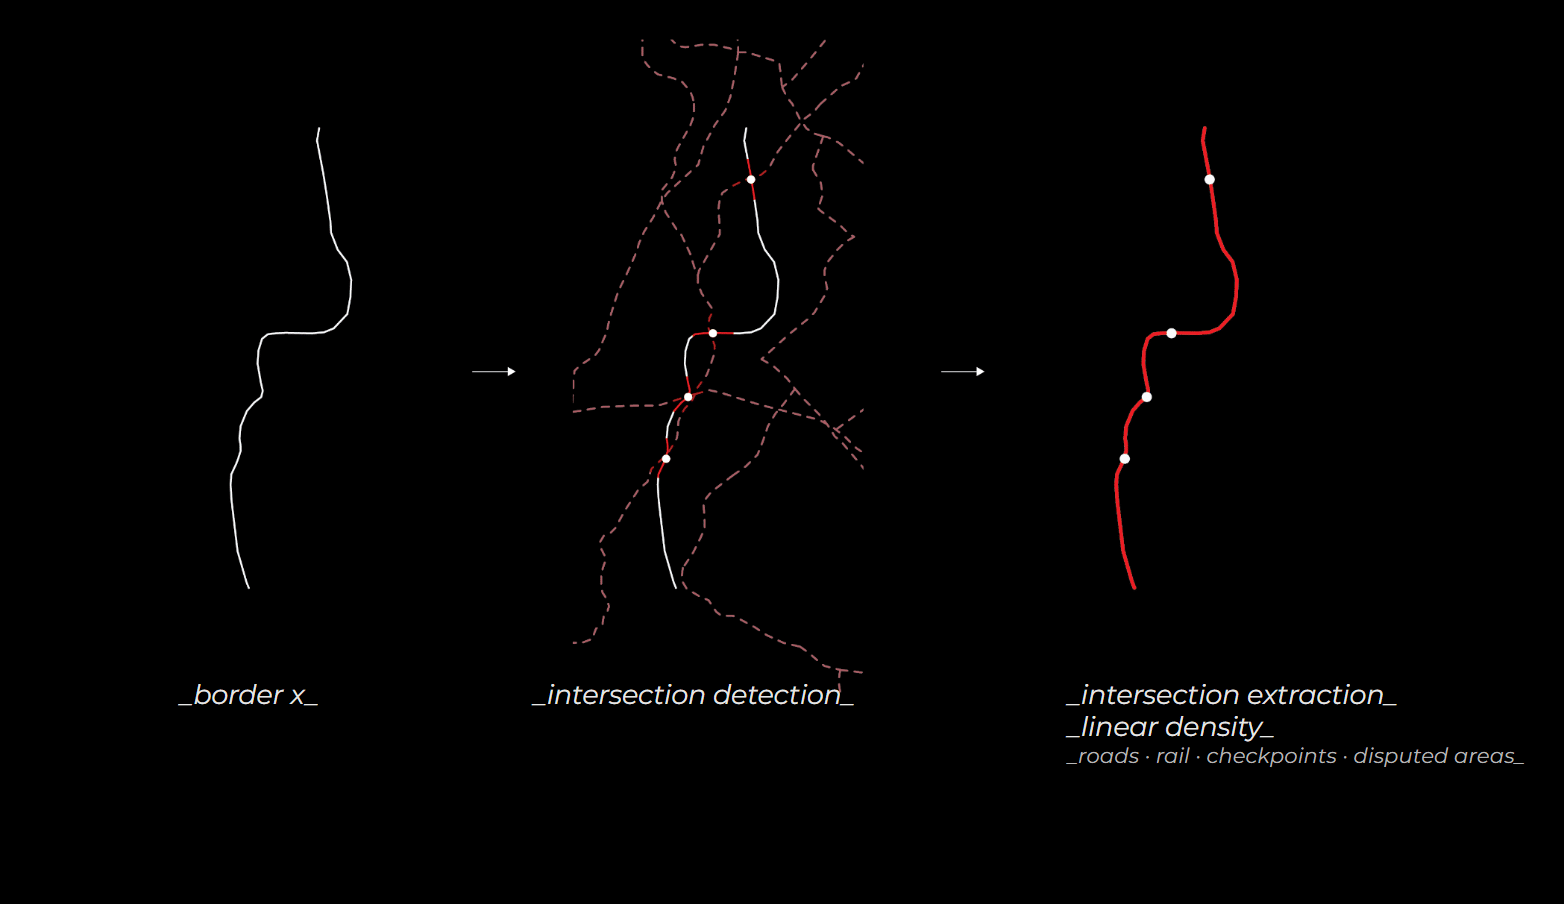
Linear datasets such as roads, railways, and disputed boundaries were analyzed by counting their intersections with border lines.
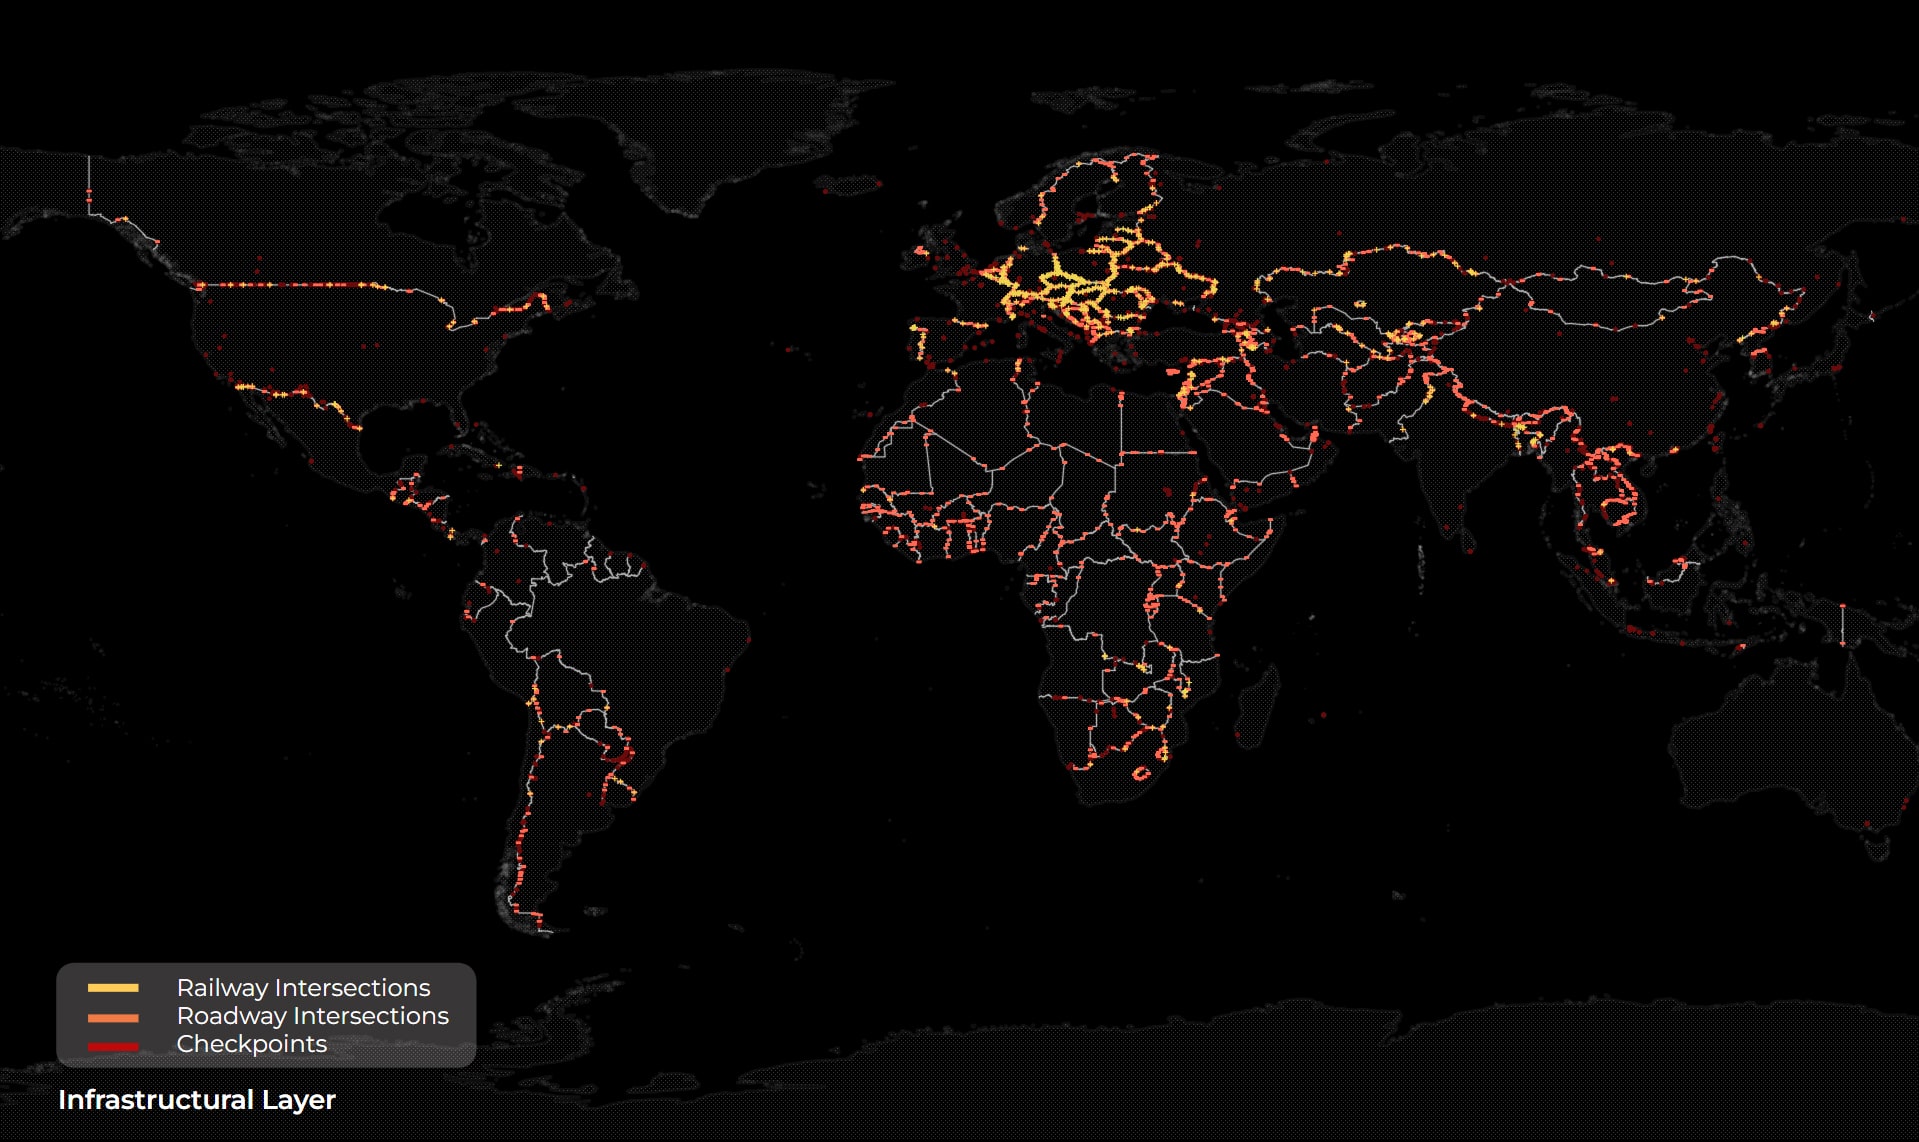
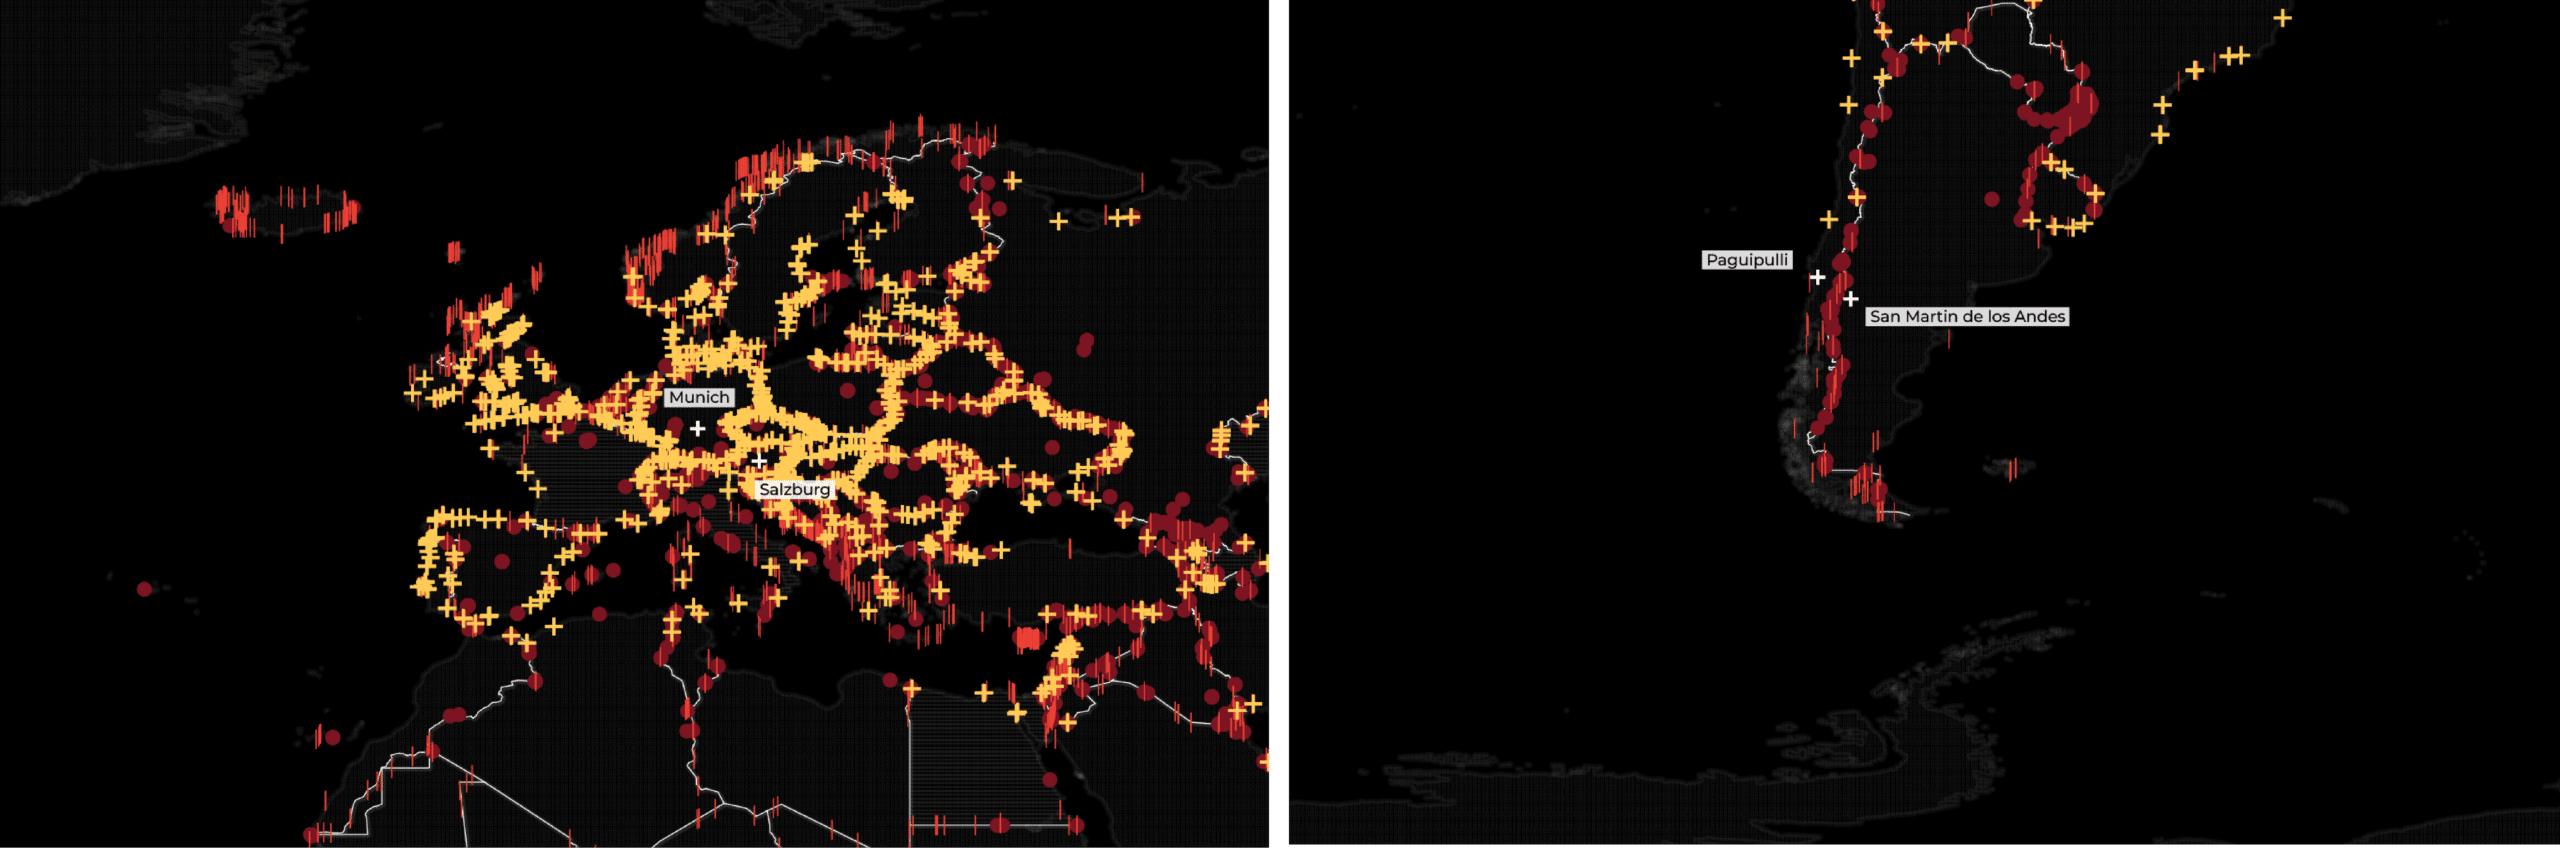
This model reveals: Highly connected borders with frequent crossings, Controlled borders with limited gateways, Disputed and militarized zones with restricted movement
Infrastructure density becomes a proxy for permeability, trade, and political openness.
_____________________________________________________________________________________________________________________________________________________________________
Model 3 — Polygonal Attribute Overlay (Urban & Ecological Layers)
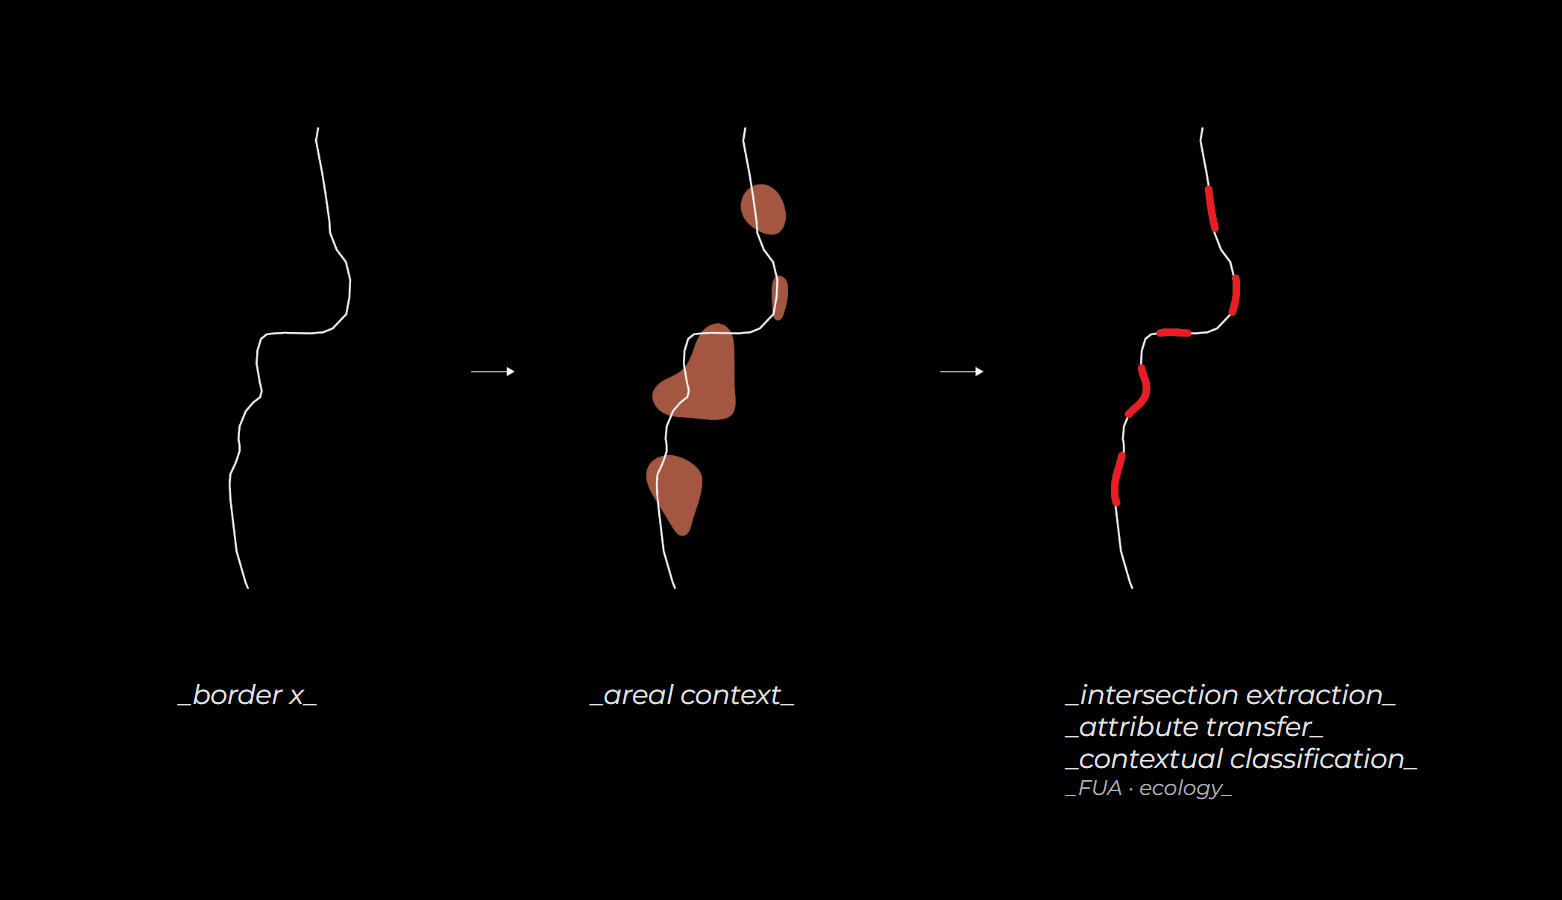
Polygon-based datasets were spatially intersected with border buffers to transfer their attributes to border segments.
Key datasets: Functional Urban Areas (FUAs), Ecological and protected areas
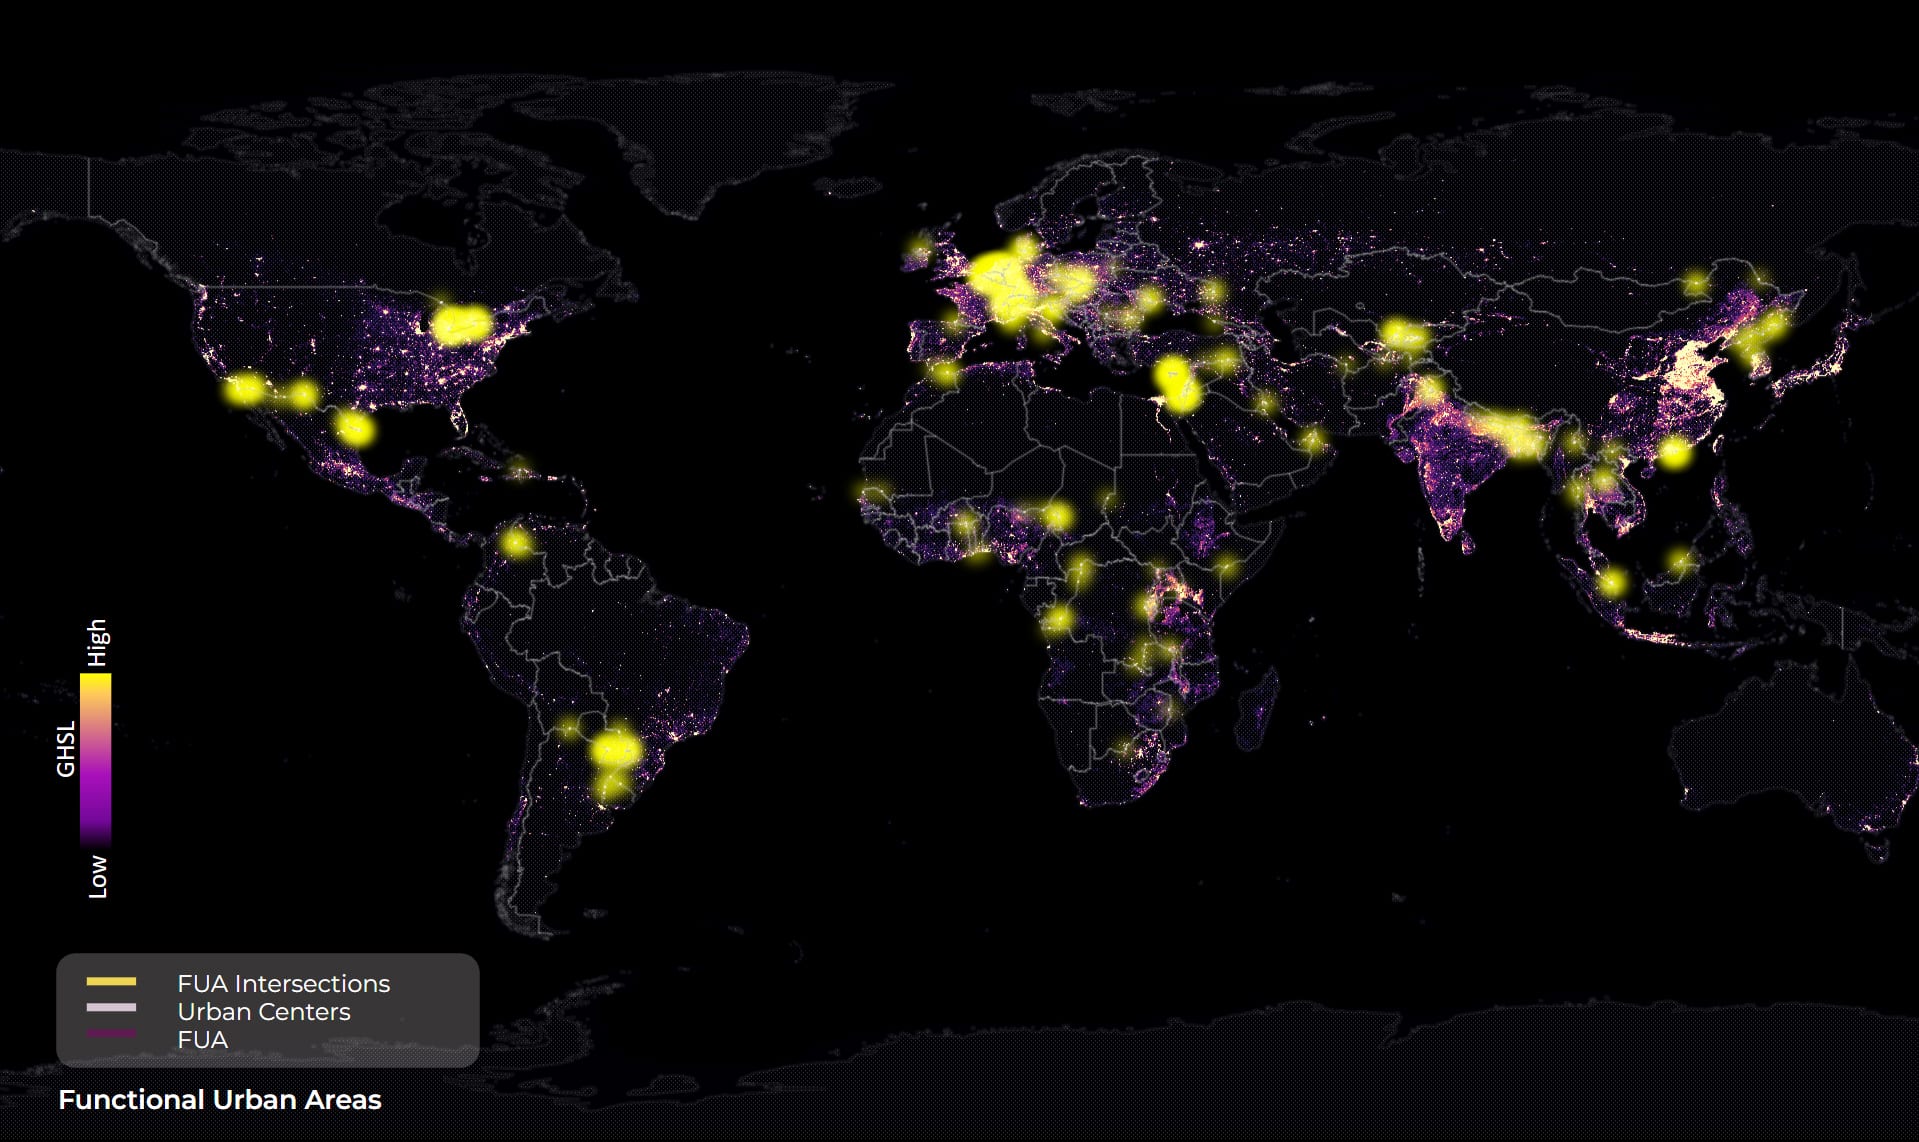
This analysis shows how some urban regions transcend borders through commuting and economic integration, while others stop abruptly.
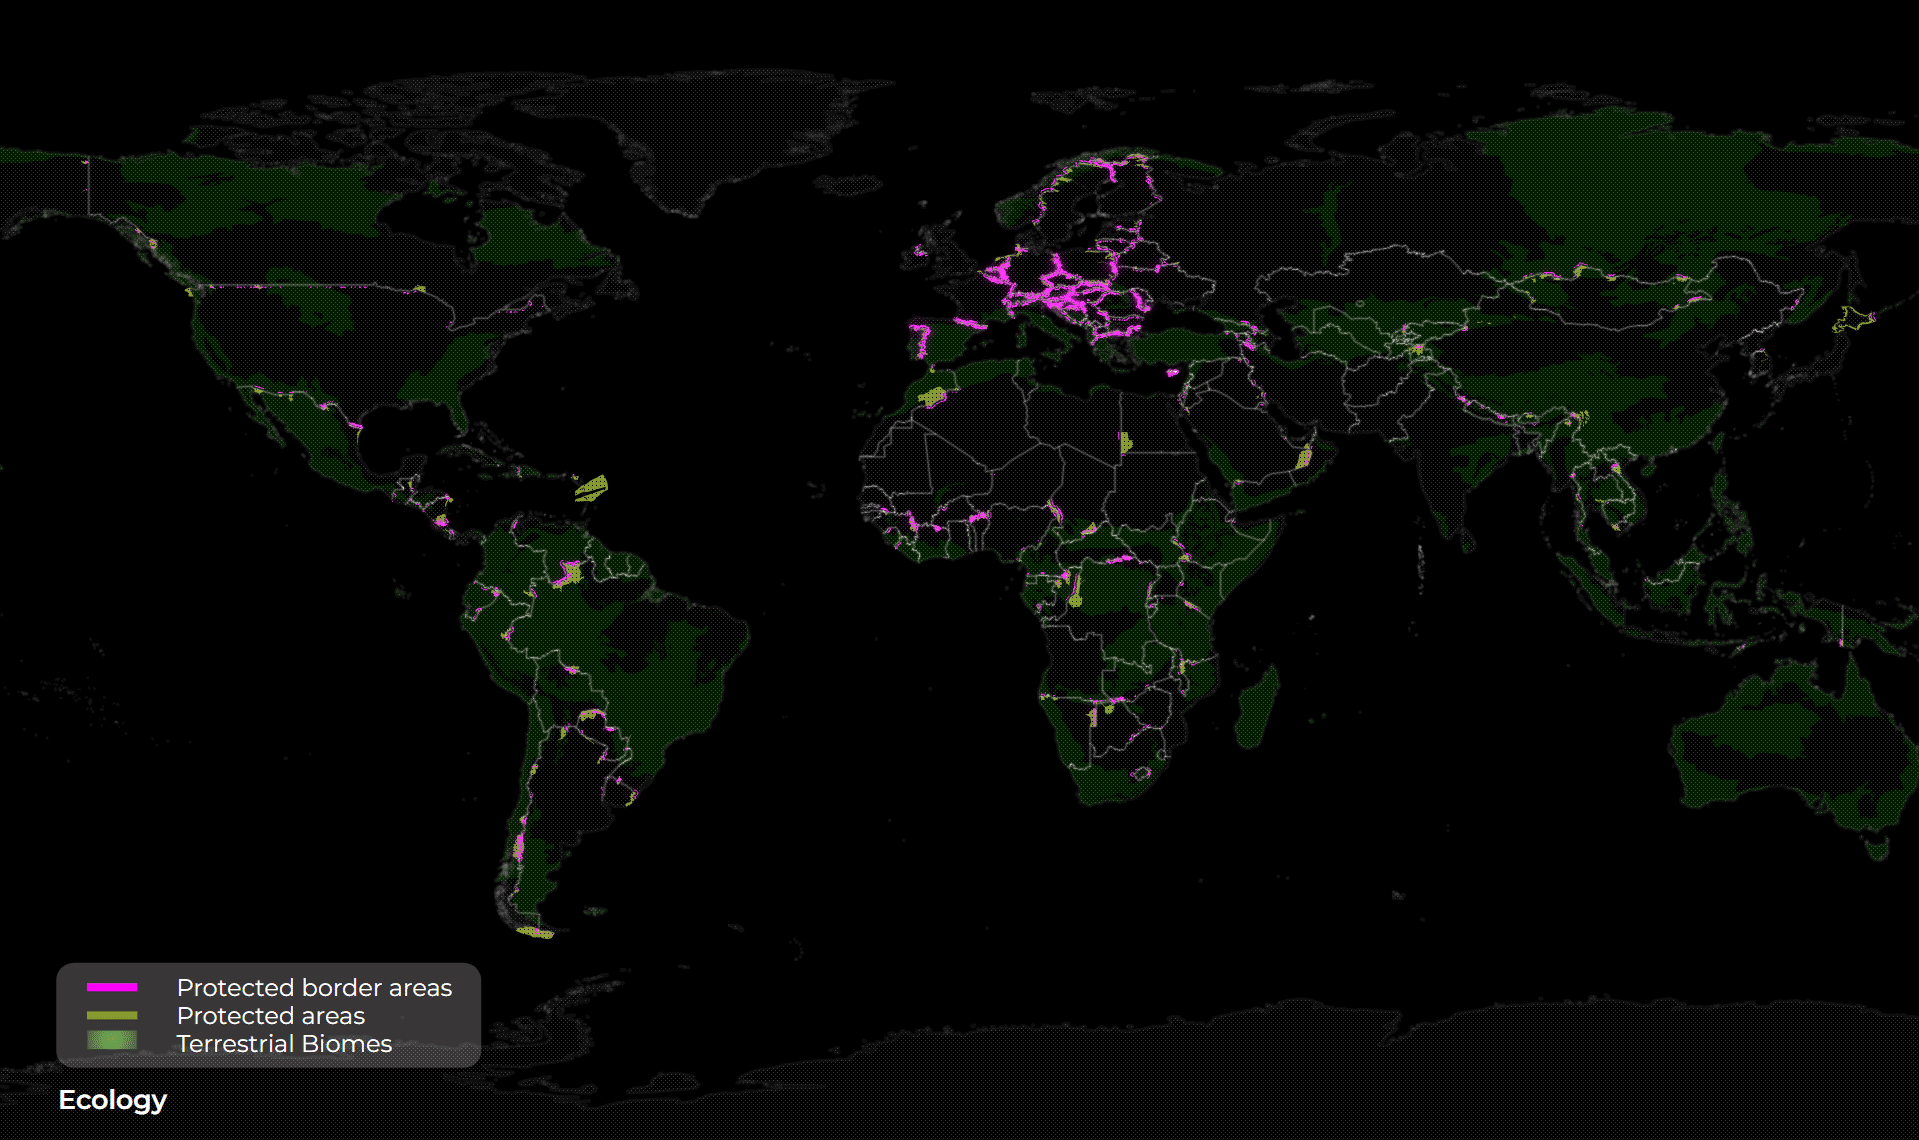
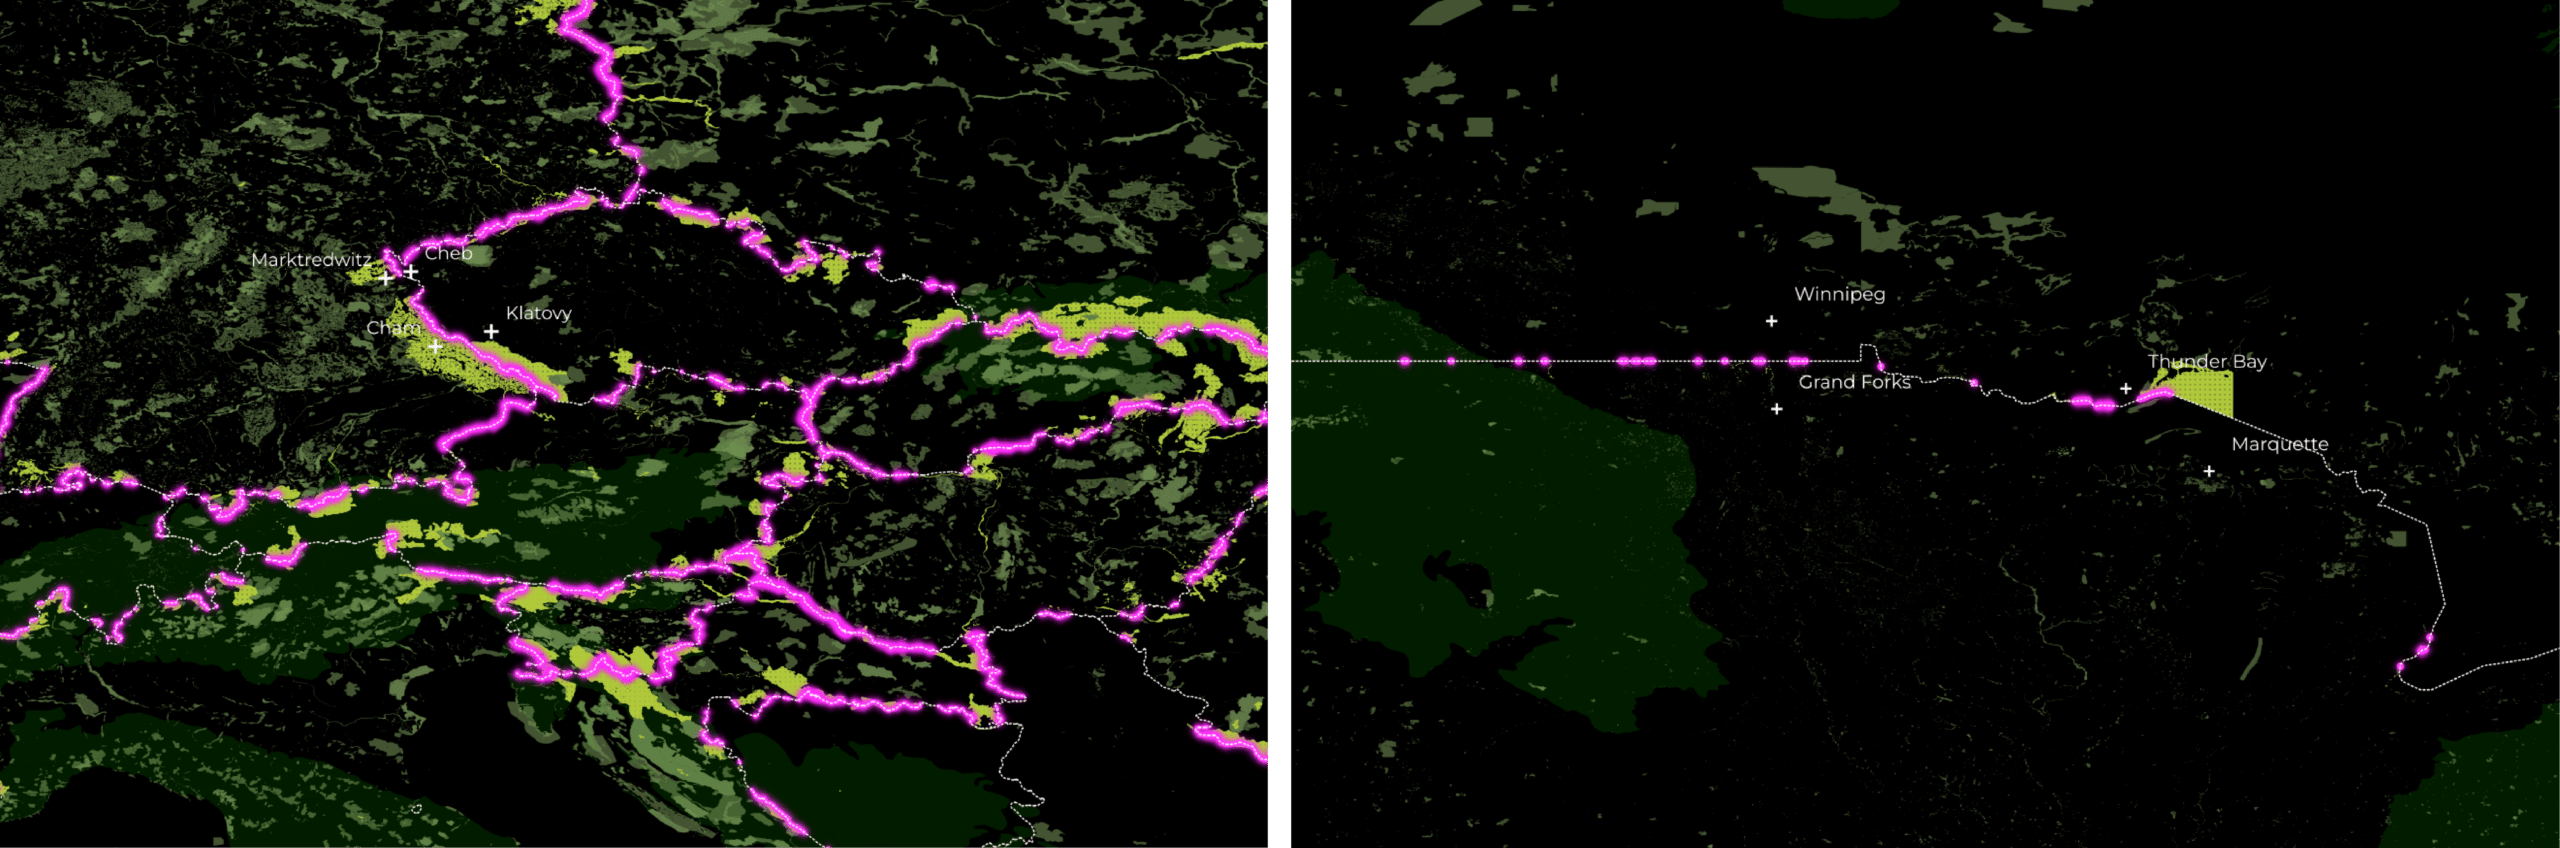
Ecological layers reveal how borders often cut through sensitive landscapes, creating fragmented governance and conservation challenges.
_____________________________________________________________________________________________________________________________________________________________________
Model 4 — Bilateral Similarity Index (Sociocultural Layers)
This model quantifies similarity between the two countries sharing a border by comparing attributes on each side.
Applied to: Language distributions, Ethnic composition
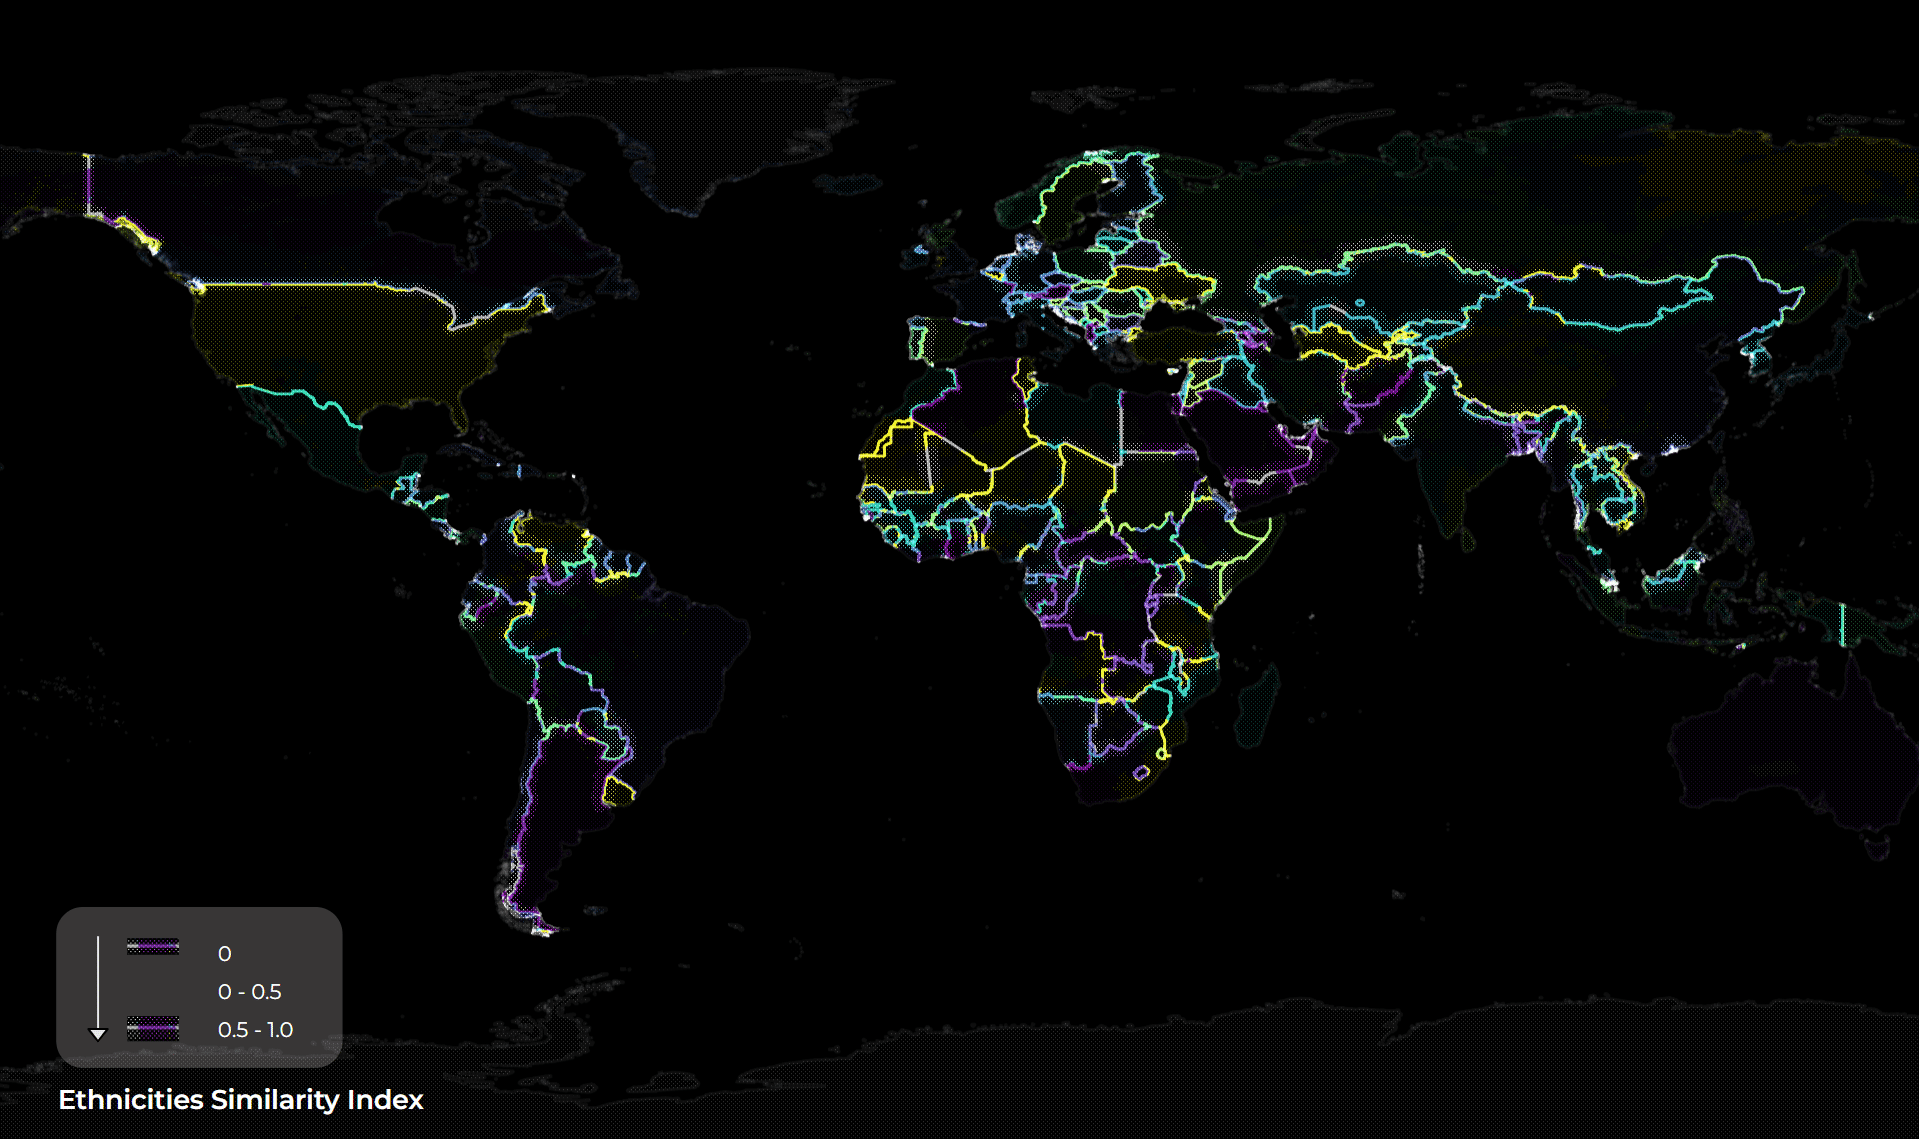
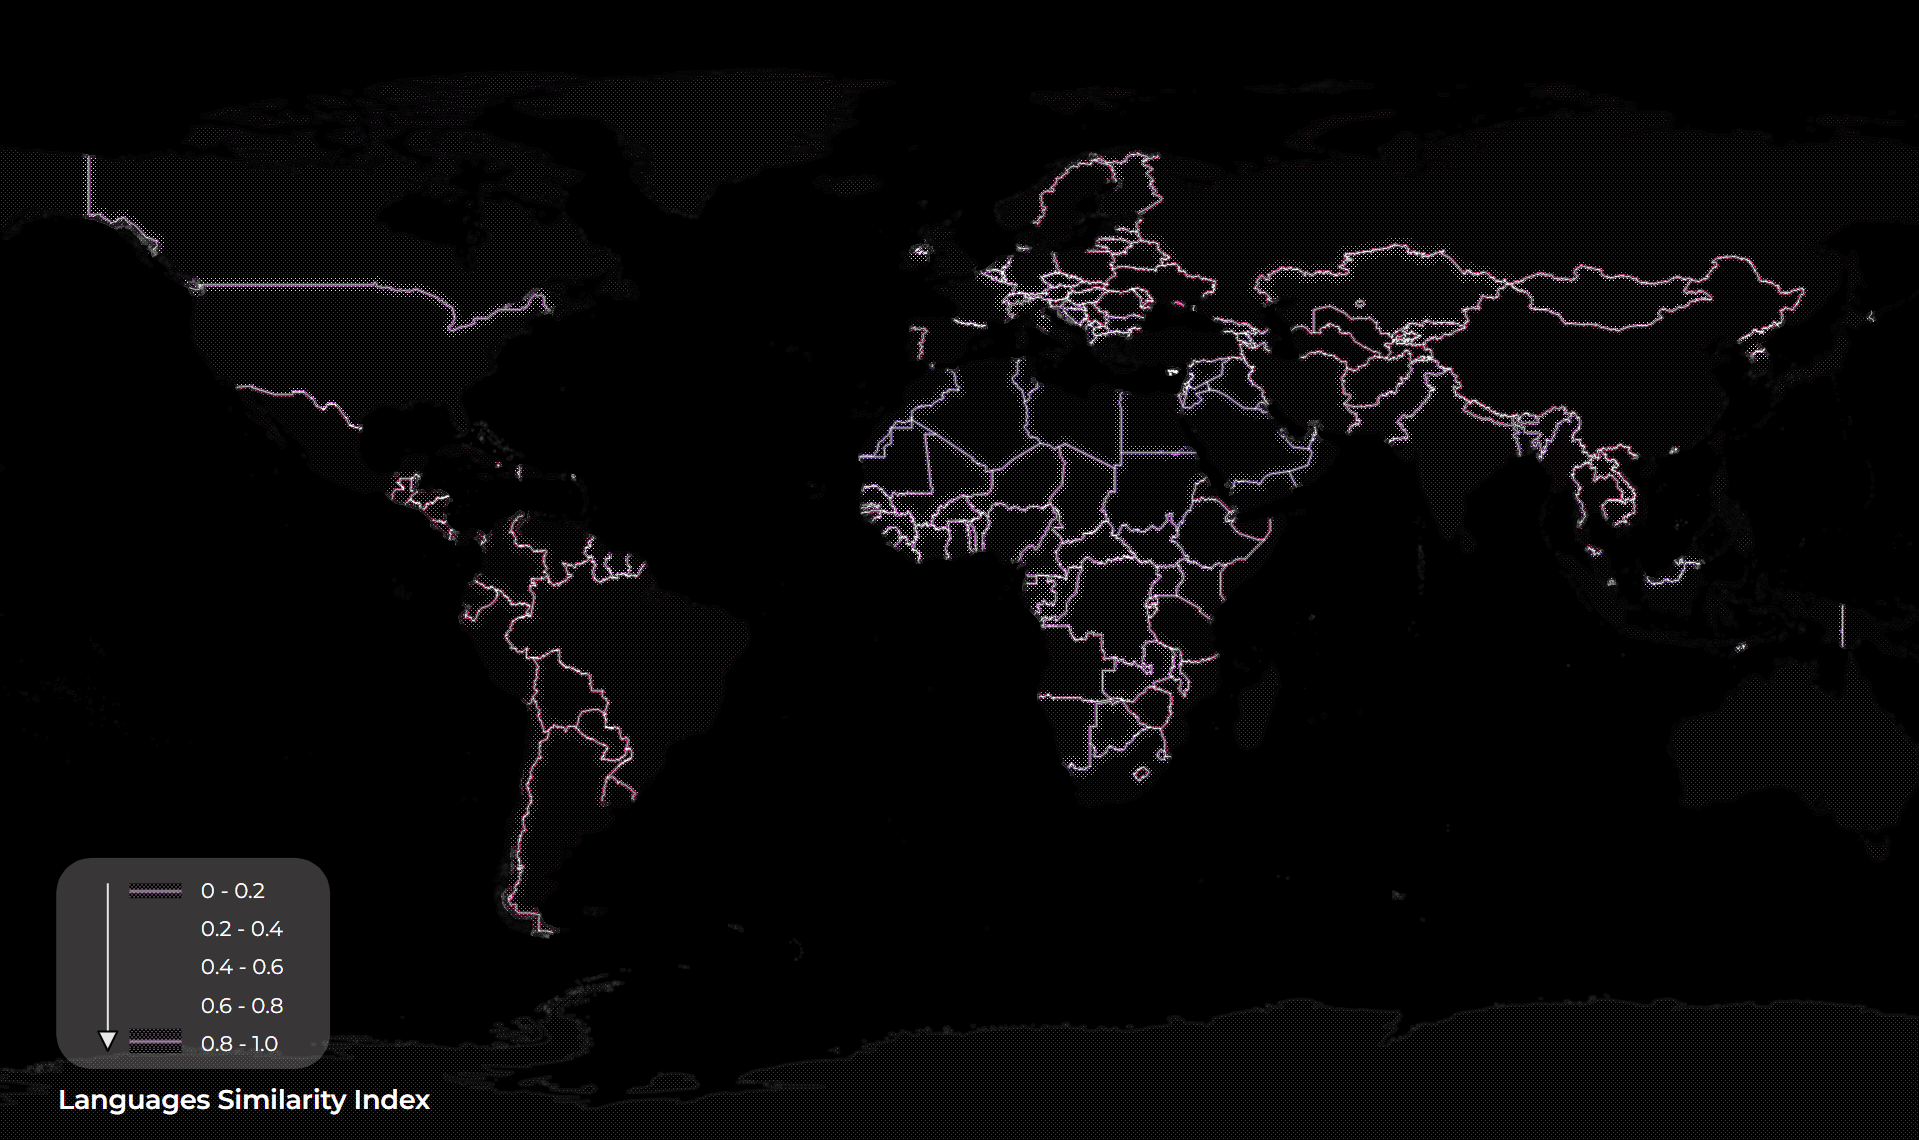
The resulting similarity indices reveal where borders divide socially aligned populations and where they separate culturally distinct regions, highlighting borders as zones of continuity, rupture, or negotiation.
_____________________________________________________________________________________________________________________________________________________________________
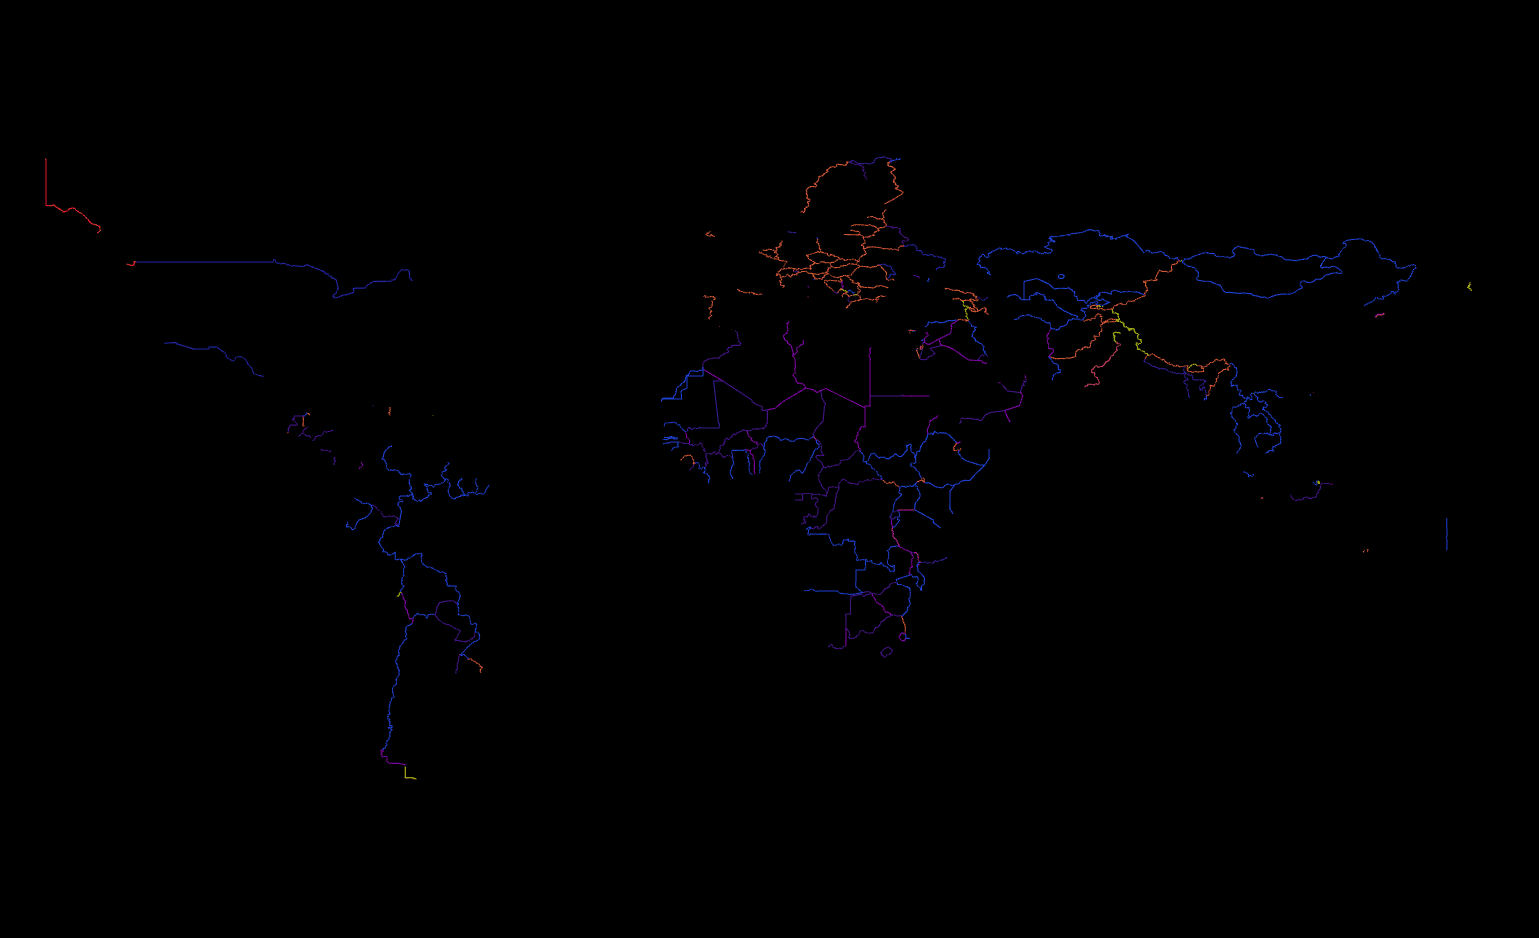
The Atlas
All outputs from Phase 1 were consolidated into a single geospatial dataset: a border atlas comprising 515 international borders and 38 derived attributes.
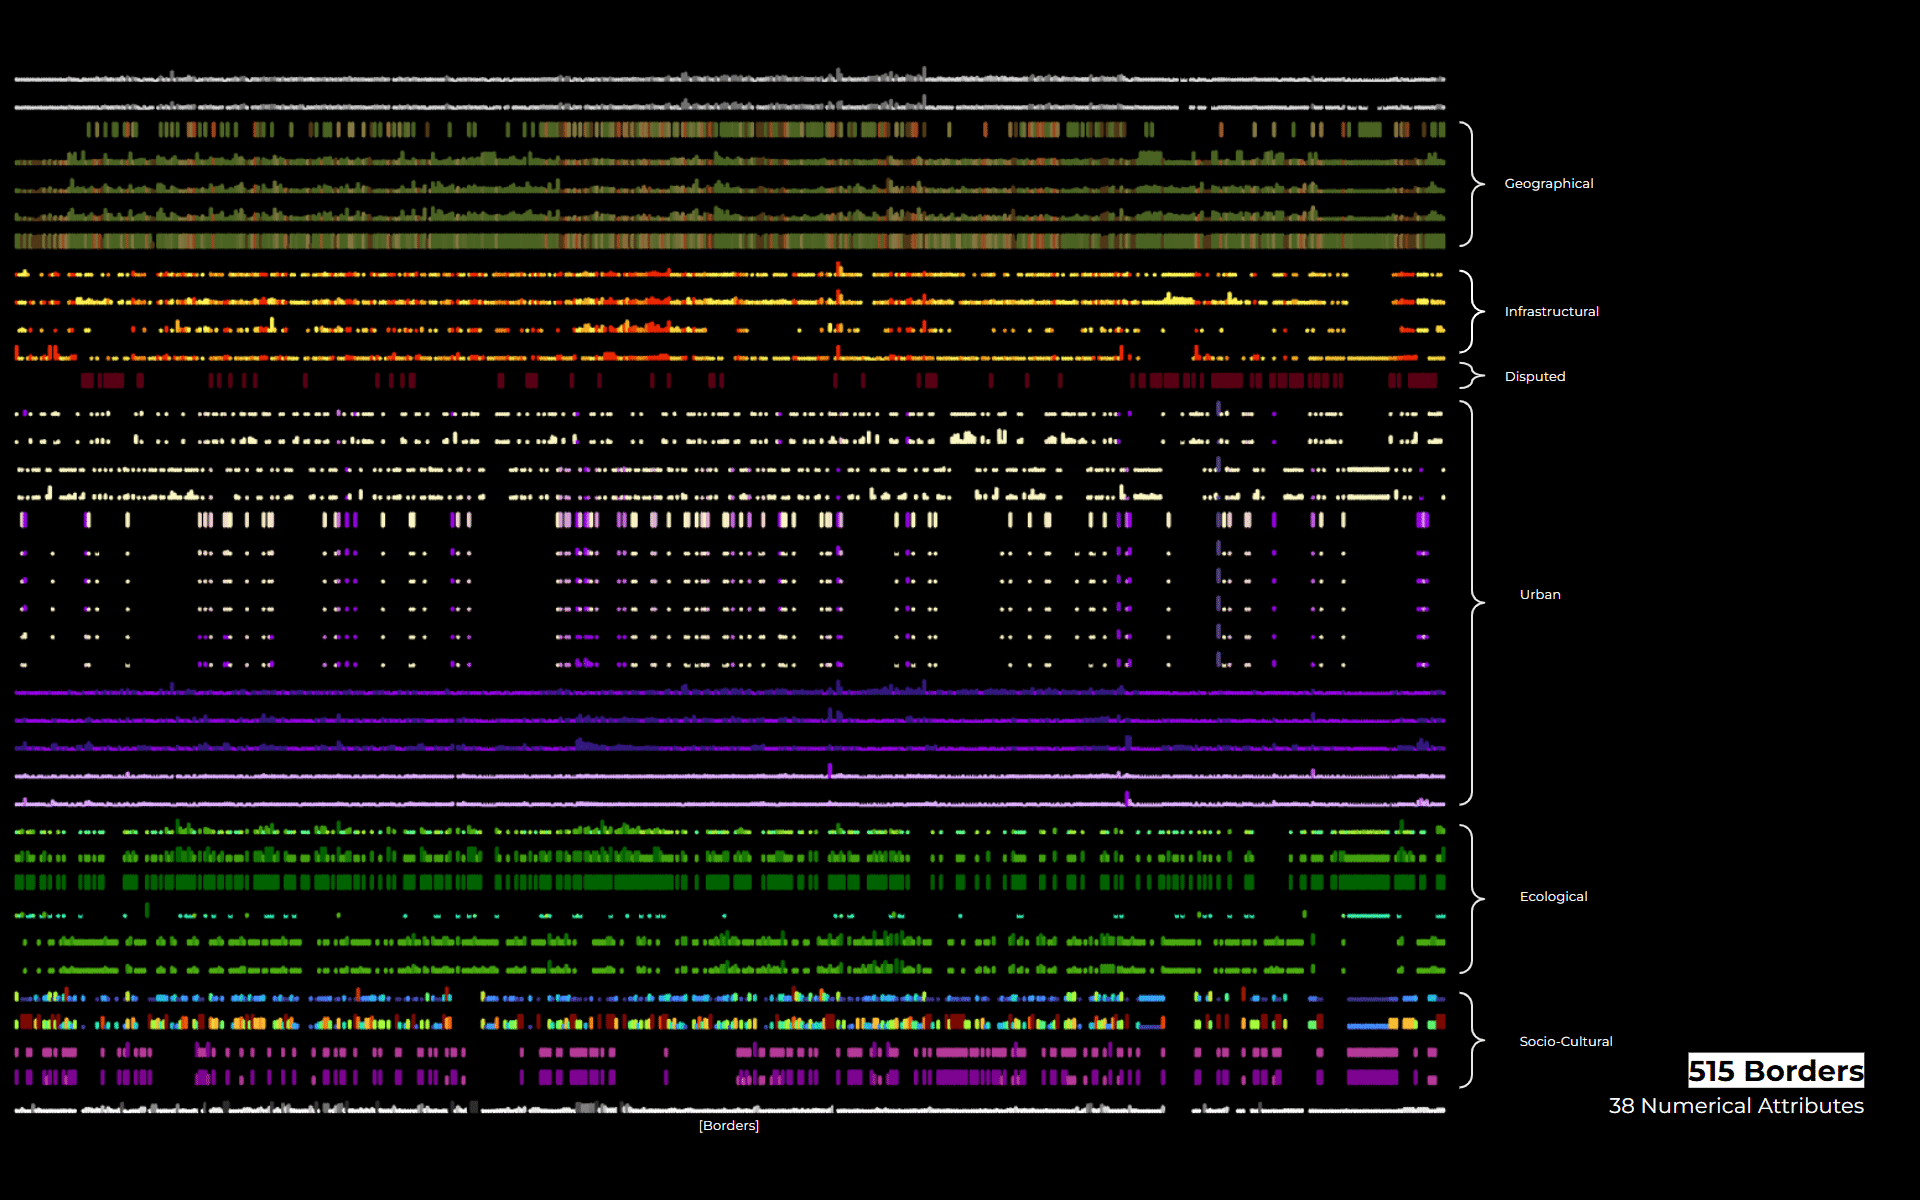
The atlas functions as both a visual and analytical tool, enabling comparative analysis across geographical, infrastructural, ecological, urban, political, and sociocultural dimensions.
_____________________________________________________________________________________________________________________________________________________________________
VI. Phase 2 — Border Clustering & Typologies
In Phase 2, similarity-based clustering techniques were applied to the atlas. Methods used: Principal Component Analysis (PCA), t-SNE for dimensional visualization, DBSCAN for cluster identification
This process revealed that borders cluster according to functional characteristics rather than geographic proximity. Borders located far apart may operate similarly, while neighbouring borders may function very differently.
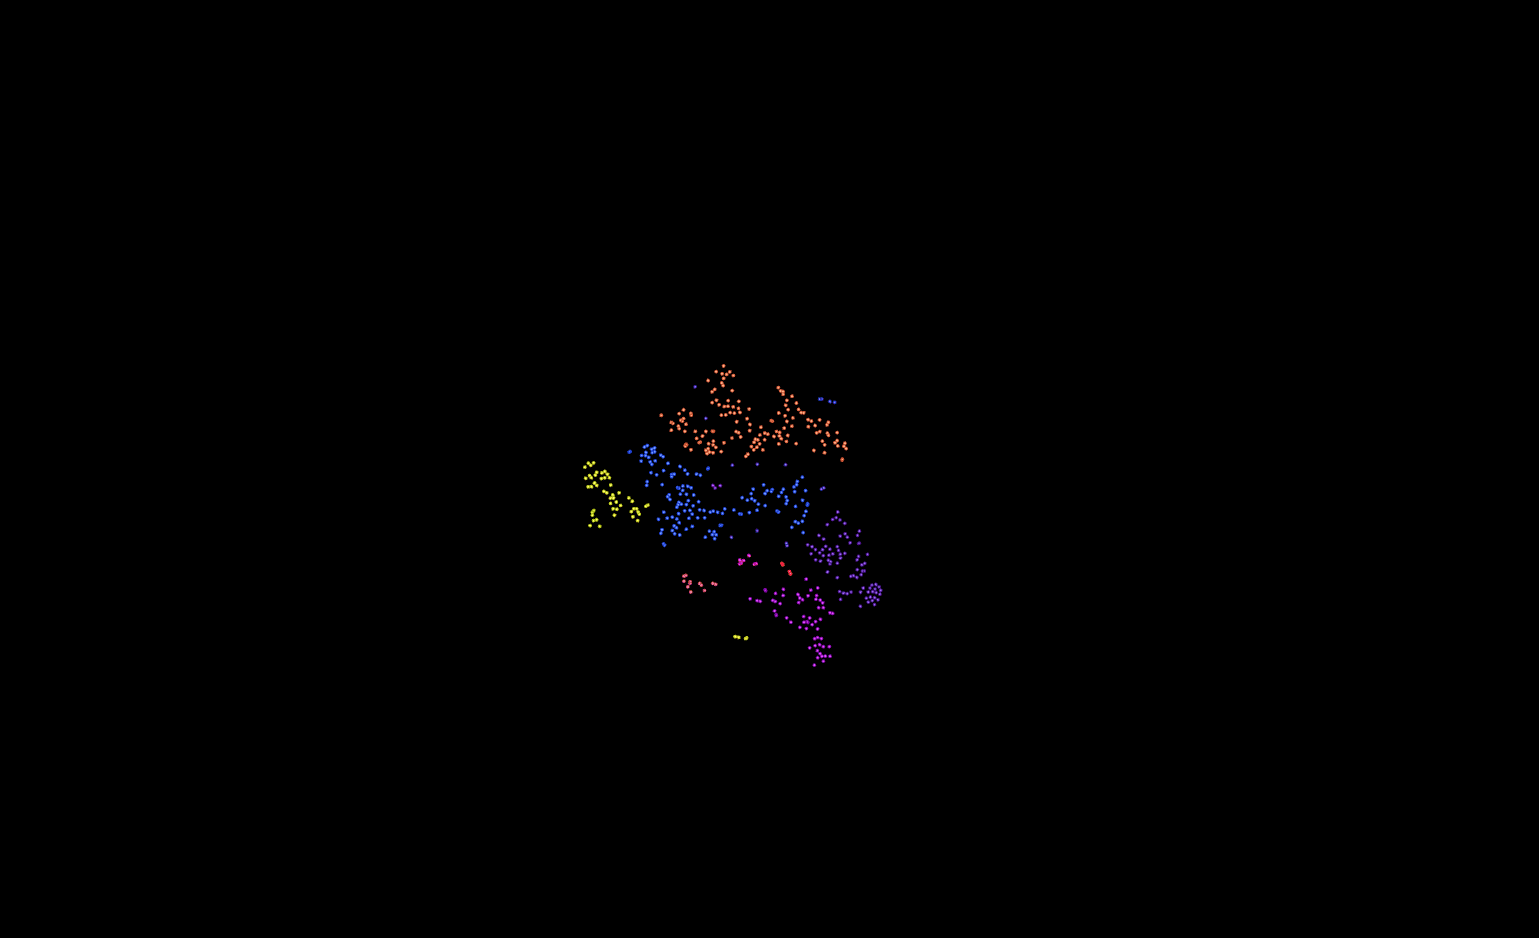
PCA > t-SNE > DBSCAN
Clusters: 14 ; Noise: 12 points ; PCA – Value : 0.8 ; t-SNE – Perplexity : 30 – Learning rate : 40 ; DBSCAN – Eps: 2.6 – Min_samples : 3
These clusters form emergent border typologies, suggesting that cities near similar borders experience comparable spatial pressures, governance challenges, and development trajectories.
_____________________________________________________________________________________________________________________________________________________________________
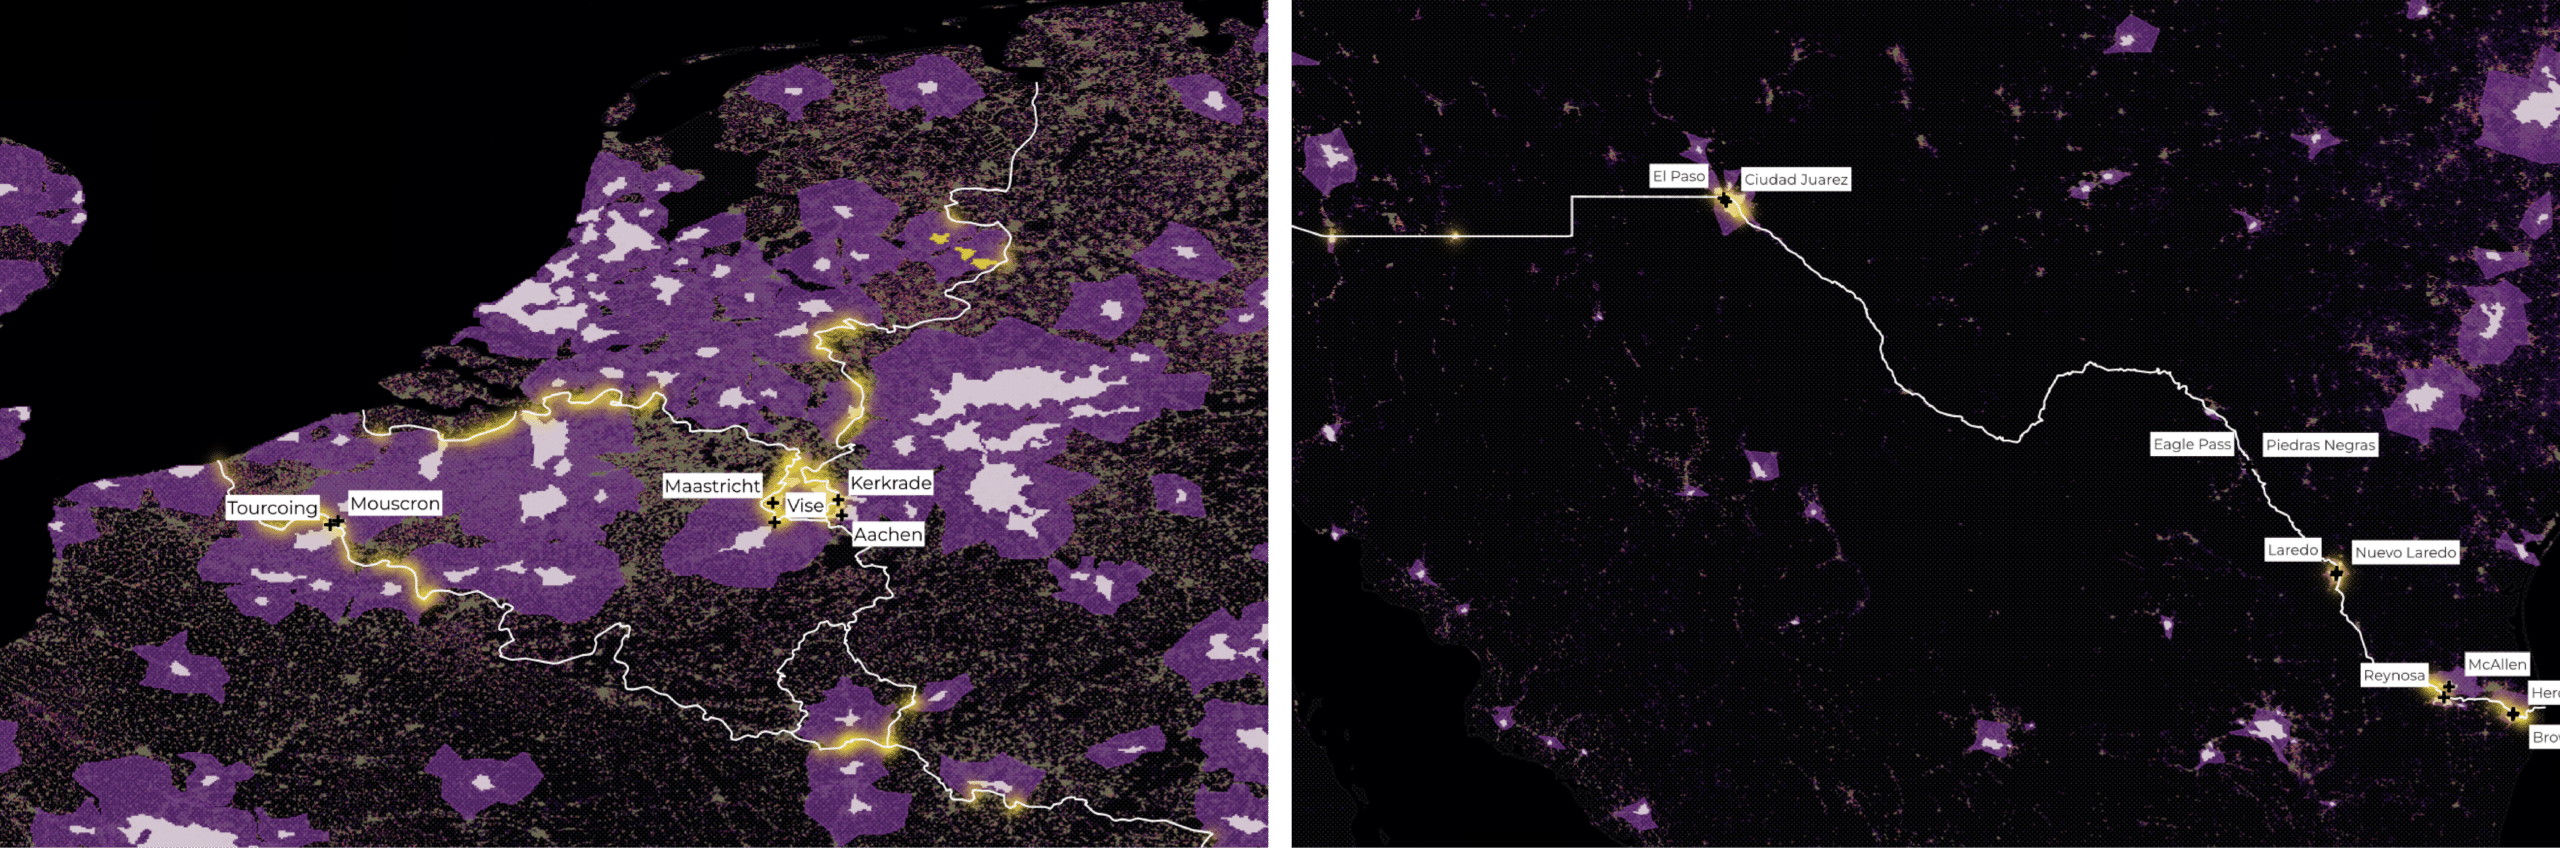
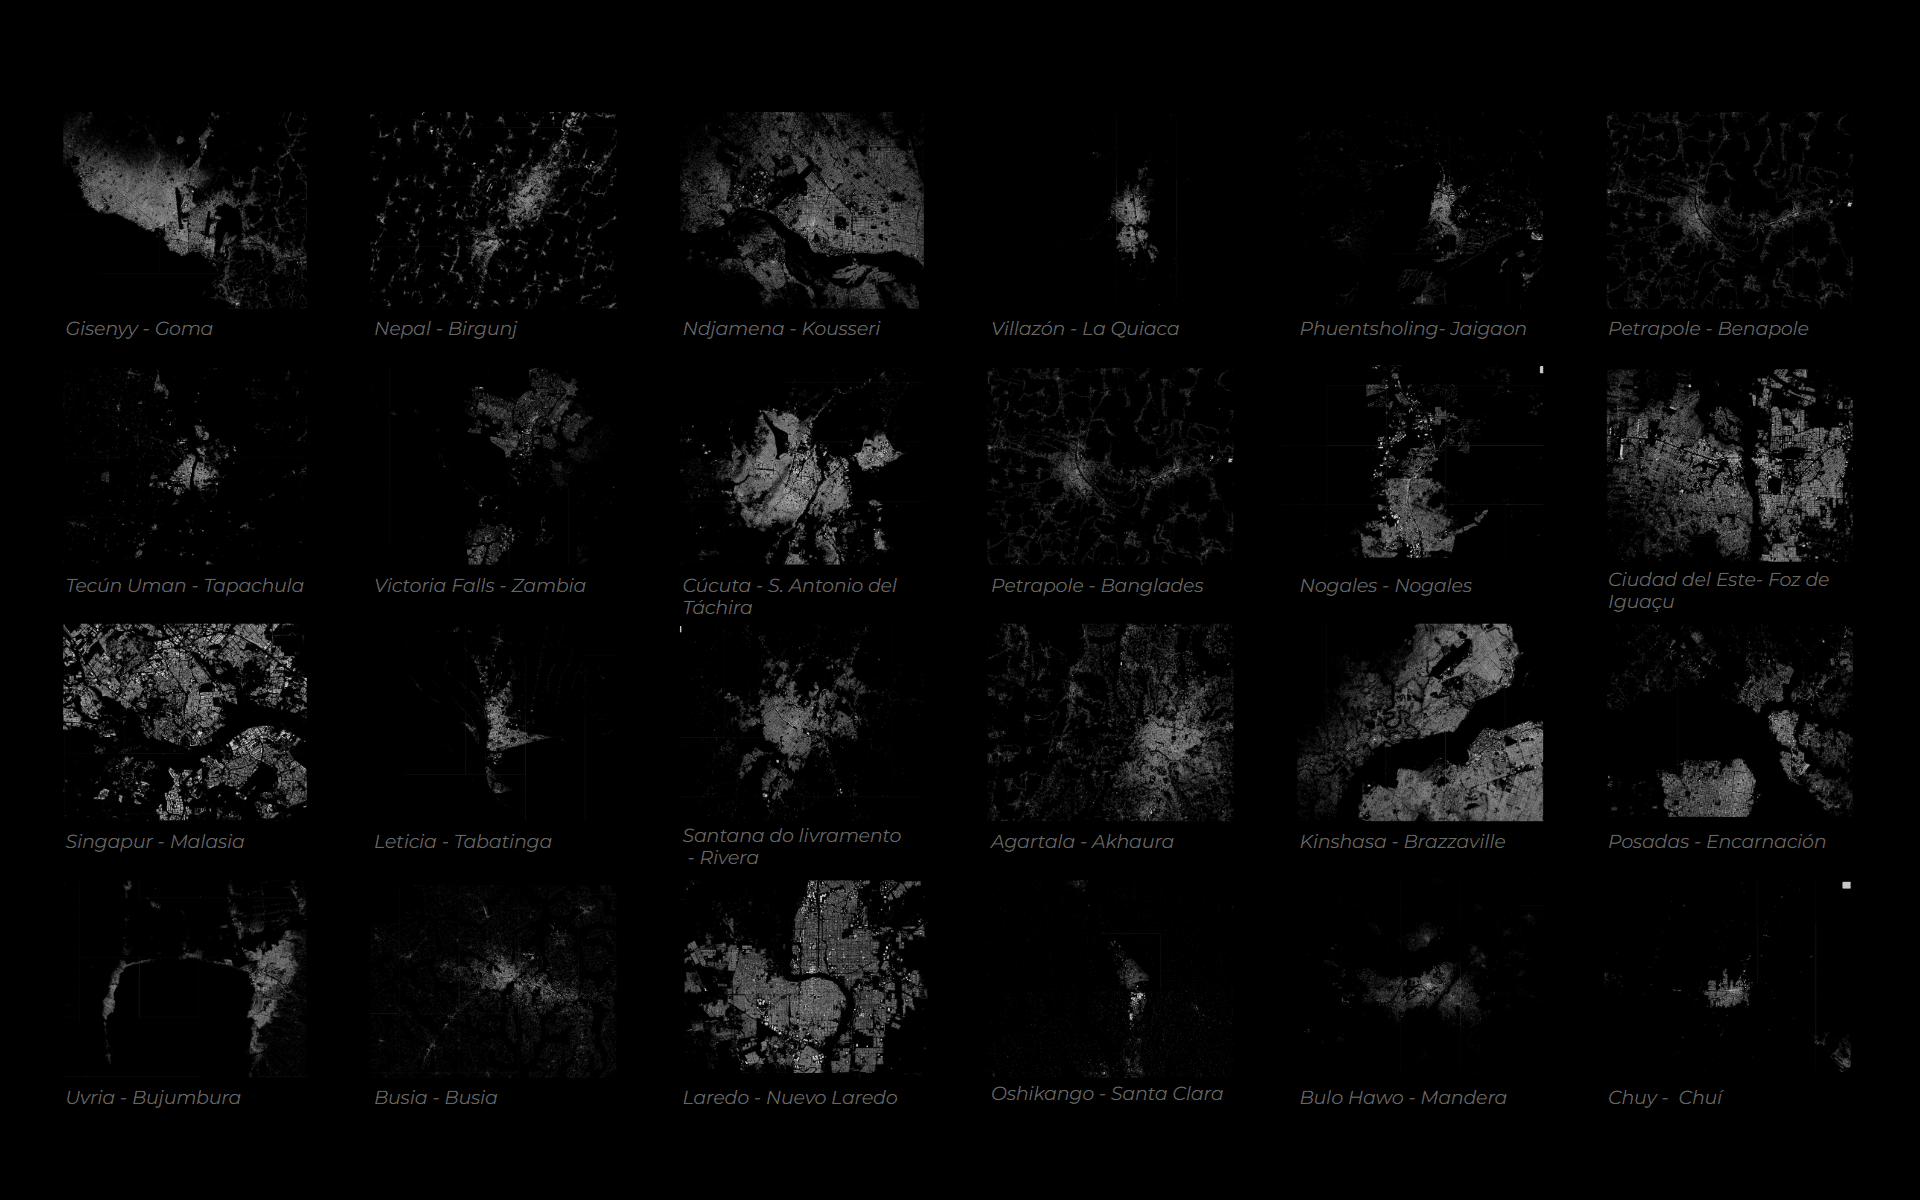
VII. Phase 3 — City Pair Analysis
Building on border typologies, the final phase proposes a framework for analyzing border city pairs.
An example case—Ciudad Juárez and El Paso—demonstrates how geography, infrastructure, urban density, and political boundaries intersect. Despite physical proximity and shared terrain, the border strongly conditions connectivity, mobility, and urban life.
_____________________________________________________________________________________________________________________________________________________________________
VIII. Conclusion & Future Steps
This project reframes borders as active spatial systems rather than static lines. By constructing an atlas and identifying border typologies, Cities on the Edge establishes a framework for future city-level research.
Next steps include: Deep comparative studies of city pairs within the same border cluster, Temporal analysis of border transformations, Policy-oriented interpretations of border permeability
Ultimately, the project invites us to reconsider how borders continue to shape the Cities on the Edge.
_____________________________________________________________________________________________________________________________________________________________________
