Context
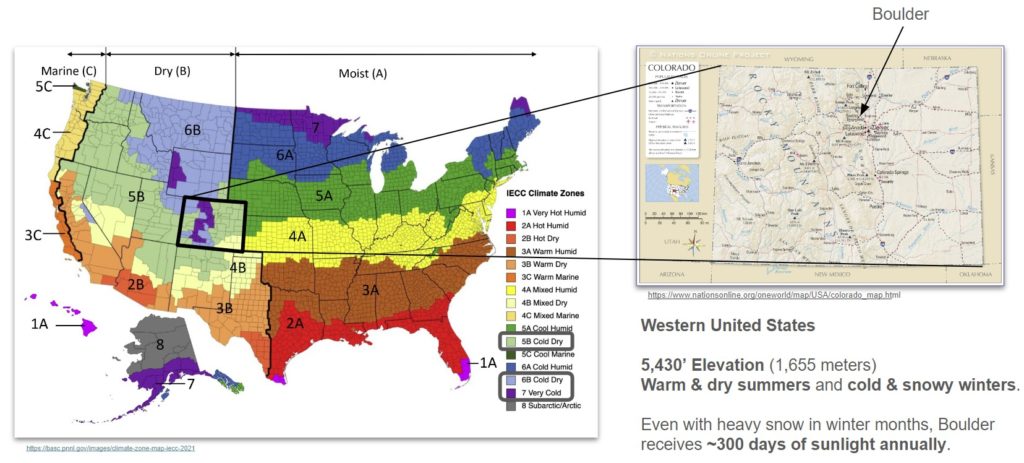
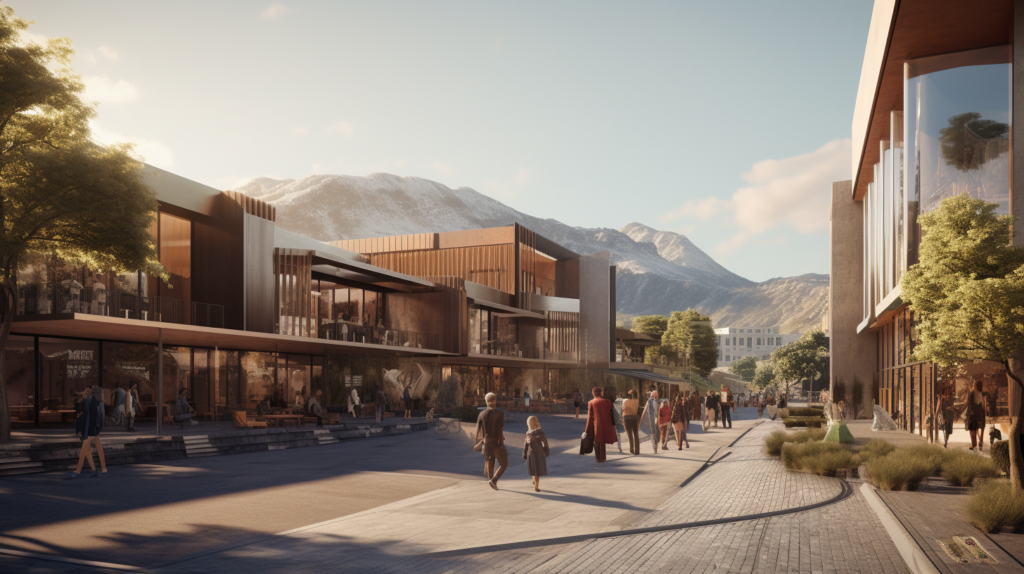
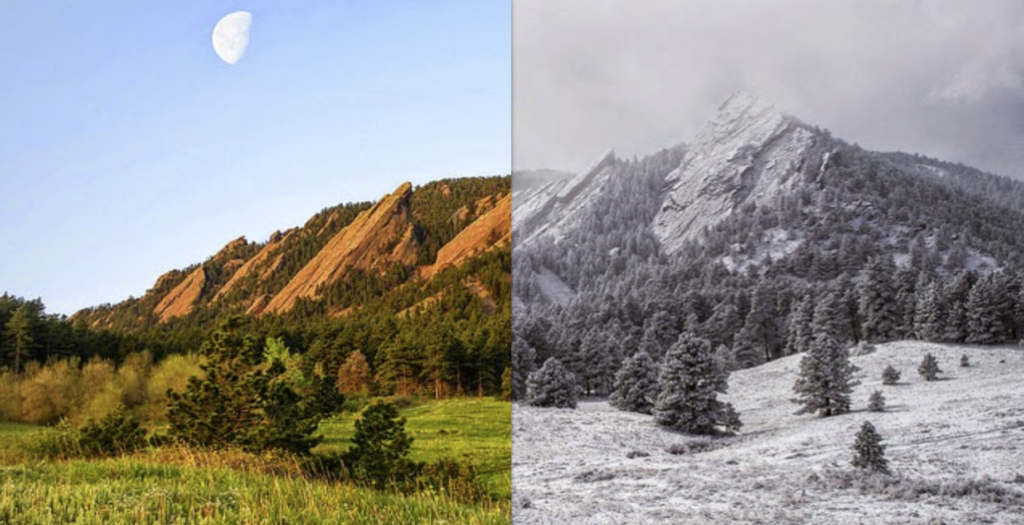
The city of Boulder, CO is populated by low-rise buildings and is known for a cold, dry climate given its high altitude and proximity to the Rocky Mountains. The investigated project involved selecting parameters that could respond to these characteristics and improve both outdoor and indoor comfort. The proposed structure is a 450 m2 architectural office, while the remaining site is an animated outdoor space.
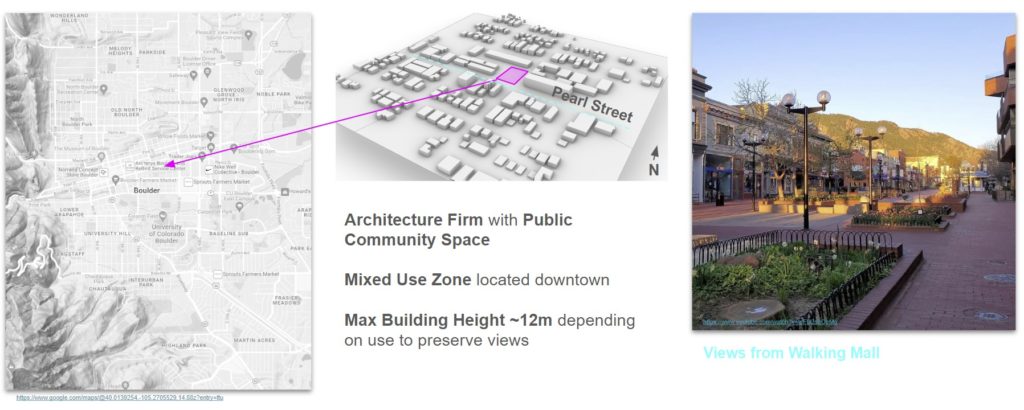
Because the city of Boulder strives to preserve views of the surrounding Rocky Mountains, most buildings in this area are limited to a maximum height of 12 meters. It is important to take this into account during analyses to ensure the design does not limit these views for neighboring buildings.
Environmental Analysis Strategy
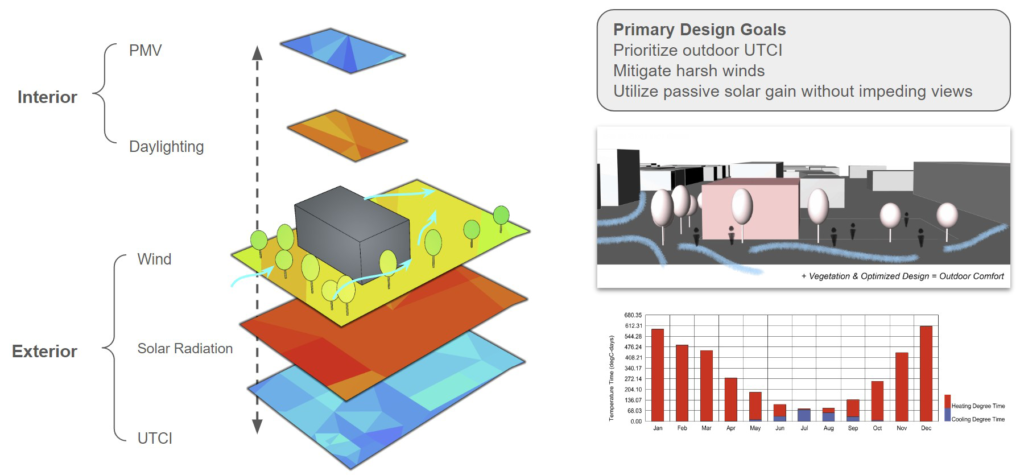
Annually, Boulder is relatively cold and buildings are often in a heating mode. At the urban scale, blocking wind in the winter and blocking sun in the summer is key to improving outdoor thermal comfort. The most beneficial passive building strategies include passive solar heating and capturing internal heat. These key takeaways informed our building design process which addresses environmental design at various, often competing, scales and criteria.
Thermal Comfort

Site / Massing Exploration and Optimization
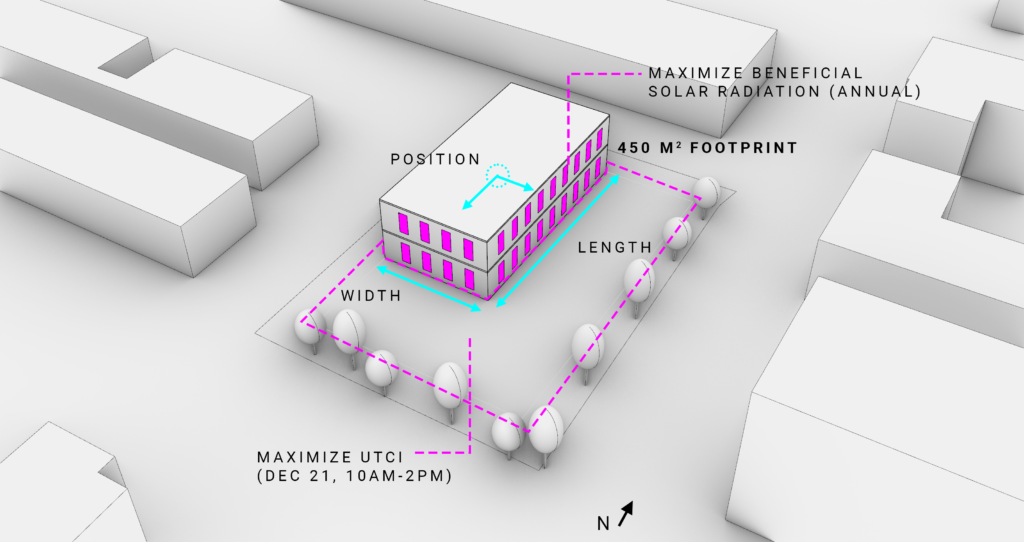
First, we explored the relationship between building and climate at the urban and site scale. We used an evolutionary solver, Wallacei X, to iterate through various combinations of building massing and orientation within our site. The width and length of the footprint is flexible but retains its 450 m2 area. The center point of the building changes on site and the building scales appropriately to stay within prescriptive setback boundaries.
For the optimization, we set to maximize both beneficial solar radiation and outdoor thermal comfort (UTCI) on a typical winter day. Beneficial solar radiation uses a typical building balance point temperature to determine when solar radiation is beneficial such as passive heating and when it is harmful such as during peak summer solar load. We employed Ladybug within Grasshopper to run this analysis and provide meaningful feedback. Regarding UTCI, Boulder is generally in heating mode and people experience cold sensations more than do neutral or hot annually. For this reason, we set to improve the site conditions for the most repeated comfort scenario.

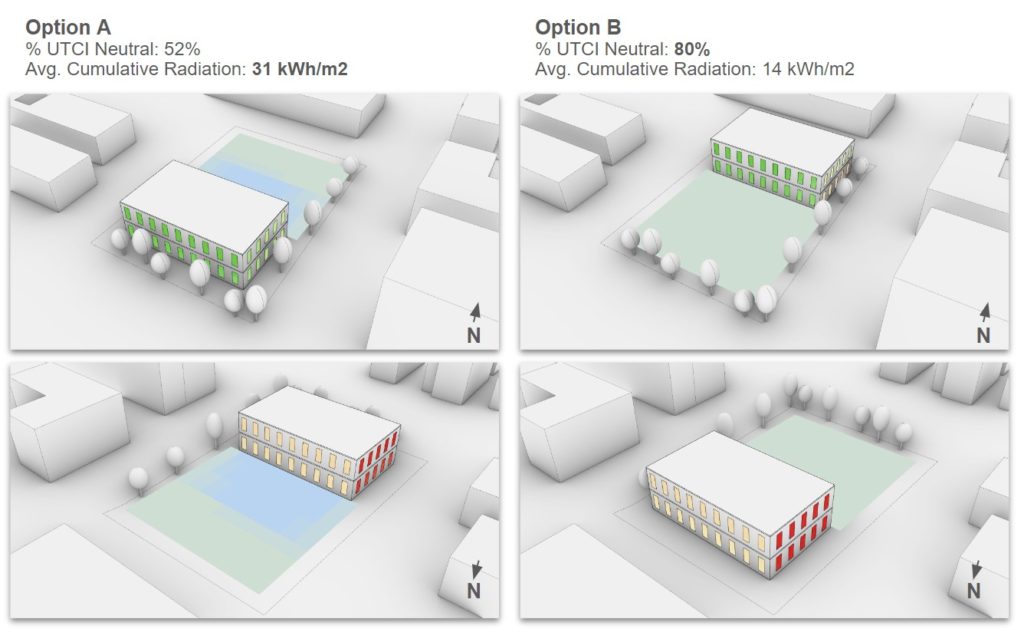
After completing the Multi-Objective Optimization (MOO) simulation, we explored the design space. Along the pareto front, there were several solutions. Notably, all the options employed an East-West building orientation as opposed to North-South. The NS orientation performs relatively worse due to the amount of Western undesirable solar radiation and direct sun blocked at the site. Thinking ahead, the EW orientation is also advantageous for interior daylighting as north façades provide low glare natural illumination and south façade sun can be easily controlled with horizontal shading elements.
Seen in the graphic above, we selected the Option A location as later wind analysis illustrated this site position provided additional control of wind velocities, thereby increasing wind comfort on site.
Microclimate – Direct Sun Analysis
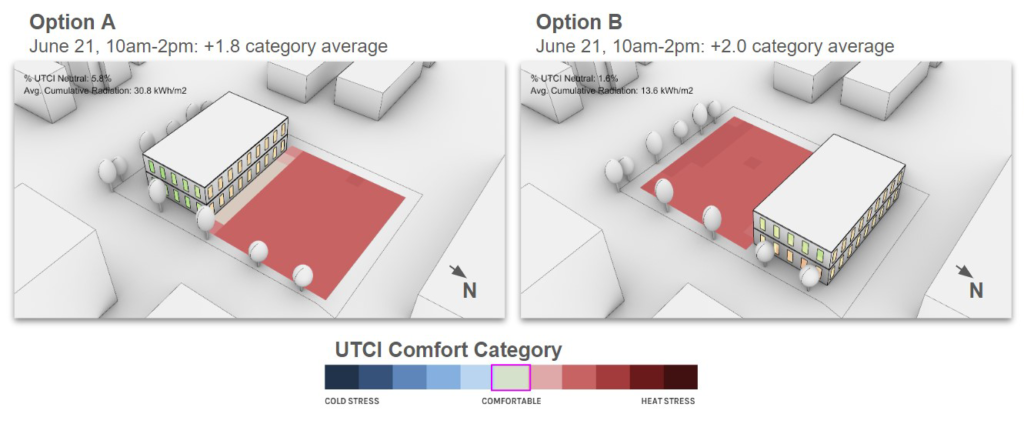
While optimizing site/massing for winter thermal comfort, we also analyzed the two main solutions during a typical summer day. Here, option A (south building) provides passive shading to the site, helping to reduce heat stress due to solar load.
Microclimate – Wind Analysis
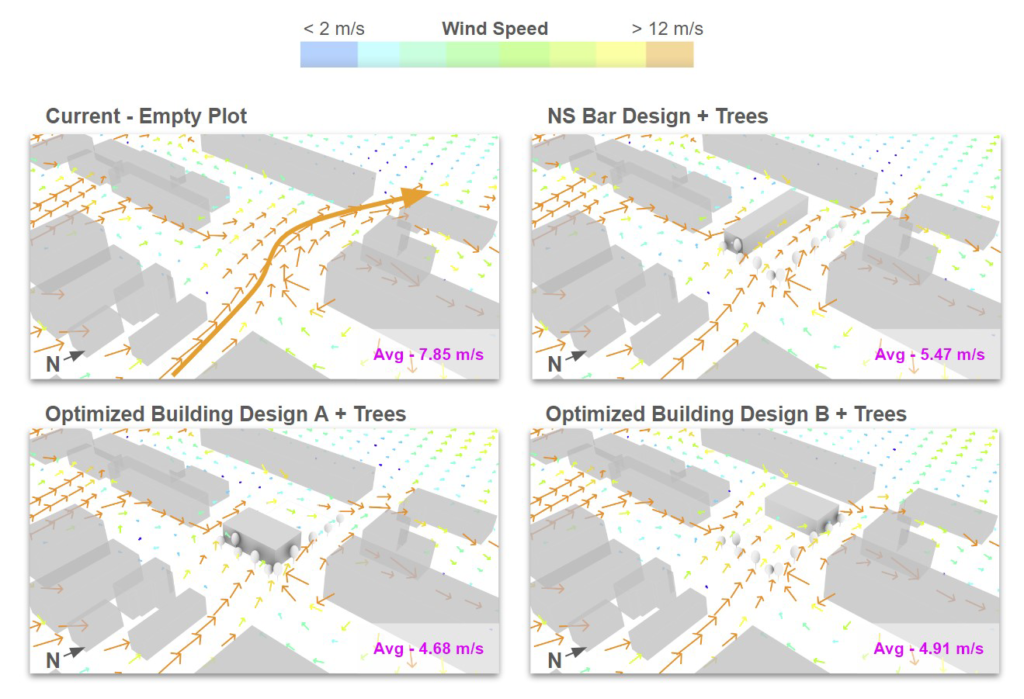
In addition to direct sun, wind is another crucial factor of analysis on the site. The use of Ladybug and Honeybee Tools within Grasshopper3D revealed a maximum wind speed of 15.4 m/s, mainly coming from the South (~190°).
With this information, the first analysis shown above displays the current empty plot and shows an average windspeed of 7.85 m/s with nothing to disrupt its path. Next, a North-South oriented design was tested which revealed a decrease in average speeds but did not help with wind flowing through the site and decreased outdoor comfort. Finally, two versions of an optimized East-South oriented building were tested.
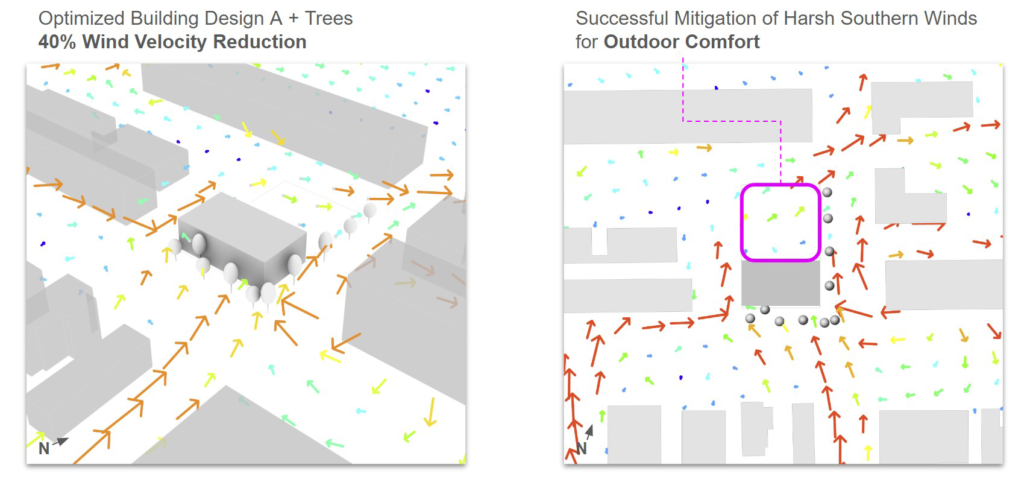
It was easy to see that not only would Option A greatly decrease average windspeed (40% reduction), but also increase outdoor comfort on the site by blocking the harsh southern winds, as shown above.
Daylighting – Shade Optimization
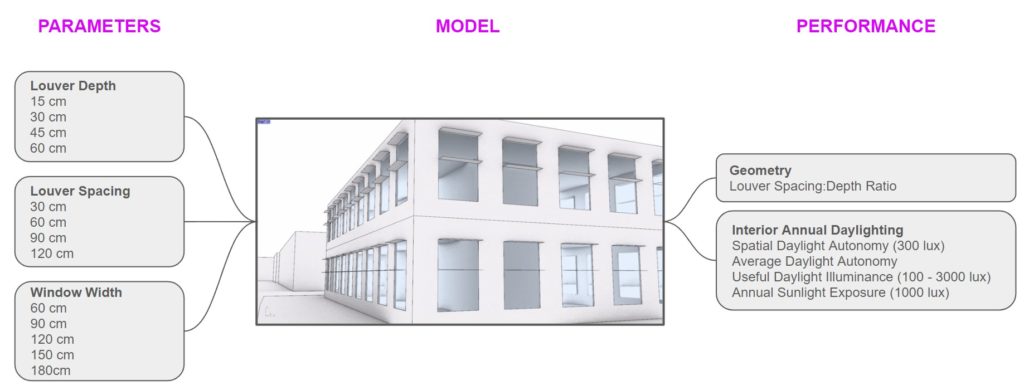
Finally, we investigated interior daylighting performance. We developed a parametric iterative model which performs annual daylighting analysis. With 80 different shading and glazing design solutions, we utilized Design Explorer – a parallel coordinate chart visualization – to understand and inform design. We found that to achieve at least 60% Spatial Daylight Autonomy (sDA300lux) as well as an Annual Sunlight Exposure (ASE) of less than 10%, a shading-to-depth ratio of 2:1 is ideal. Additionally, 120 cm wide windows provided sufficient daylighting while limiting glare.

Conclusions
Ultimately, our design balances the conflicting environmental criteria. We utilized climate data, macro exterior, and micro interior analysis to address environmental performance across different scales.
Environmental design is a challenging and exciting area of architectural focus. As our project shows, analytical decisions on temporal and spatial scales impact our understanding of architectural performance. It is important to utilize these types of analyses to inform architectural decisions, when they are being made. This requires we re-think the design process. Ideally, performance and design space exploration inform massing, orientation, facade design, and other passive strategies. Analysis needs to happen earlier and at the speed of design. Computational tools and parametric thinking facilitate this workflow, as demonstrated in our project.