
PROJECT OVERVIEW
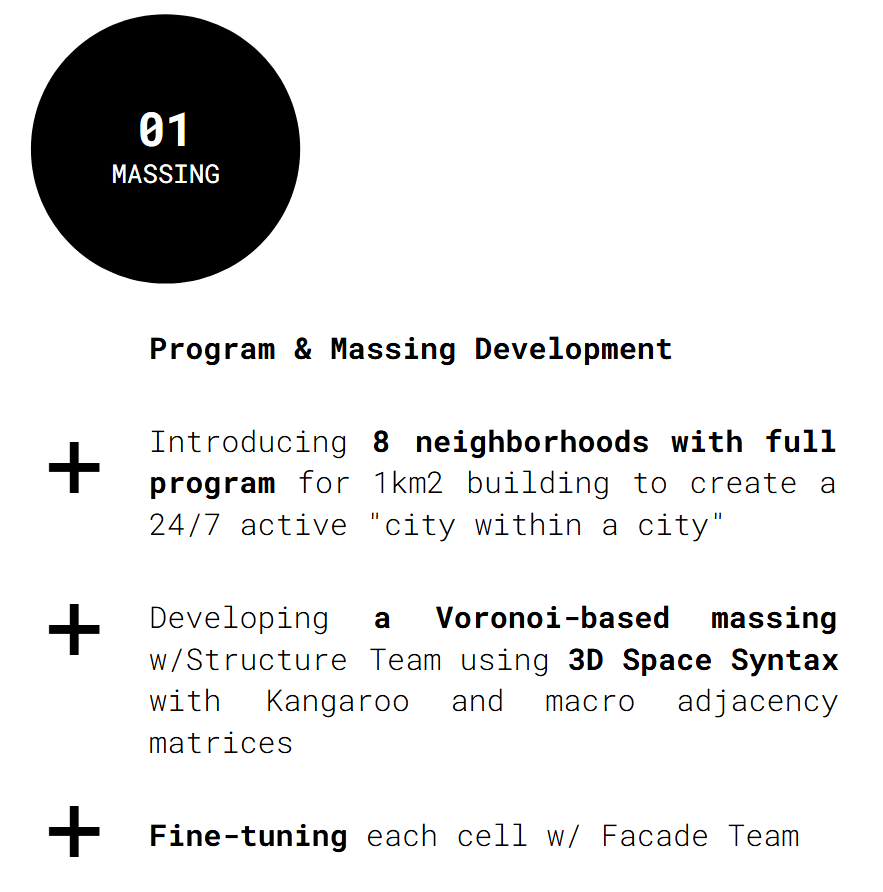
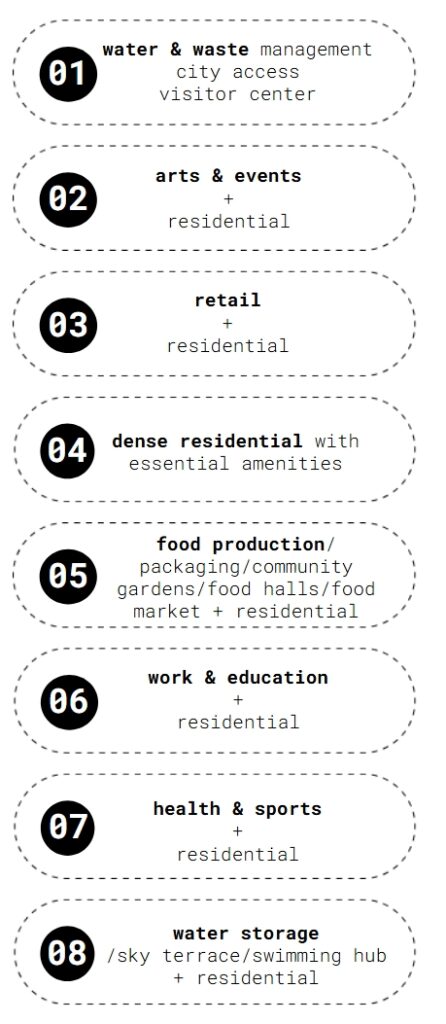
We applied 3D space syntax to distribute functions within each neighborhood based on distance and spatial requirements. Using Voronoi-based massing in collaboration with the Structure Team and macro adjacency matrices, we introduced eight neighborhoods within a 1km² building, creating a 24/7 active “city within a city.” These neighborhoods were refined with the Facade Team to ensure functional cohesion. Finally, we voxelized each mass based on syntax points for service and industrial zones while reserving the facade for residential areas.


INPUTS AND OUTPUTS
Our team primarily provides data to others rather than receiving it. We worked with program data from Excel, micro and macro adjacency matrices, site data, massing information, and functional requirements. These inputs enabled the generation of key outputs, including:
- Defined areas and functional distributions.
- Voxelized spaces with functions distributed across neighborhoods.
- Massing with node floors and circulation paths.
- KPI (key performance indicator) data.
Additionally, population and area calculations were tailored per neighborhood, with data shared dynamically across teams such as Structure, Industrial, Residential, and Facade.

COLLABORATION DIAGRAM
Our collaboration diagram highlights each team member’s contributions, represented by colors.
The workflow comprised several key phases
- Analysis: Defining the product brief, base volume, and adjacency matrices.
- Concept Development: Refining programs and visualizing concepts collaboratively with other teams.
- Development: Creating a 3D graph of neighborhoods, defining spatial connections, circulation paths, and cores using sub-volumes and voxelized representations.
- Finalization: Visualizing the final massing, analyzing KPIs, and preparing diagrams for presentations.
Automation was pivotal in processing point data into voxelized neighborhoods and sharing this with other teams. Refined visualizations and seamless collaboration underpinned the project’s success.

EXPERIENCES ON EACH STAGE
The initial phase posed challenges with adapting Speckle for design logic, but the process soon smoothed out with the platform’s efficient sharing and task management capabilities. Key experiences included:
- Speckle’s ease of use allowed for instant updates and collaboration across teams using diverse tools like Grasshopper, Rhino, and Revit.
- Weekly alignment meetings on Fridays ensured consistent progress.
- Some challenges were faced, such as branch count/length issues, duplicated geometries, and waiting for inputs from other teams.
- Limited programming knowledge initially slowed automation scripting, but faculty support and investing in Fly.io resolved these issues.

AUTOMATION CONCEPT
To streamline our workflow, we automated significant portions of the process using Speckle, Speckle.Py, Fly, and Rhino Compute. The automation pipeline included:
- Voxelization: Converting points into voxels, sorted and colored by functions across the eight neighborhoods (e.g., residential, industrial, health, and education).
- Data Transfer: Sending point data from Grasshopper to Speckle models through scripts, converting points into strings for Rhino Compute. Points were then arranged in data trees for each neighborhood and visualized as colored meshes.
- Dynamic Updates: Leveraging web hooks for real-time communication between Speckle and Compute services, with sorted voxels dynamically shared among teams.


Our internal dashboard, built with Speckle.Py, streamlined team monitoring. Key features included:
- Filtering branch names to isolate relevant data.
- Embedding Speckle model URLs for seamless access.
- Visualizing contributions by branch and commitment date.
The dashboard greatly enhanced our ability to track team collaboration and monitor progress effectively.

