
Computing Risk & Planning Resilience from Afar is a remote-sensing–driven investigative study to read, identify and address underlying vulnerabilities associated with landslide risk in urban India. The project aims to develop replicable analysis workflows for compounded risk calculation—making visible what often remains hidden enabling actionable insights in places where institutional data is frequently outdated or incomplete.
Landslides in India
Landslides are among the most devastating disasters in urban India. Often triggered by rainfall or infrastructural disturbances, their impacts remain highly localised, underreported, and poorly mapped.
According to the Geological Survey of India (GSI), 12.6% of India’s land area was classified as landslide-prone in 2013. A more recent study by Sharma et al. (2024) estimates this figure has risen to 13.6%. Figure 1 visualizes the latest susceptibility map publicly released by the authors. The 1% increase represents an expansion of nearly 20,000 square kilometres over a decade, underscoring the need for proactive risk mitigation.
Current Limitations
The 2024 susceptibility prediction assesses landslide risk at a national scale, categorising the entire region on a scale of 0 to 5. While the model offers relatively high resolution for a national dataset, it contrasts with the highly localised nature of landslide causes and impacts—limiting its effectiveness in planning for resilience. This research aims to establish a method for zooming in at the local scale, enabling greater spatial granularity to identify vulnerabilities and support more resilient urban and regional planning.
Identifying & Mapping Vulnerable Areas
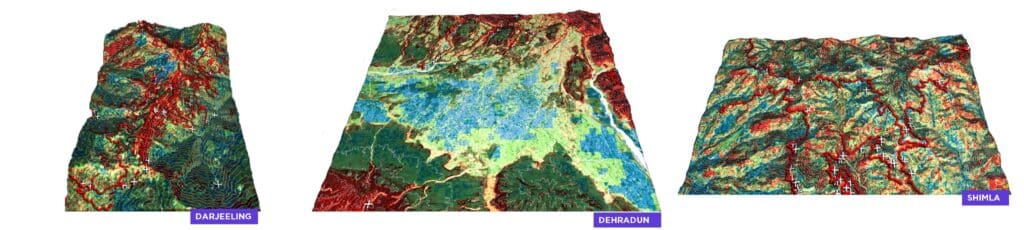
Urban regions in developing countries face heightened risk, due to unplanned expansion and high population densities. By identifying and overlaying representative raster datasets—specifically Urban Clusters Classification and High Population Density Clusters—this study isolated priority urban areas: Aizawl, Dehradun, Darjeeling, and Shimla.
Aizawl was then selected to test and develop risk classification workflows, aiding in the prioritisation of risk mitigation or preparedness interventions. The other areas will be used to test the replicability of the developed pipeline.
Risk Classification
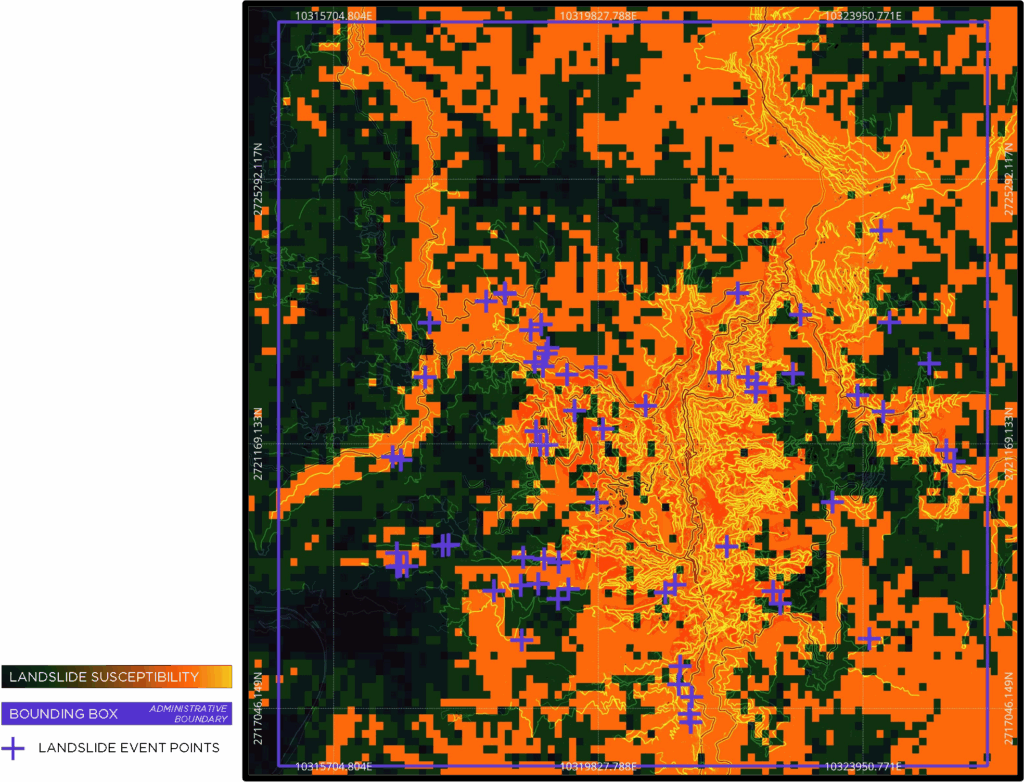
The logic of the workflow is to develop a replicable computation pipeline to classify landslide risk into qualitative categories. As seen in Figure 2, ILSM—2024 national scale susceptibility map, lacks granularity when zoomed in at a local scale for contextual planning.
The workflow is explained in the following steps and outlines the process of integrating qualitative raster layers with historical even analysis to aid identification of priority areas in need pf resilience.
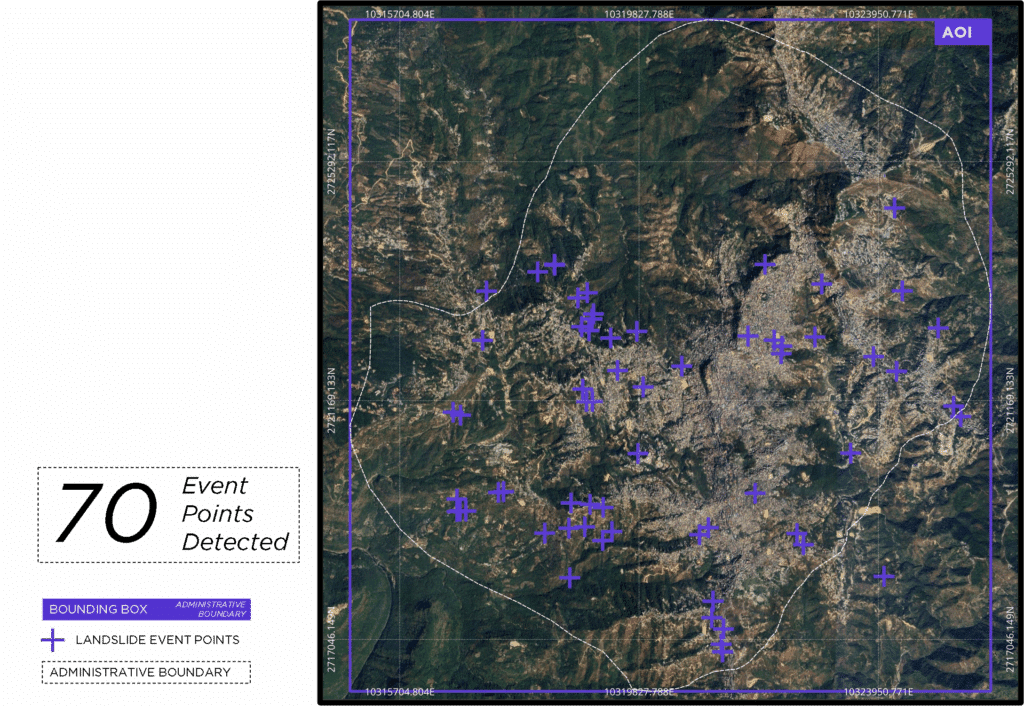
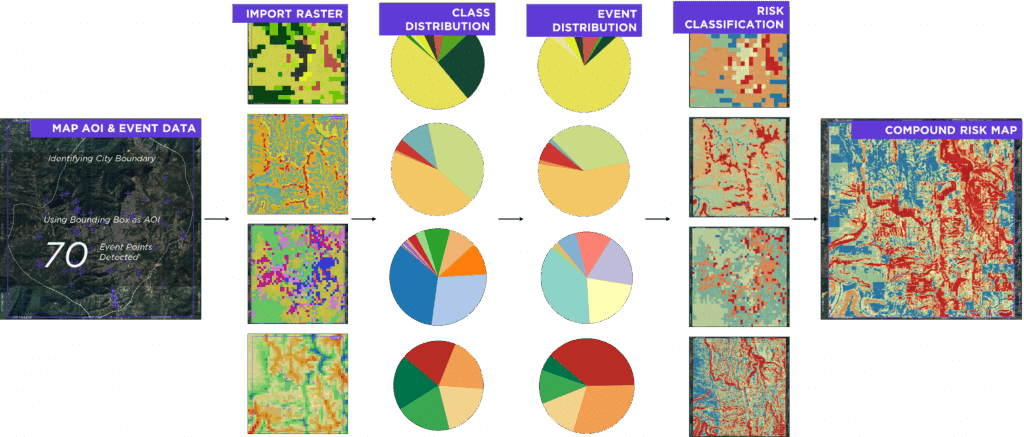
Step I—Define AOI & Map Event Data
The bounding box defined by the administrative boundary of the identified city is chosen as the AOI. Event points within the bounding box are isolated through spatial join.
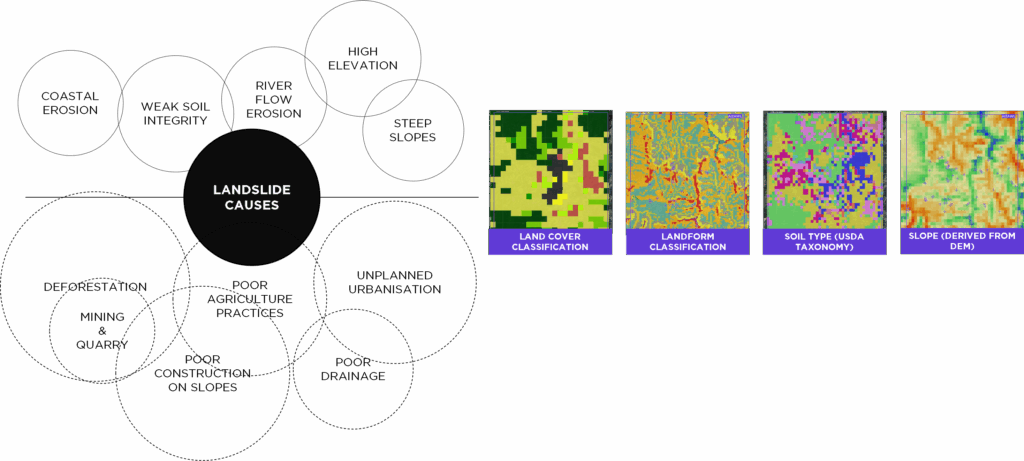
Step II—Import Raster Datasets
Raster datasets relevant to various causing conditions are selected, each of which reflect the whole picture of the causes of a landslide event.
Step III—Inspect Raster Data
Diving into what the identified datasets show us, represented classes are first identified. Then, a quantile bin distribution is defined to create five spatially equal classes from the represented range in the ranged datasets.
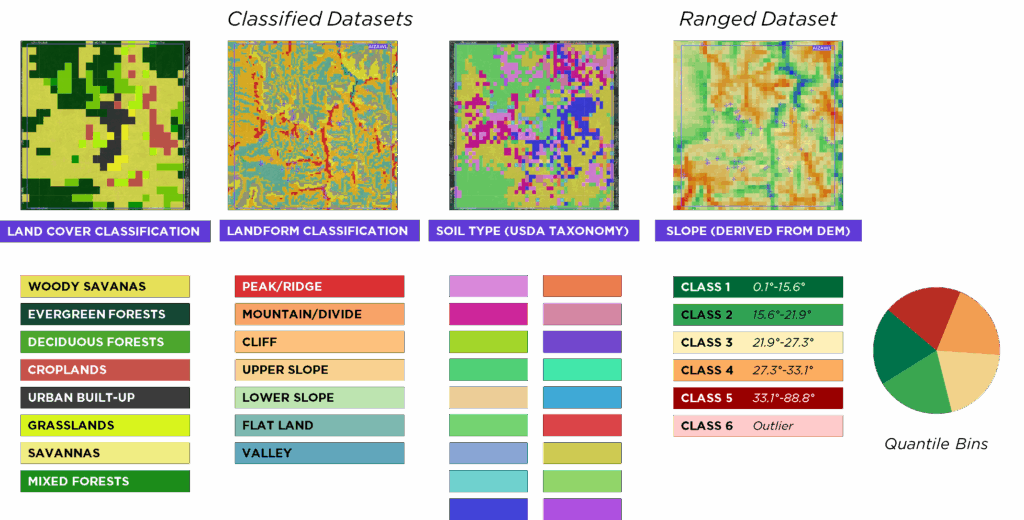
For simplifying explanation, remaining workflow is explained with the land cover classification as focus.
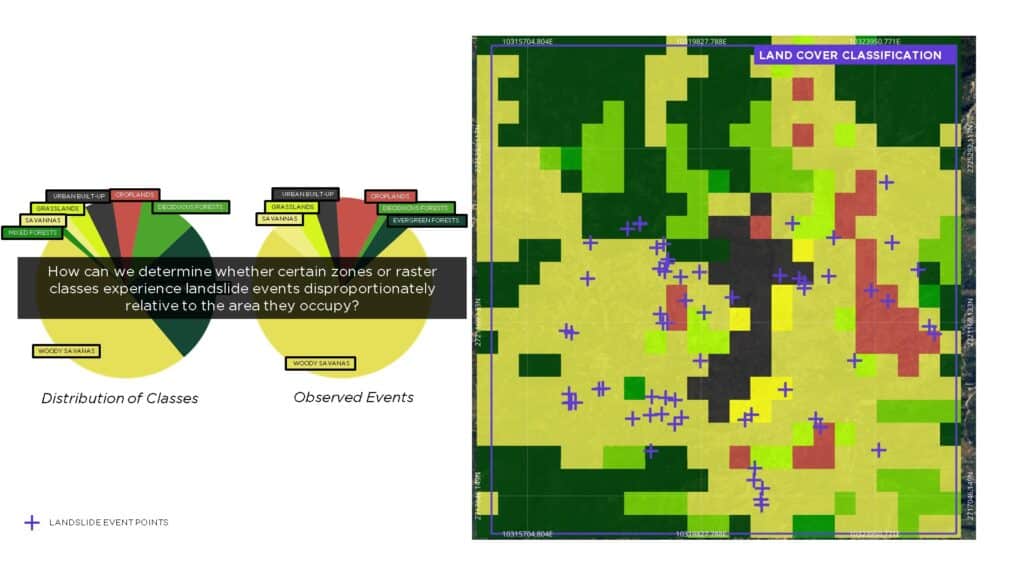
Step IV—Proportional Area Analysis
In order to understand how various classes interact or affect landslide events, area covered by different classes and the distribution of events in these classes is examined. The examination brings forward the question if there are certain raster classes experiencing landslide events disproportionately to the area they occupy.
Step V—Risk Ratio & Qualitative Categorisations
Reading the area distribution of various classes as expected distribution of events, in case of homogeneous incidents as per classes, a direct comparative ratio to indicate risk is developed to quantify risk values associated with each class.
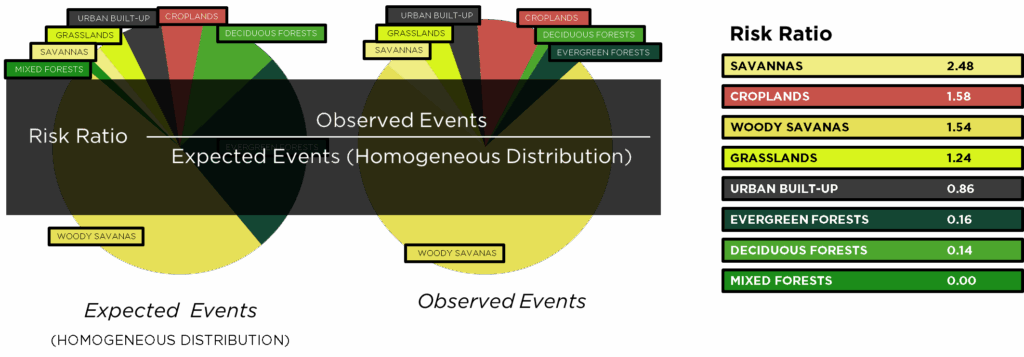
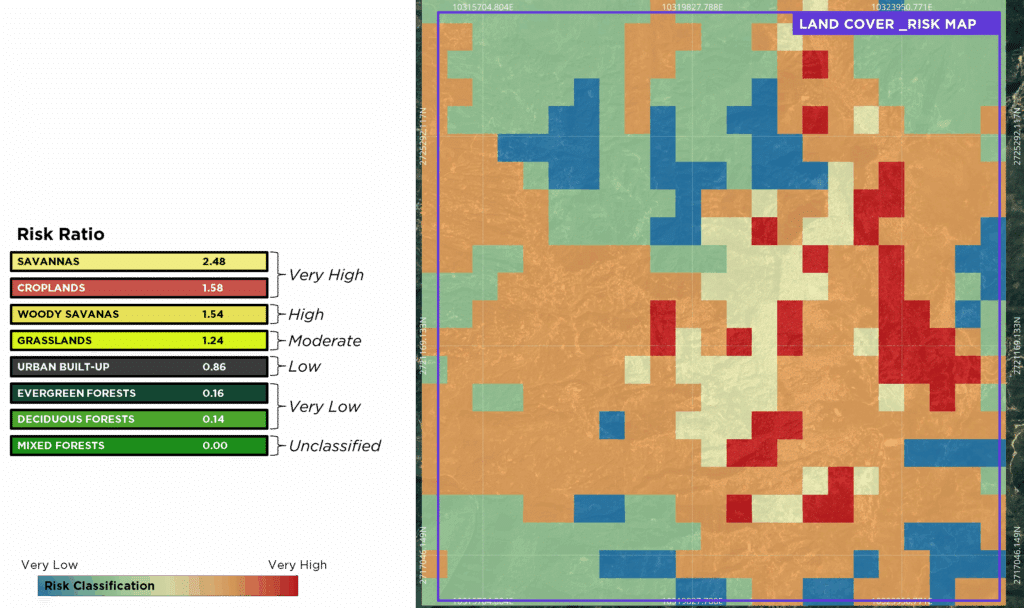
The risk ratio values are then classified into qualitative categories based on range distribution. This categorisation allows development of a reclassified land cover map indicating risk of landslide for each represented class.
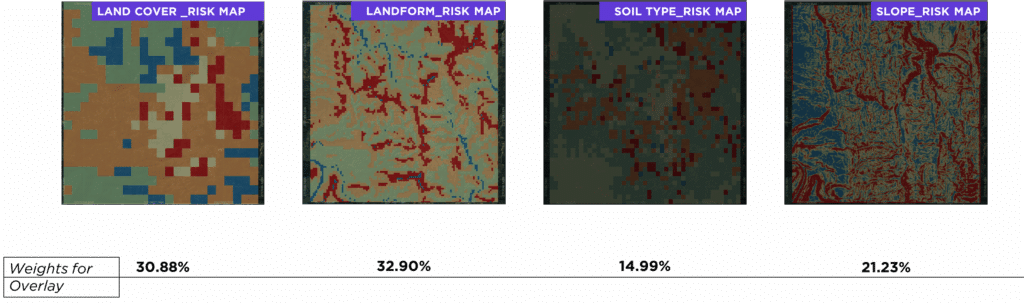
Step VI—Strength Association for Weighted Overlay
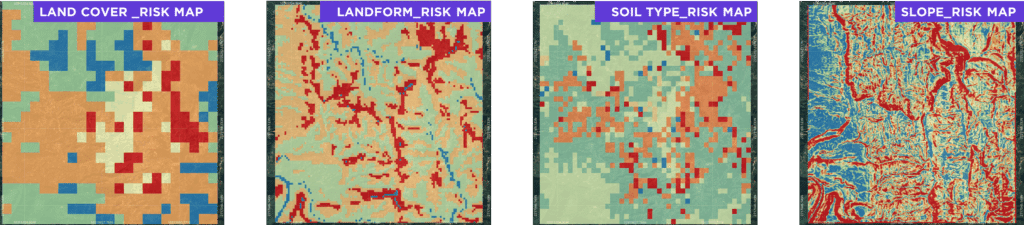
The reclassification workflow defined above, lets us develop contextual risk maps for the defined AOI for any raster dataset. Figure 9 shows the risk maps generated by running the same workflow on other datasets identified earlier.
As stated earlier, each of the identified datasets, reflect part of the picture of the conditions causing an event of a landslide. Cramer’s V is a mathematical operation that numerically quantifies the strength of correlation between two datasets. Using this operation strength of association between each dataset and the landslide events inventory is checked, and normalised to sum to 1. This allows us to assign weights to the four developed risk maps.
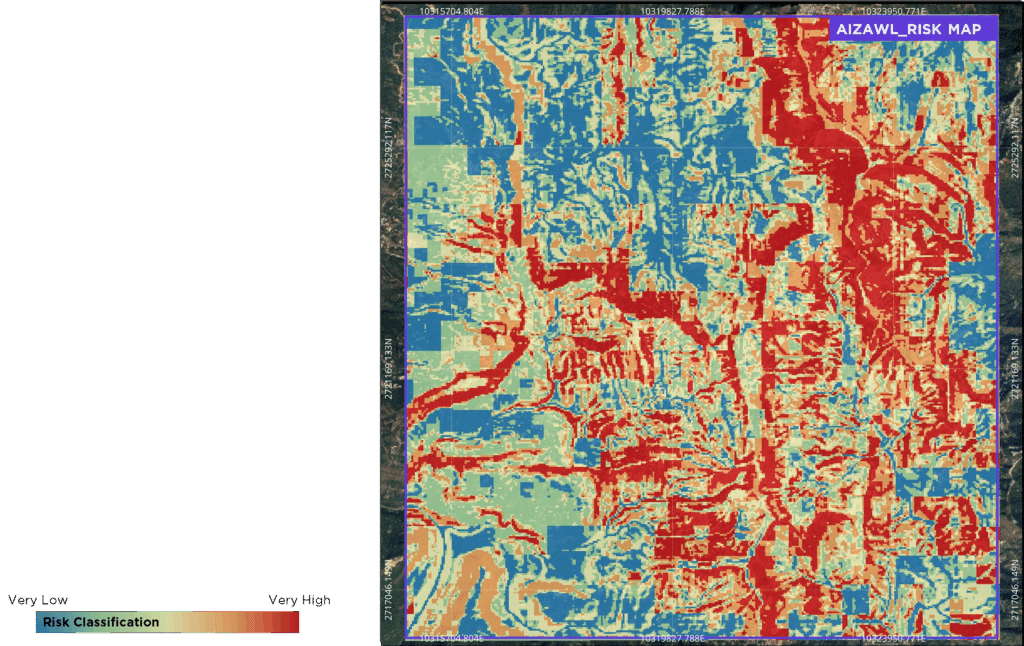
Step VII—Compound Risk Map
The identified weights allow us to conduct a simple raster calculation to develop the compounded risk map categorising area within AOI to qualitative risk levels.
Workflow and Replicability
The entire workflow is developed and compiled in a Python-based environment. The global availability of identified datasets and contextual computation operations keep the workflow simple and replicable.
In order to test the replicability of the developed workflow, compound risk maps for other identified urban areas are also developed. These maps do a solid job of identifying risk levels along the hidden terrain and bring to front what usually remains hidden.
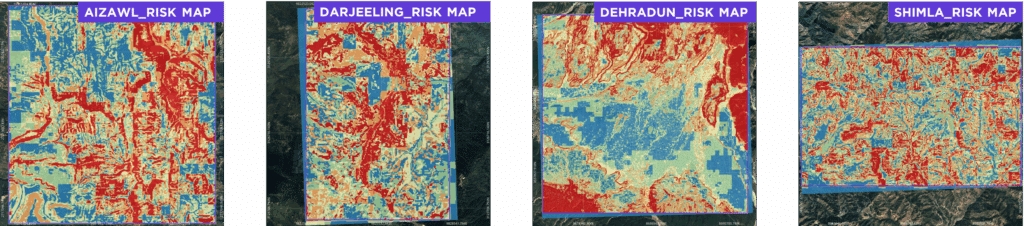
Using this workflow, first steps towards a resilient approach are already being made by making risk levels visible to planners and policy makers.
Insights
Urban Vulnerabilities—Roads
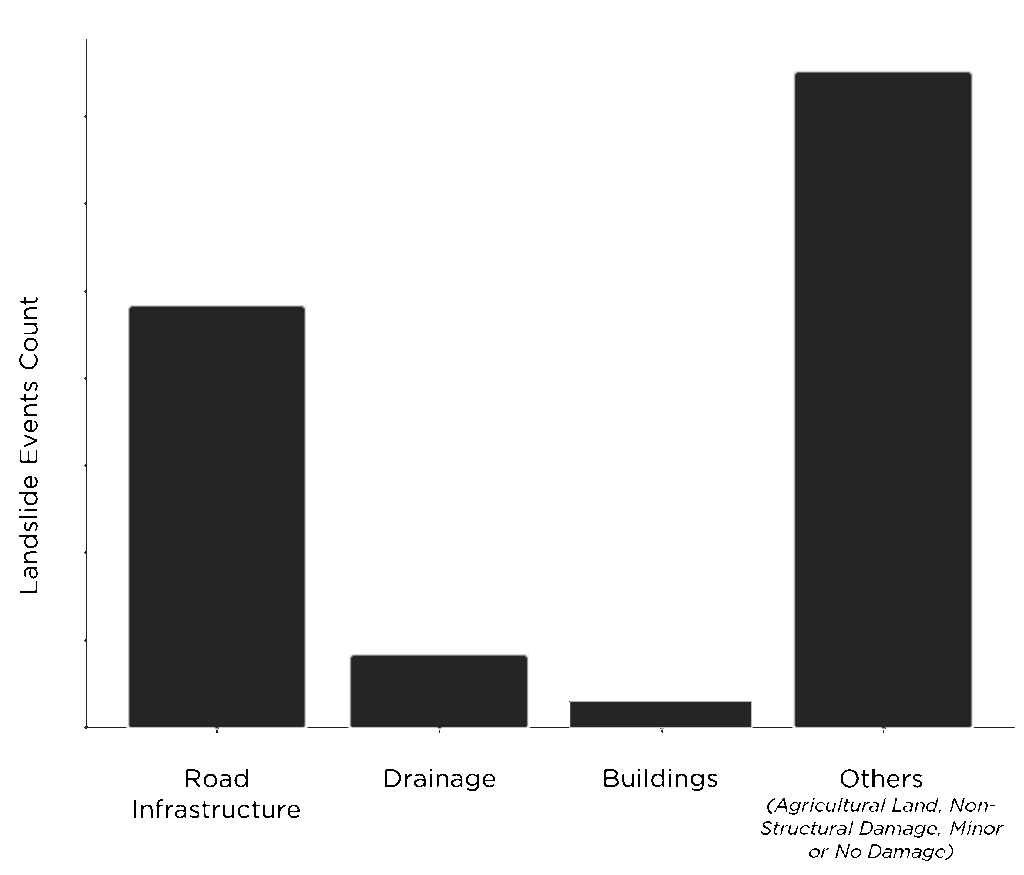
Looking into the impact caused in infrastructure damage caused by landslide events, we see that roads are the most impacted urban elements.
Looking further into where landslide events interact with roads, a modified nearest neighbour analysis is used to first identify the distance from all landslide points to their nearest roads. This calculation revealed that most landslides (in AOI) occur within 20 metres of a road and a major part of them right on them. This analysis is then used to isolate roads with multiple incidents.
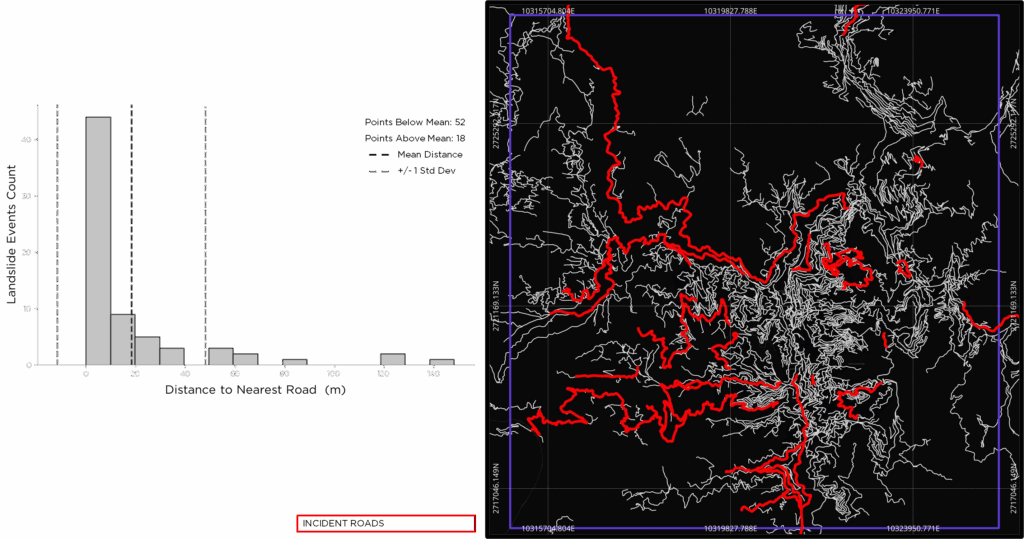
The same proximity analysis can also be used to understand landslide behaviours near water bodies like rivers, channels, etc. This calculation is not performed for Aizawl, since the city does not boast any such water bodies. However, the calculation would be useful in other areas.
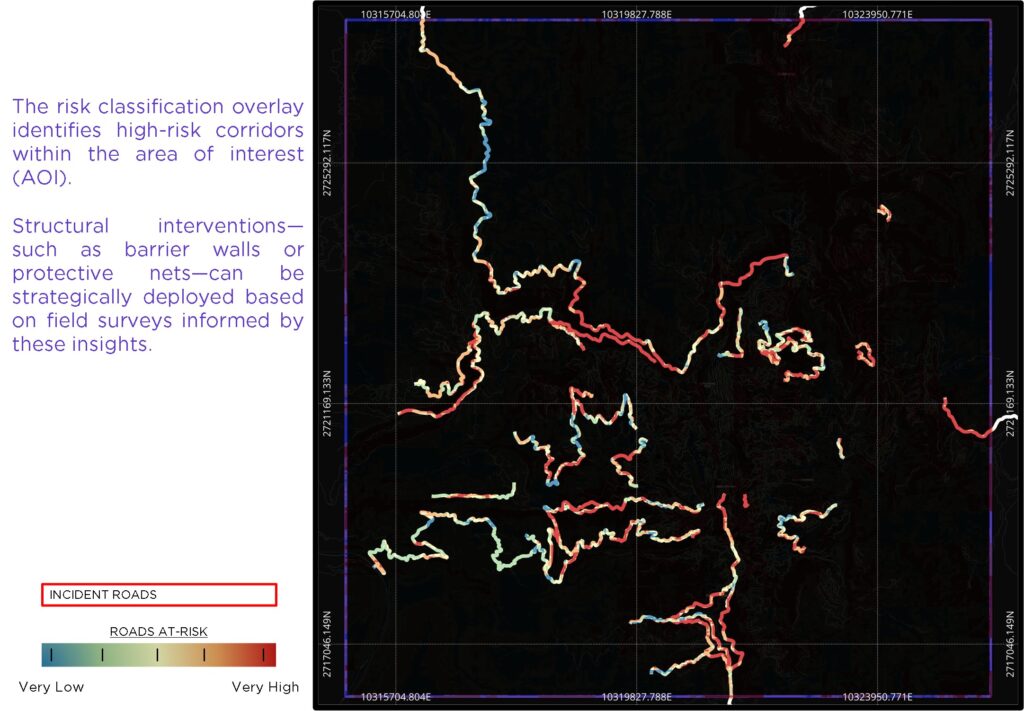
By overlaying the developed risk maps with the isolated incident roads, actionable insights can be developed for disaster preparedness.
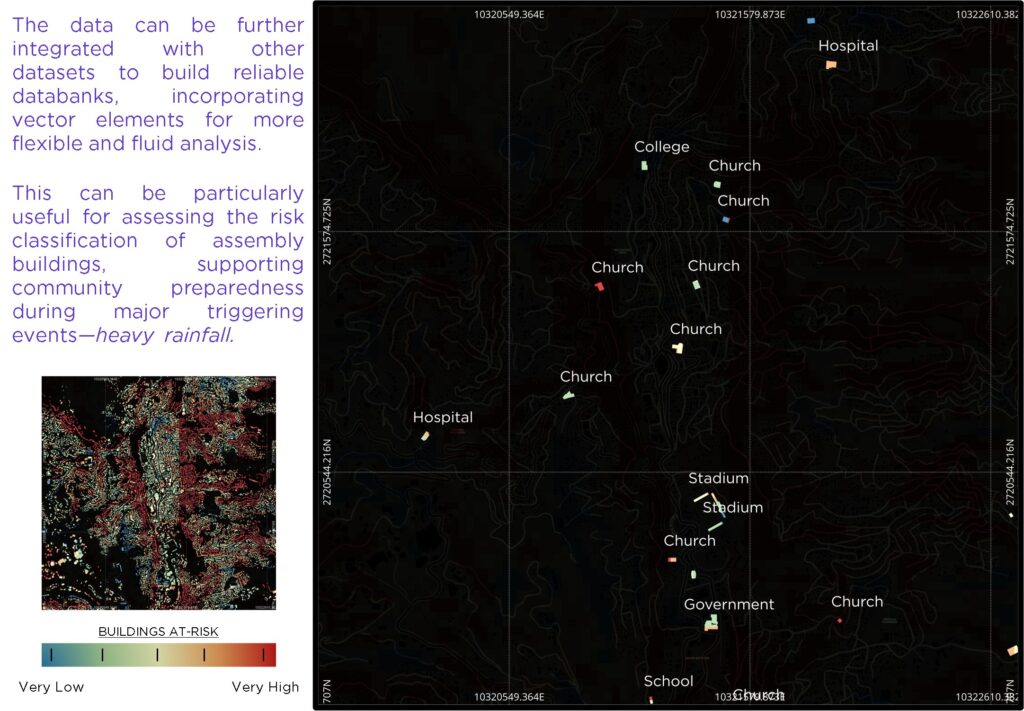
Urban Vulnerabilities—Buildings
In order to see the insights from the risk maps at a building scale, we zoom in on the city centre to view a higher resolution of the risk classified.
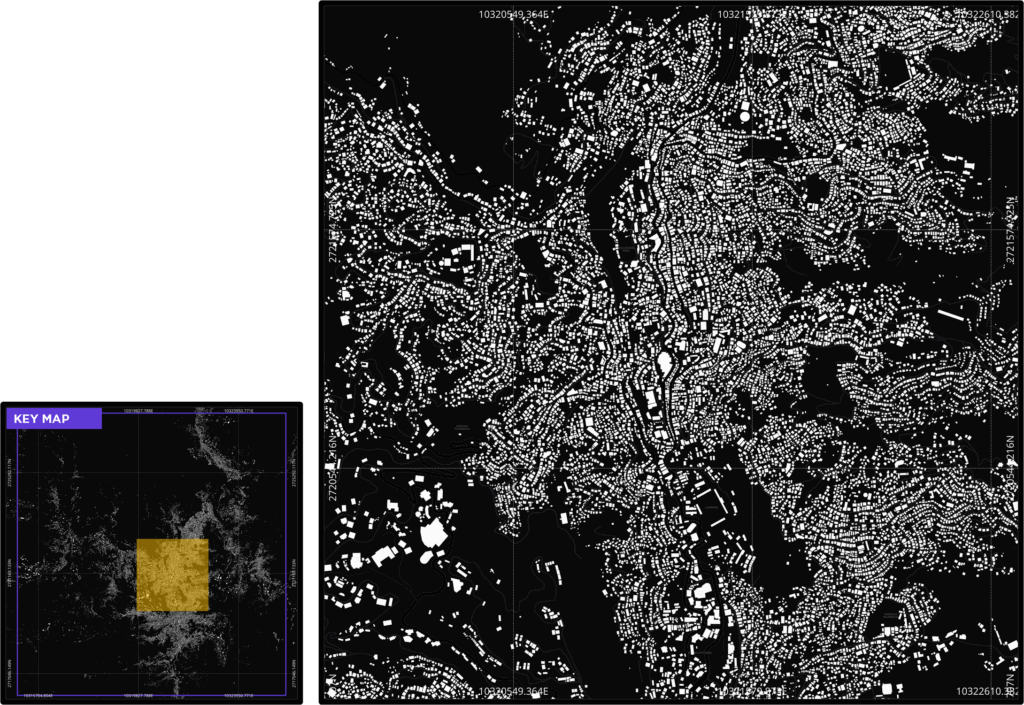
Visualising the overlay at this zoomed in scale, reveals highly helpful insights for planners and policymakers to identify and address underlying urban vulnerabilities.

Interventions defined above are only some of the many ways urban resilience and better disaster preparedness can be achieved by planners, policy makers and communities residing. The risk classification paves a way of developing methods and understanding our urban environment better than we do now.
Database Update
Conclusion
The risk mapping workflow enables a layered analysis of urban events, helping to identify and address underlying urban vulnerabilities with clarity and precision.
Land use planning for future developments, if done guided by these insights can position communities on a stronger path toward resilience.
The replicability and contextual nature of the approach enables us to understand each place with specificity and precision.
Closing Manifesto
Resilience is not the absence of disaster — it is the presence of methods that are flexible, repeatable, and grounded in the real.
This work proposes a computational workflow without relying on institutional abundance. It computes with scarcity, acts with urgency, and plans for the undocumented in an open and accessible workflow.
In the future of resilient urbanism, workflows like this one must become the norm, not the exception.
