
Main question. How built heritage affects real estate market in European cities?
Hypothesis
Let’s look at this question on the example of Barcelona. Let’s single out the city neighborhoods (barrios) where historical buildings are located, and analyze the ratio of average real estate prices to them, in particular, the sale prices of apartments and houses.
As a next step, we could analyze the average condition factor of heritage buildings inside and the built environment by city neighborhood and predict how the average price per square meter would change if heritage renovation programs were applied.
Methodology
- Evaluate the best way of creating a real estate prices dataset by testing API and scraping approaches, finally get a dataset with sufficient data entries,
- Calculate the price per sqm per each data entry in the real estate prices dataset,
- Match the real estate prices dataset with the Barcelona neighborhood shapefile, calculate mean, max, min and average price per sqm,
- Fetch heritage points and polygons from openstreetmap, create isochrones of them 100, 400 and 800 m,
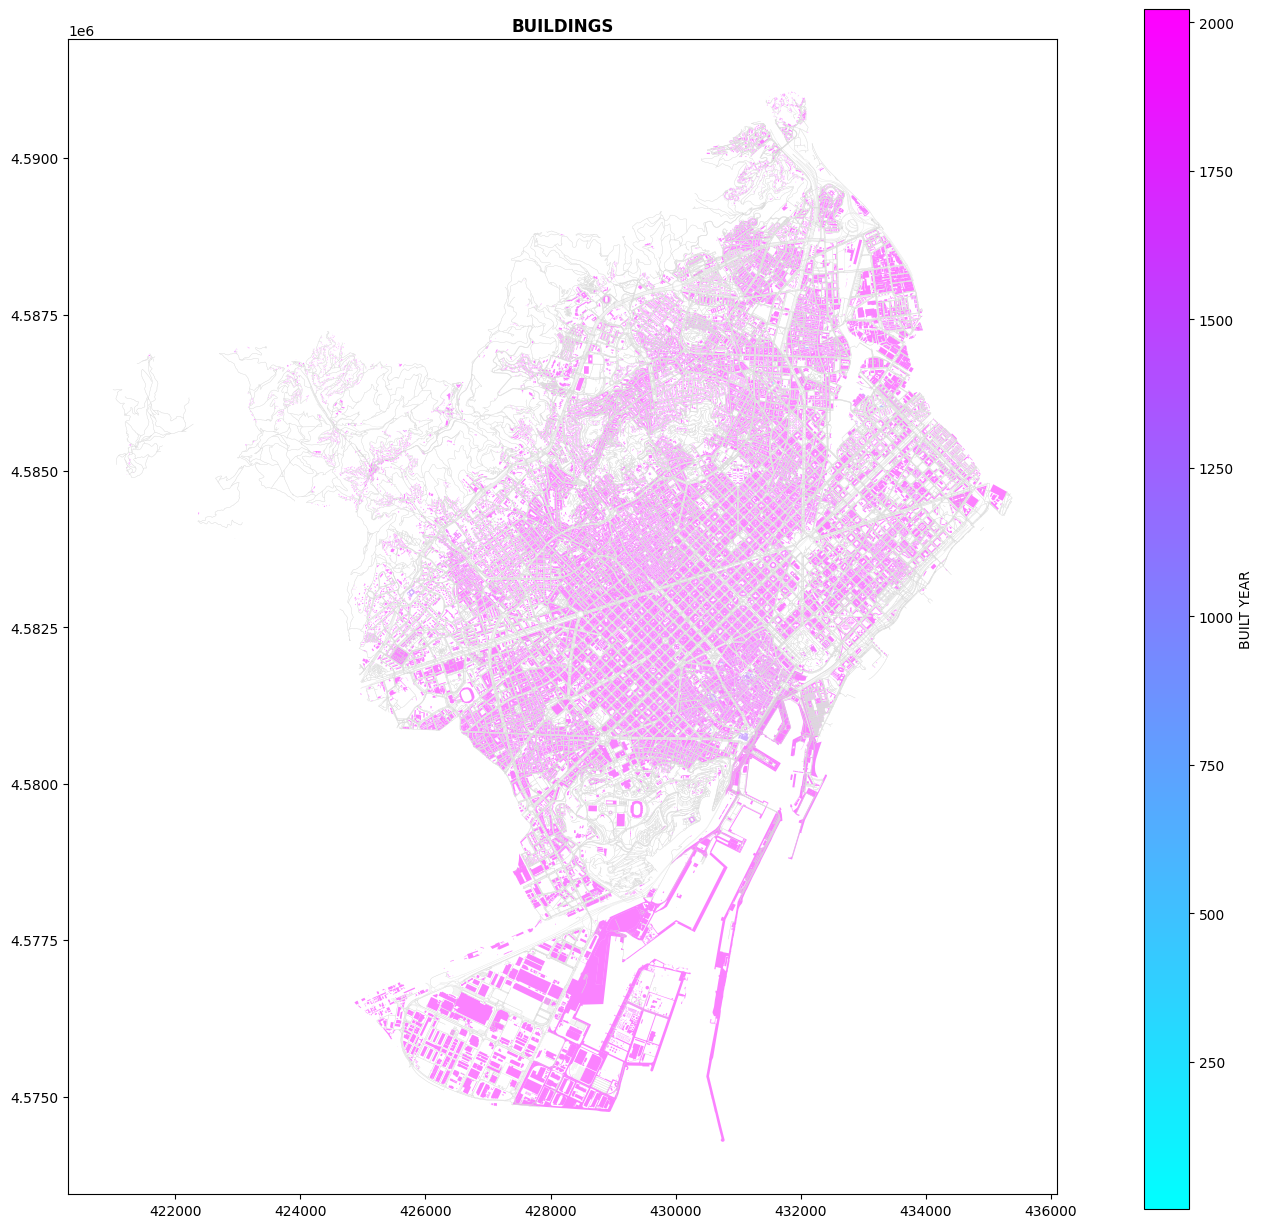
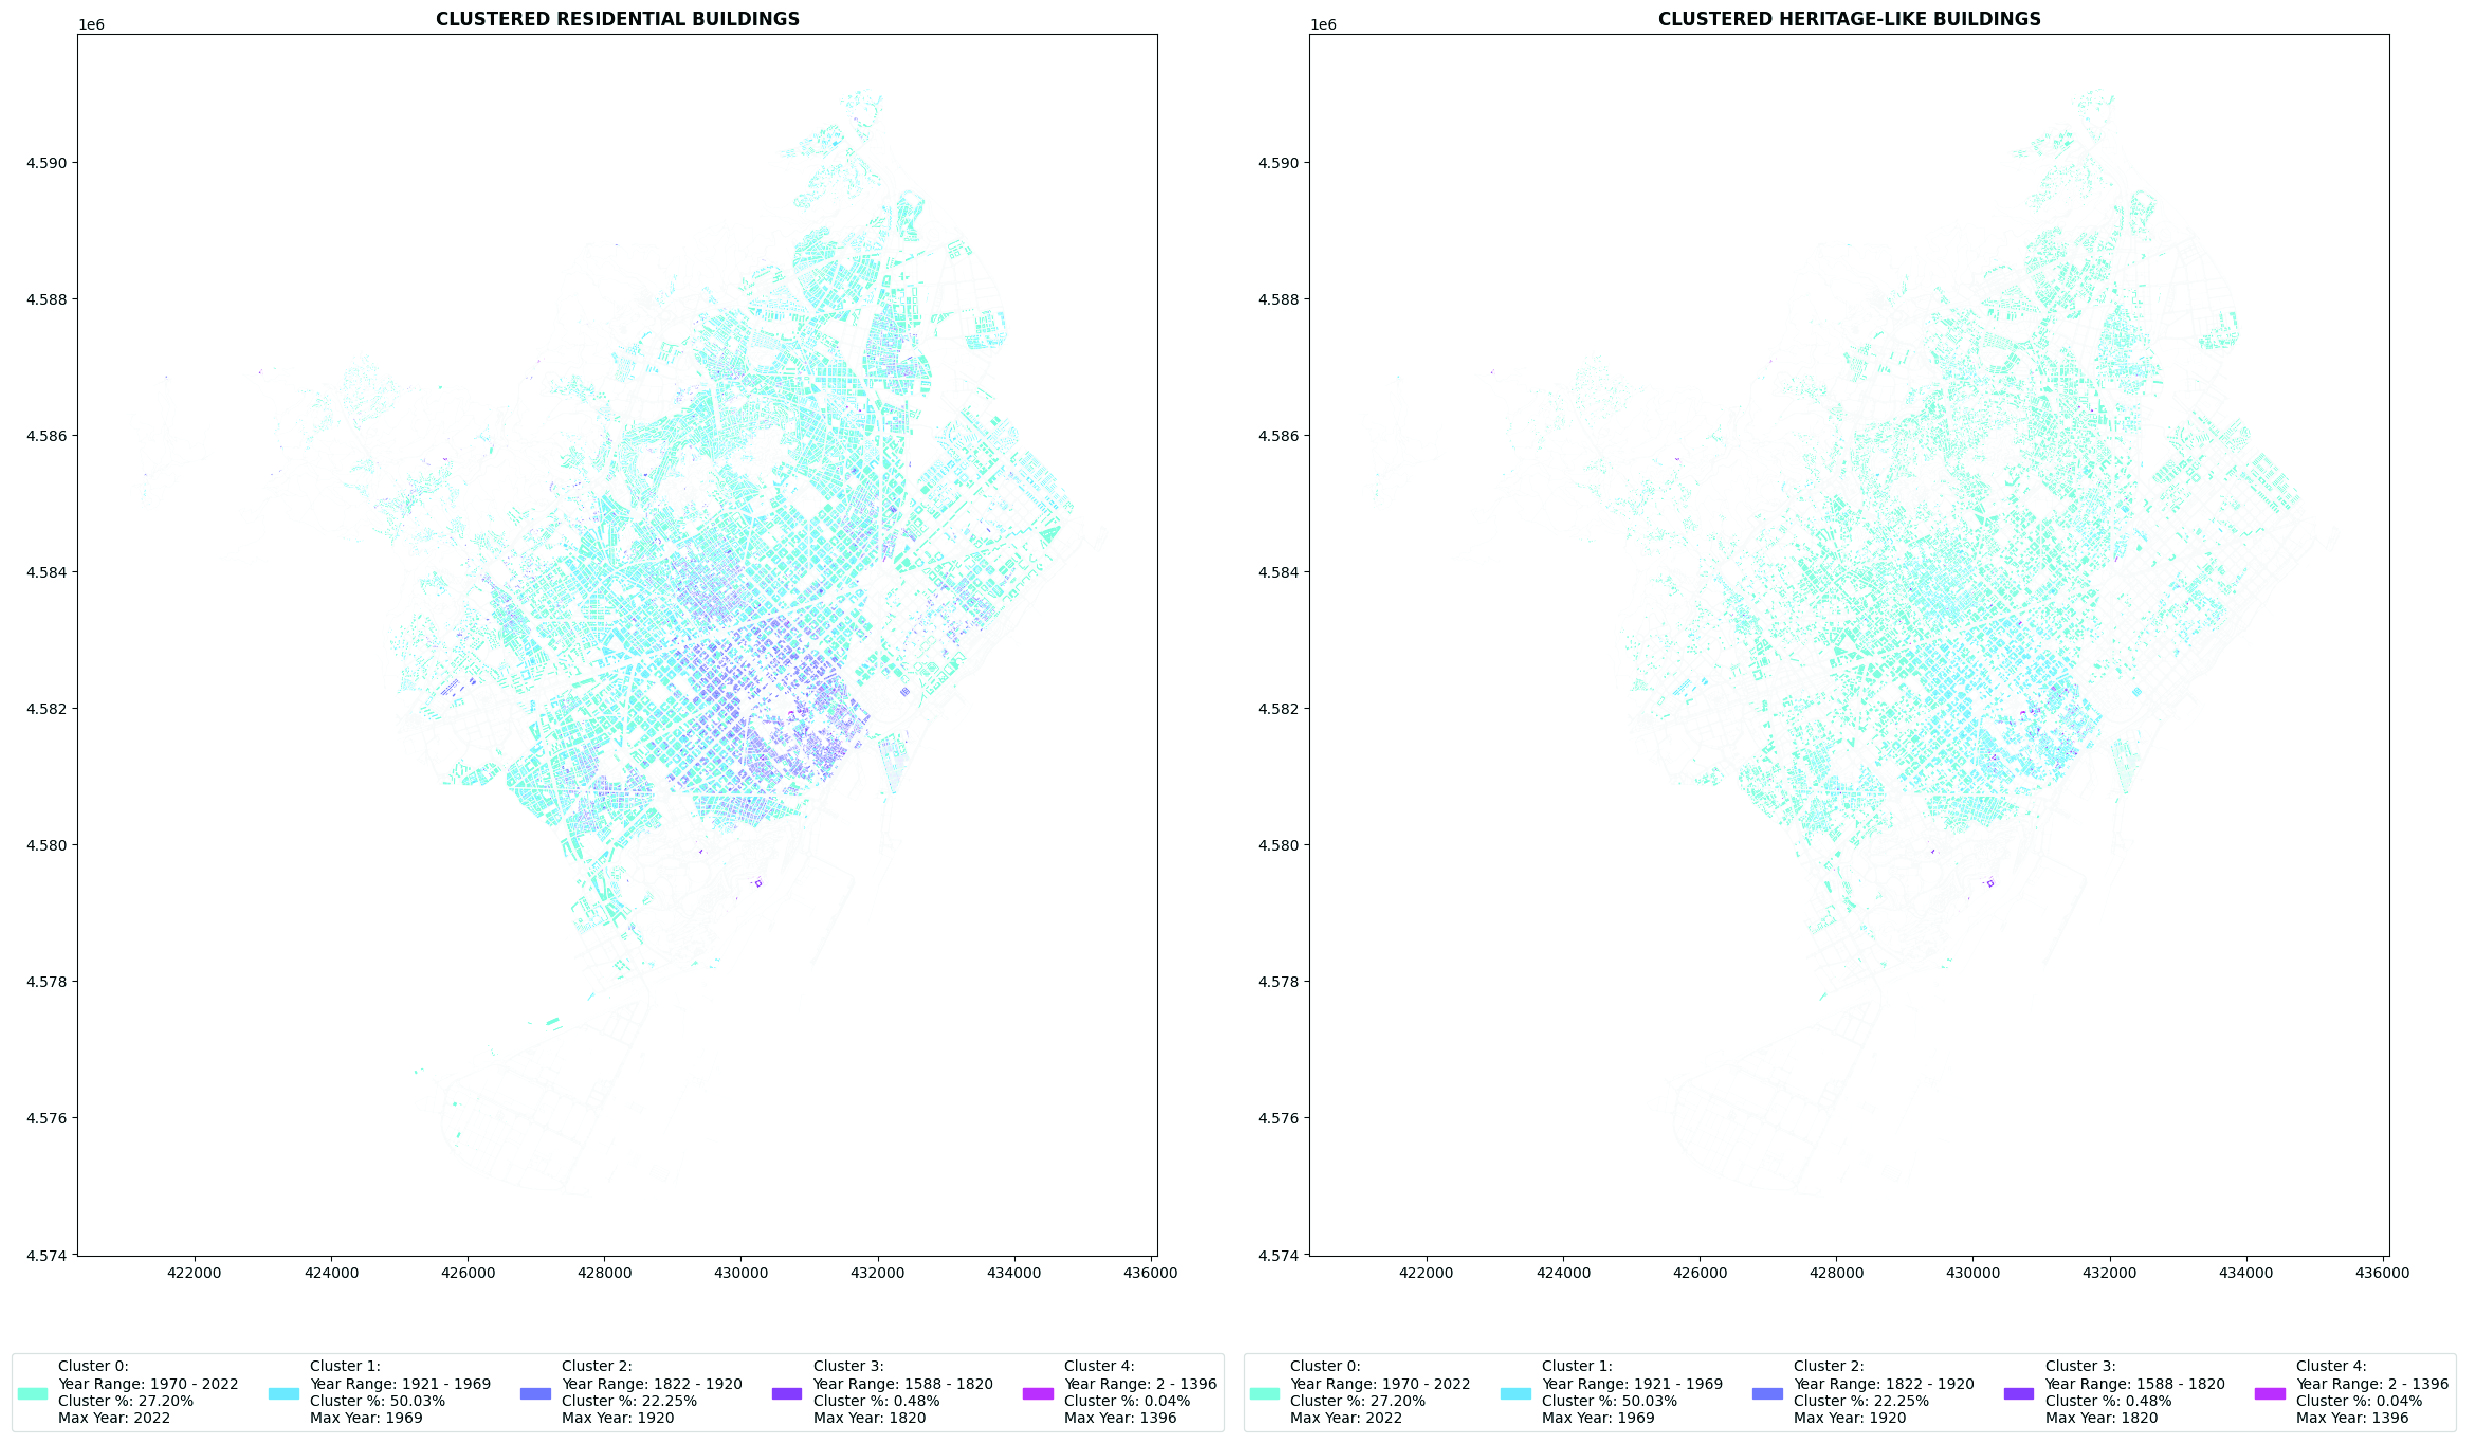
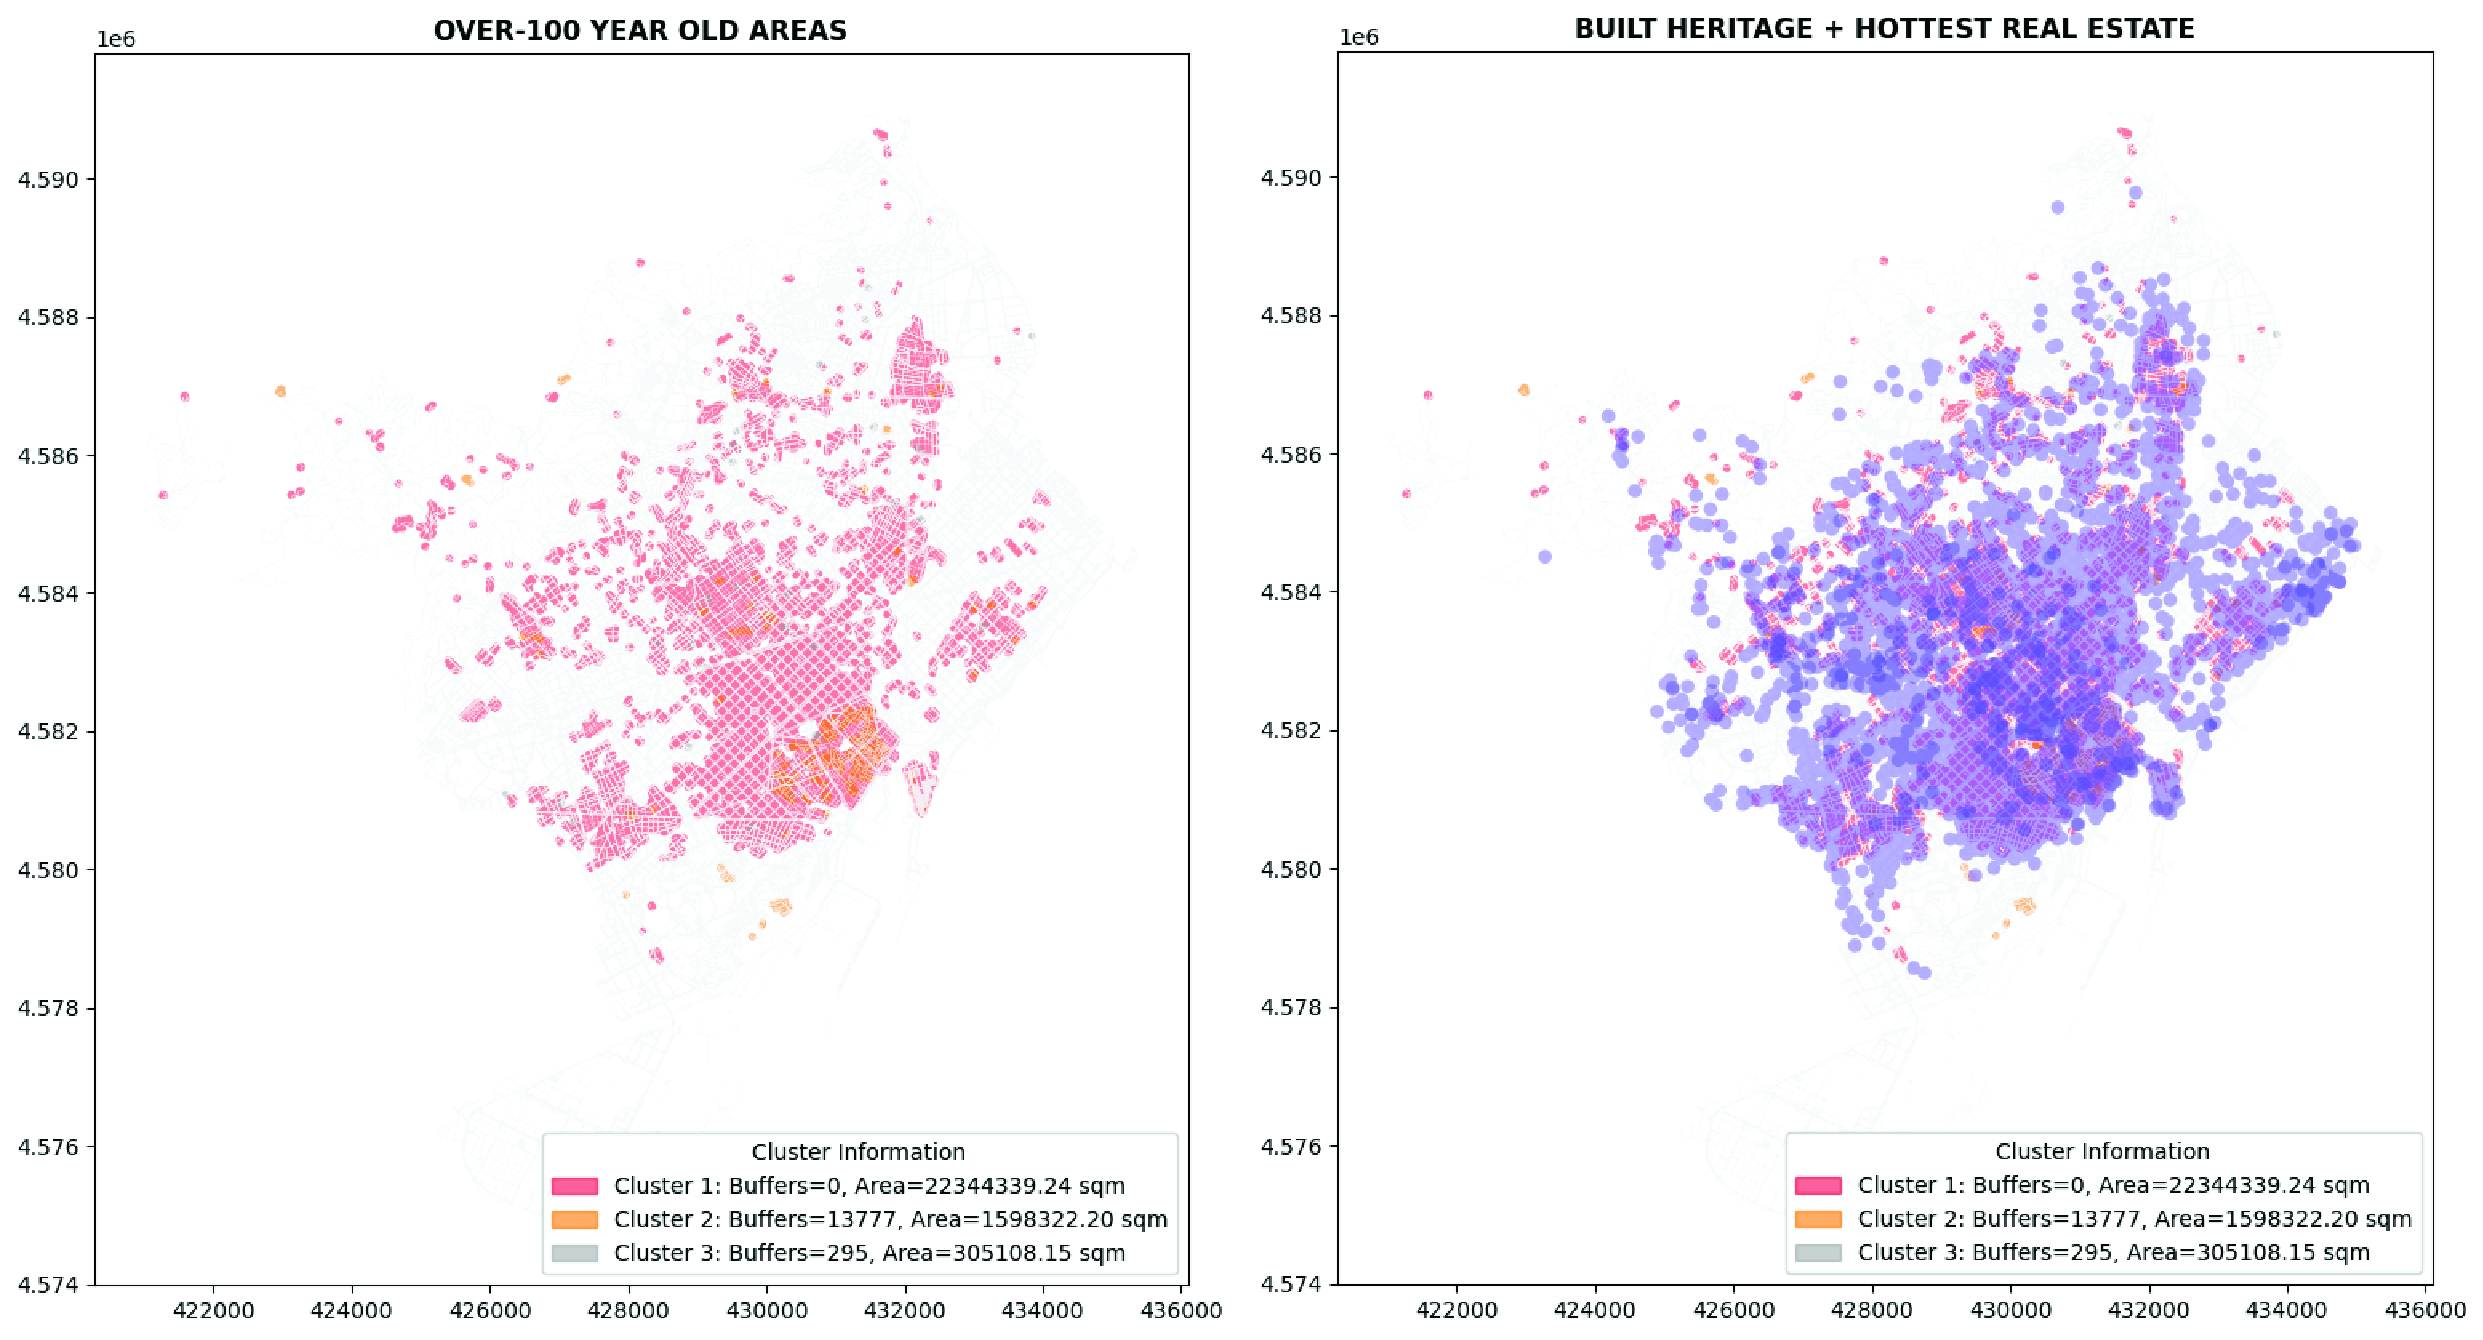
- Fetch buildings data from the public cadastre, categorize them by heritage-like and not (already 50 years old buildings could fit the built heritage policy requirements), cluster buildings, make buffers 400m, match amount of heritage-like buildings with the Barcelona neighborhood shapefile,
- Make a correlation between mean, max, min and average price per sqm and heritage buffer zones, heritage-like buffer zones,
- Evaluate the hypothesis, check the data on conditions of heritage buildings in non-correlated zones,
Data and tools
We are going to use a fetched by map of building footprints from the official public cadastre web site, scraped data of real estate sales, heritage sites and points from osm map, neighborhood boundaries of Barcelona from the Geography Institute of Catalonia,
It is known that Idealista and Fotocasa are the top real estate web portals. In order to compare results and select the best way, we are going to achieve listings’ data with scraping and API procedures.
data sources:
openstreet map
Institut Cartogràfic i Geològic de Catalunya
public cadastre of Spain
idealista.es – Spain real estate web portal #1
fotocasa.es – Spain real estate web portal #2
tools:
Idealista API + Selenium + Pandas + Geopandas + Numpy + Folium + BeautifulSoup + OSMNX + Matplotlib + Plotly + Networks + PyTorch + Mapbox API
Analysis
Retrieving data via Idealista API, 50 entries max per 1 request, max 100 requests free per month, so max 100*50 = 500 entries maximum for a dataset could be achieved gratis per a month. Idealista2 API provides gratis 50 entries max per 1 request, max 500 requests free per month, so max 500*50 = 2500 entries for a dataset are available. So, next we try use the previously scraped dataset from www.fotocasa.es.
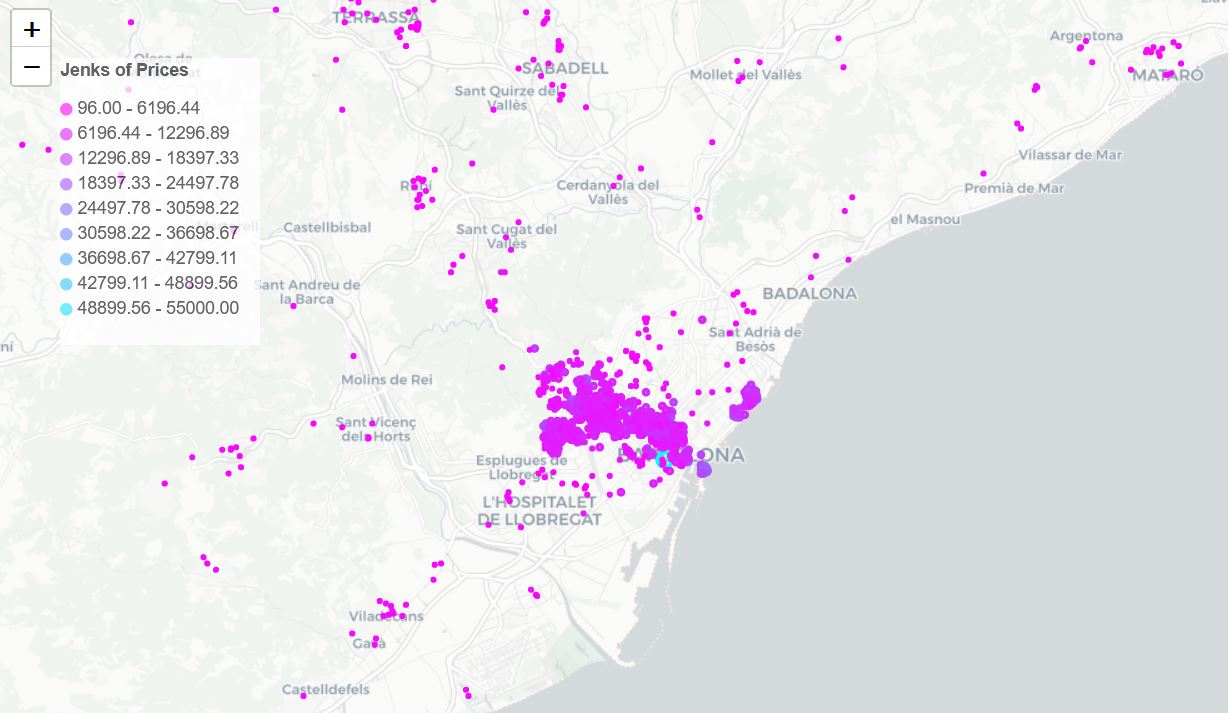
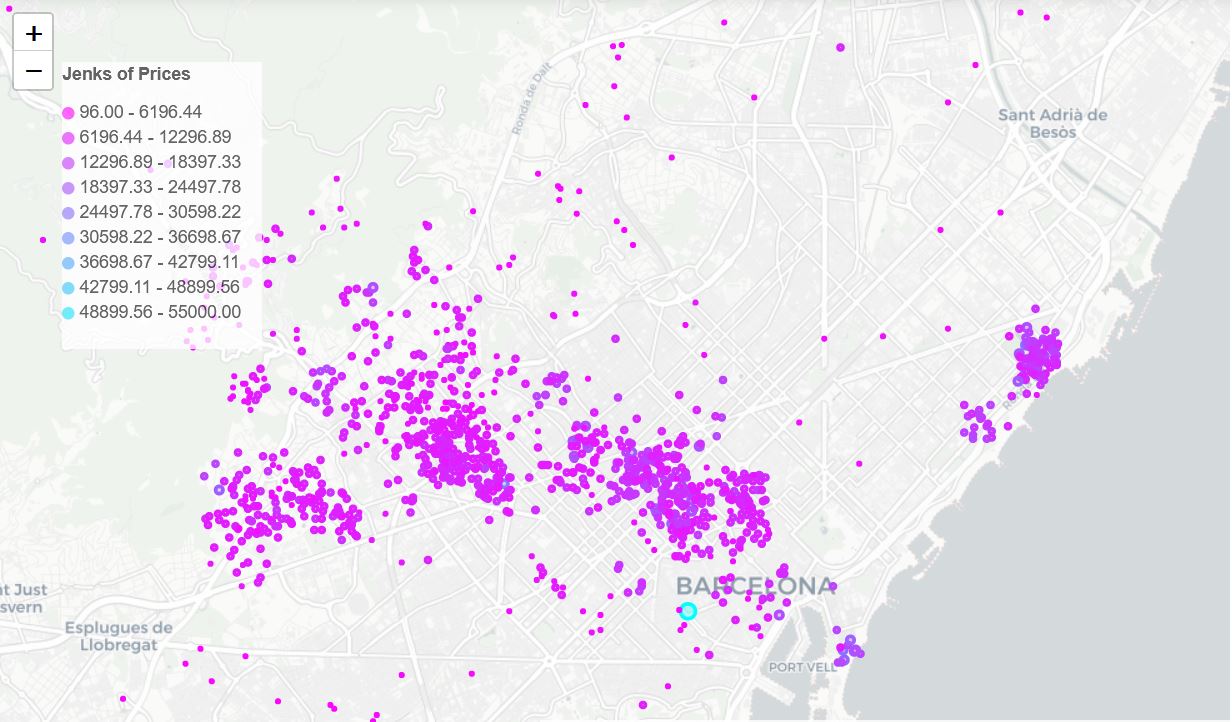
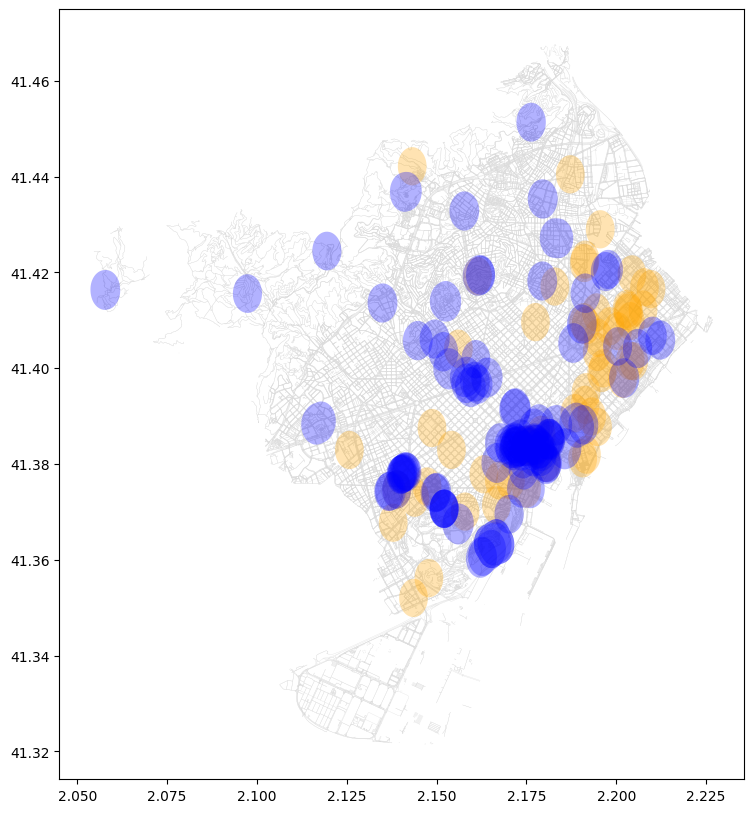
Merging data from fotocasa.es with Barcelona neighborhoods we achieve amount of listings, minimum, maximum, average, mean, medium prices.
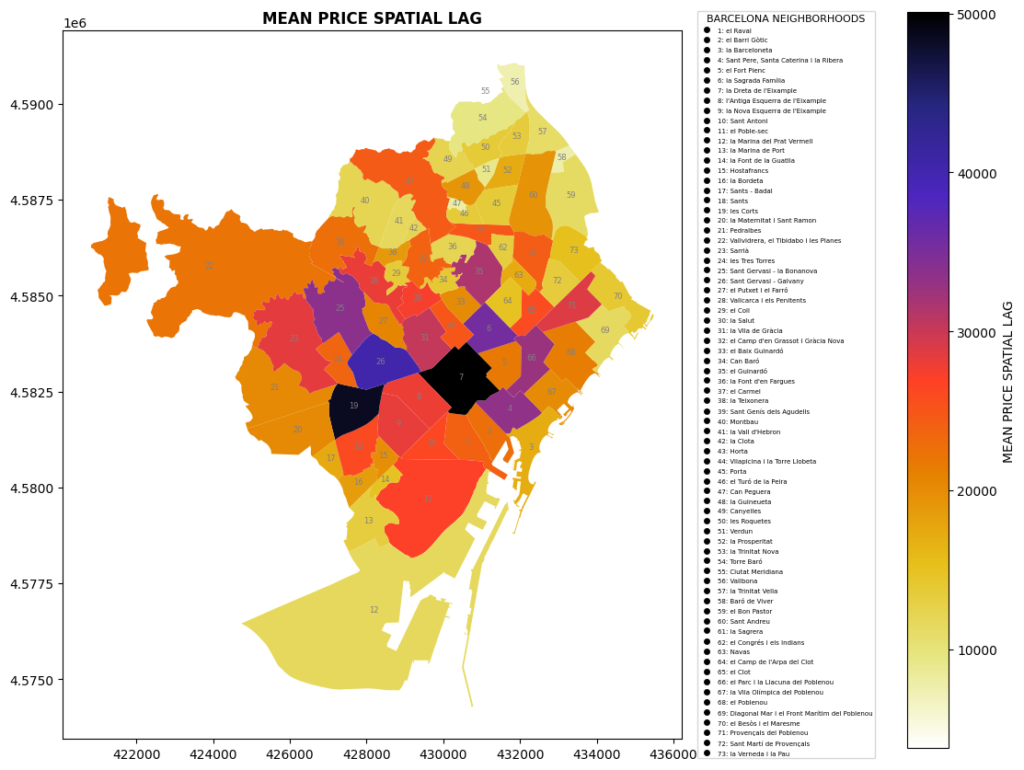
Spatial lag indicates largest demand for real estate in neighborhoods La Dreta and Les Cortes.
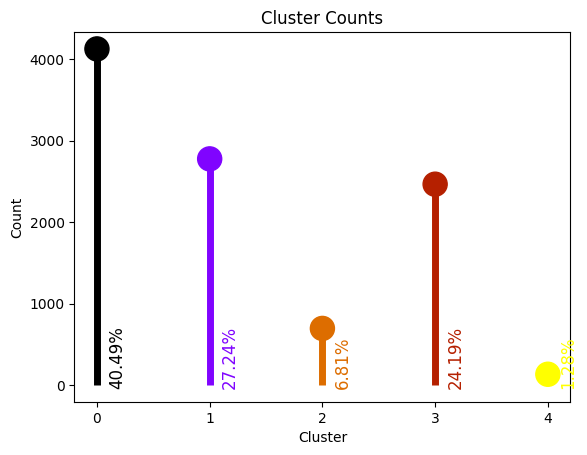
From price by neighborhood analysis we can definitely identify neighborhoods with the largest sale flux of homes, the most expensive and the most cheap neighborhoods. Finally, we are going to clusterize listings on a map.
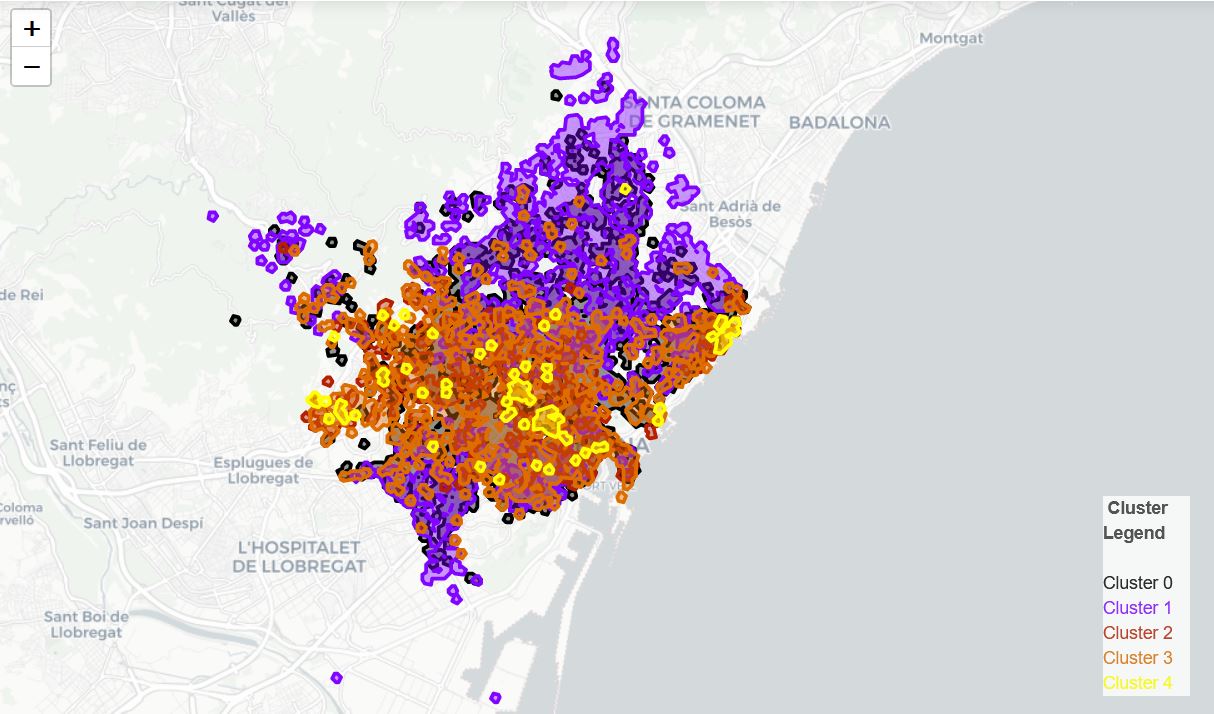
Next step, we make isochrones of heritage sites taken from the openstreetmap. First, we used only the osm point-geometry heritage.
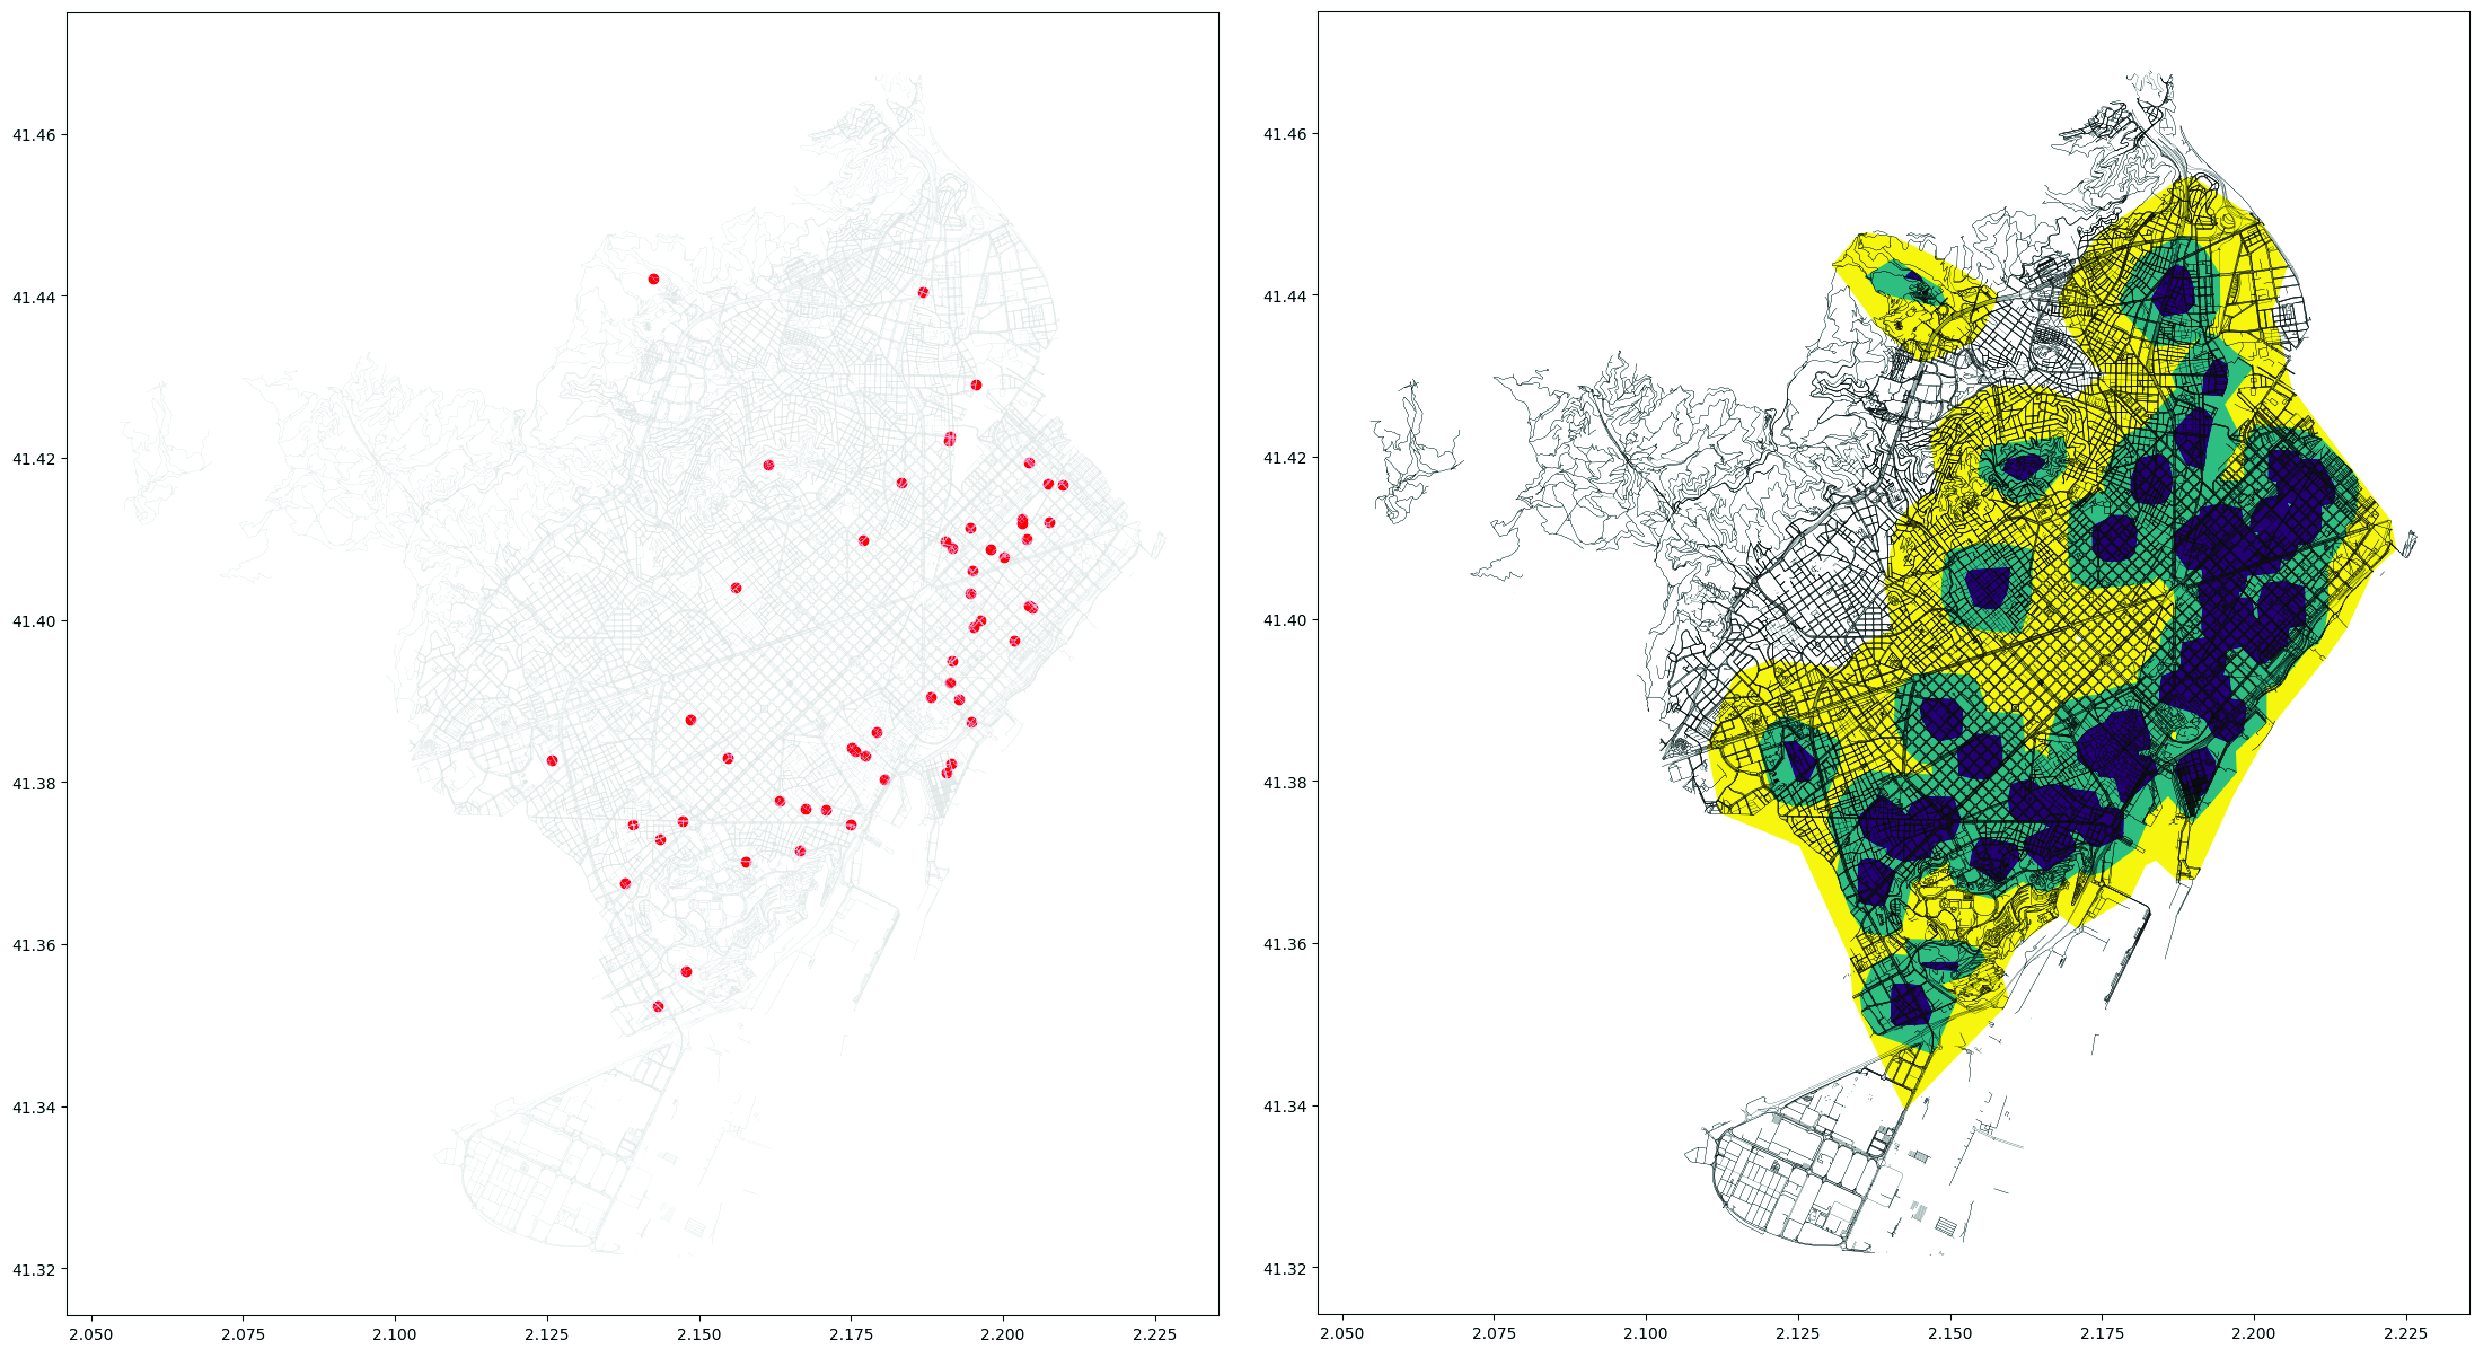
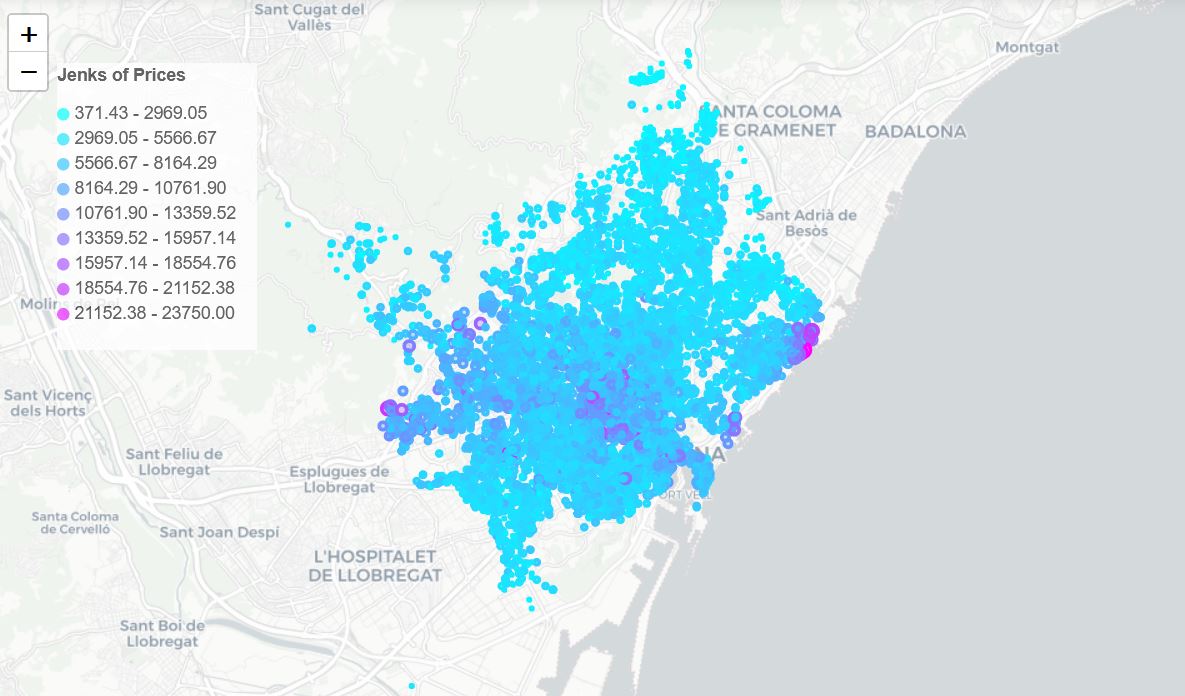
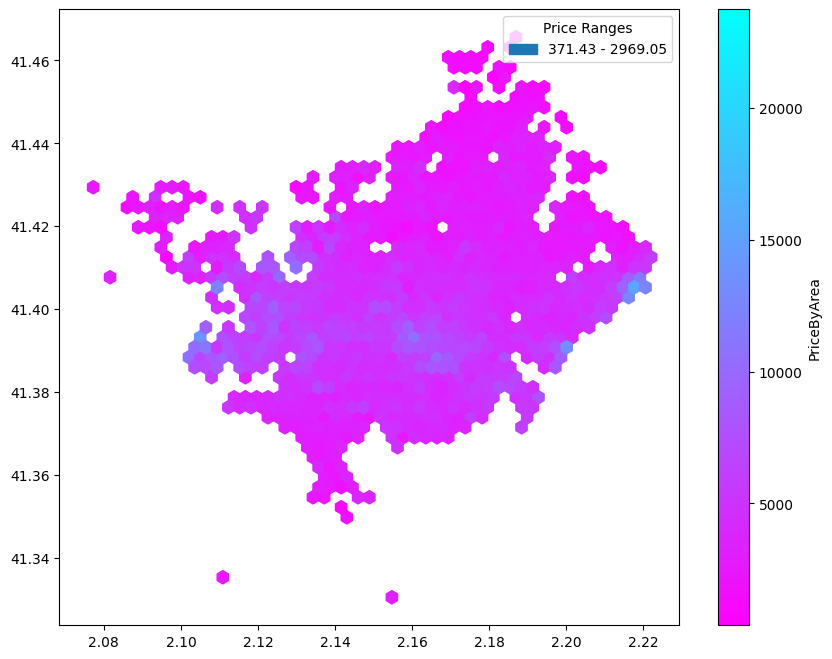
Let’s select 10-min walk isochrones for the correlation with prices per sqm of homes achieved from fotocasa.es.
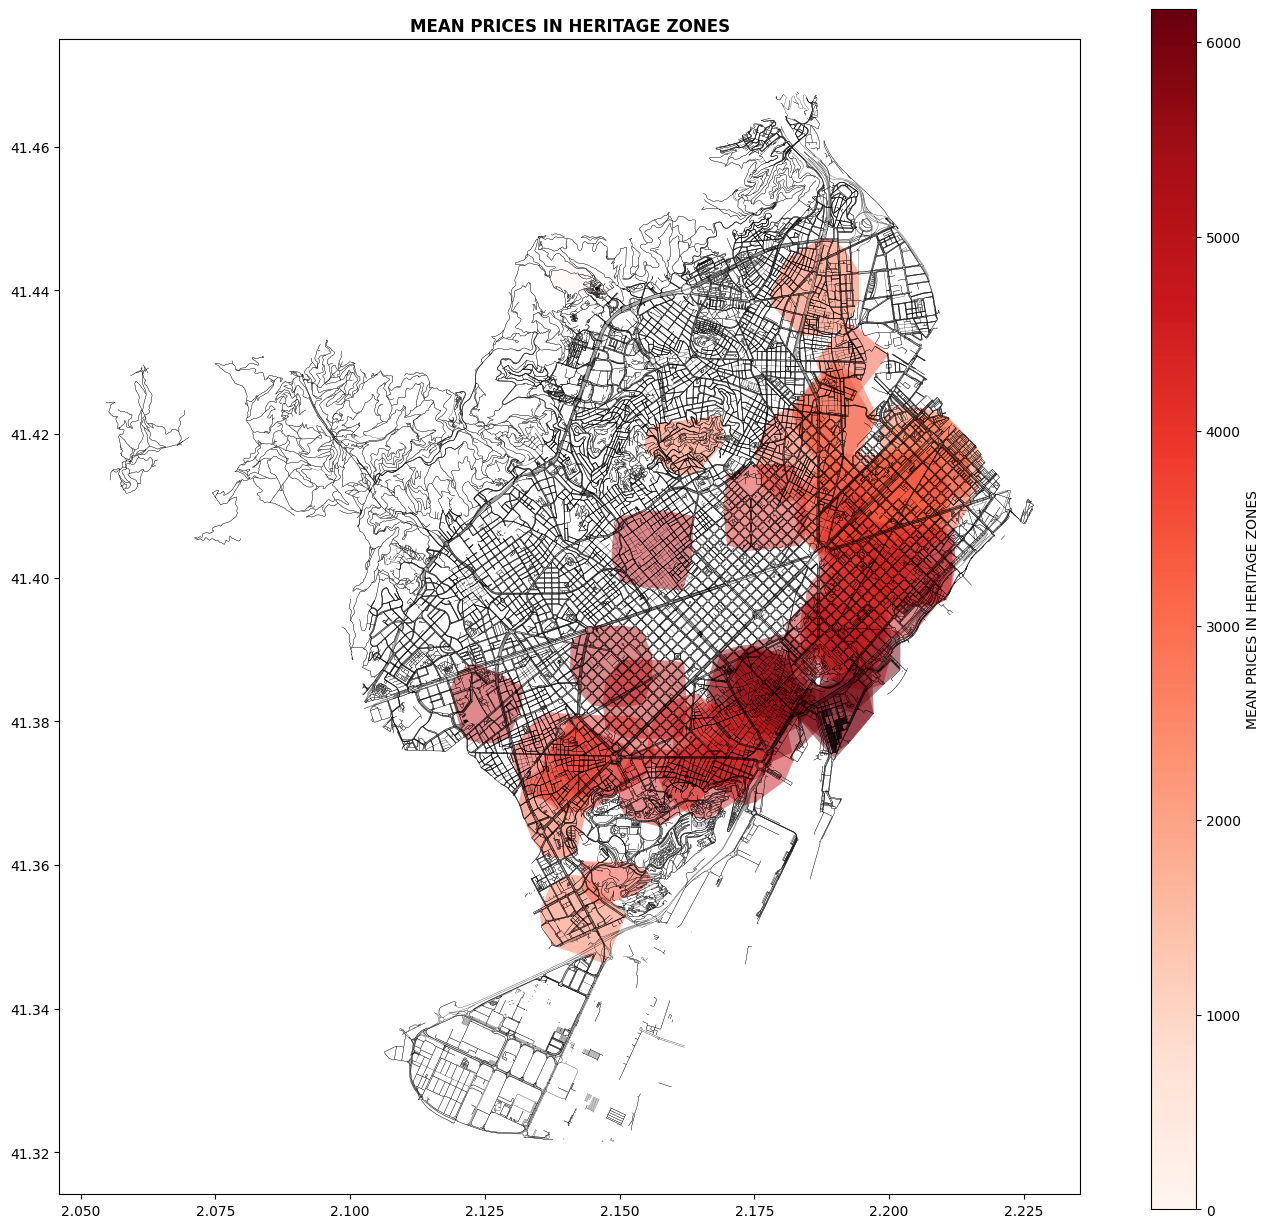
As we can see the darkest, id est the highest mean prices are concentrated in Barcelonetta, Gothic Quartier and further to Passeig Gracia. Although not all heritage isochrones contain equal values. There is still an ample room for improving correlation with addition of polygon heritage isochrones, but let’s switch to another analysis by building age/real estate price.
Results
After conducting various analyses of the Barcelona case, a clear outcome is emerging: there is a steadily correlation between built heritage and the real estate market. Over 50% of all residential buildings are older 50 years that automatically fits to the built-heritage age according to EU regulations. Even without considering additional parameters such as the renovation status of a building or the urban environment, this case study demonstrates that the highest price-to-square-meter ratio is consistently observed, particularly in terms of the mean and maximum ratios.
