
Hyperbuilding 2 functions as the transportation heart of the Vertical Machine, chanelling 20,000 passengers hourly while coordinating energy, logistics, and information flows across the entire urban system.
Our team tackled the Program development for HB02, using Revit and Rhino Inside Revit to build a parametric system where occupancy data directly generates architectural form. The studio divides into three specialized groups: Program, Structure, and Data. As the Program team, we translated human movement patterns and functional needs into spatial logic and computational geometry.
In an era where architecture is increasingly shaped by data and adaptability, this workflow explores how BIM workflows can make temporal data spatially legible during the design process. The time-responsive geometry serves as a design tool that reveals occupancy conflicts, informs program adjacencies, and tests spatial efficiency before the building is fixed at maximum capacity.
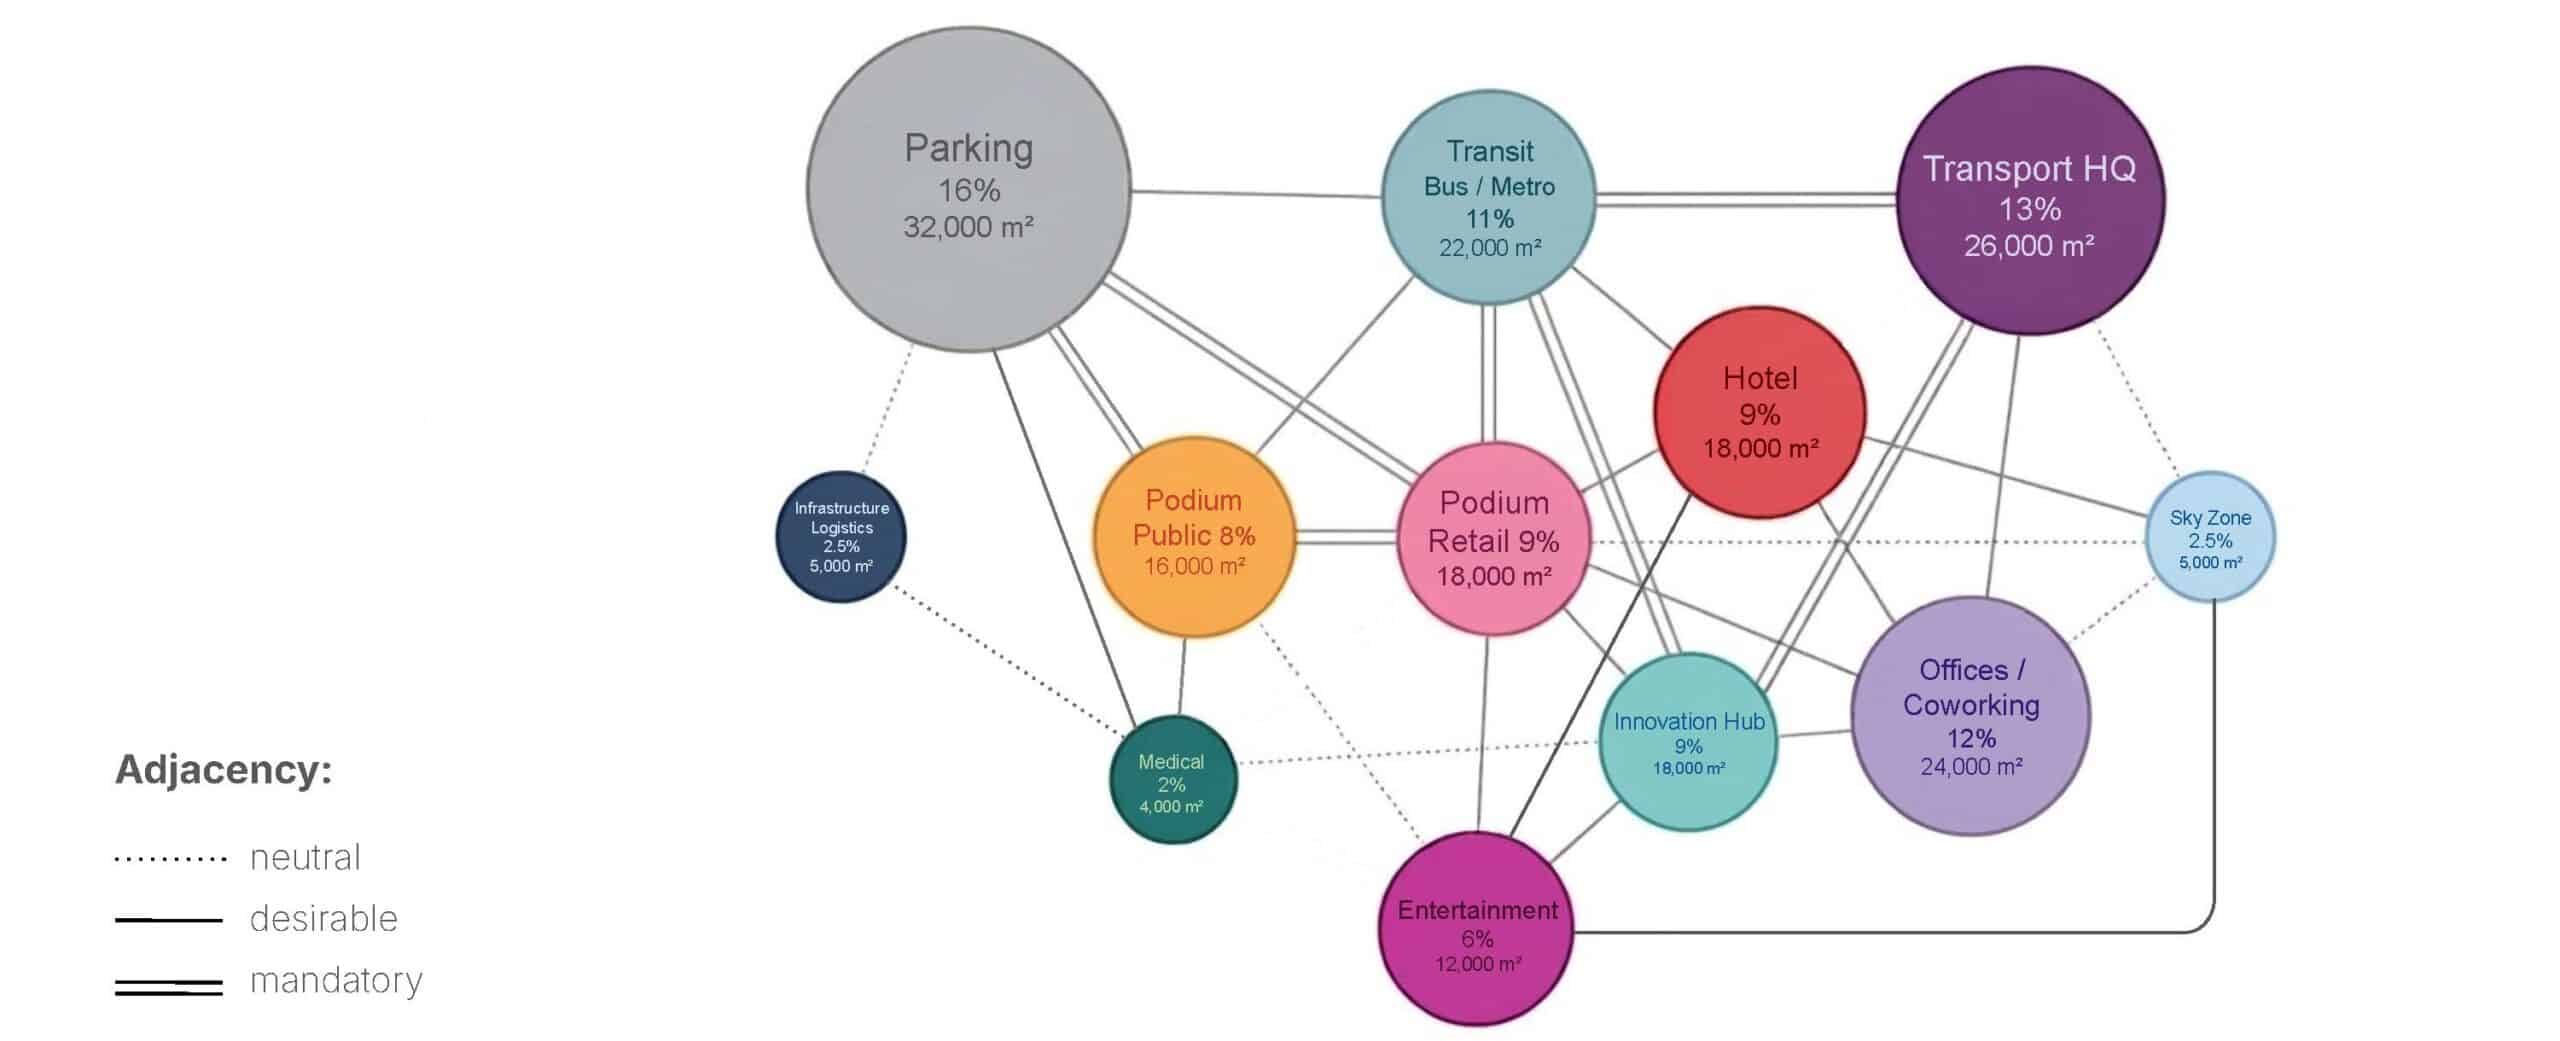
Program distribution
The network diagram shows adjacency relationships between program functions. Transportation and movement drive everything here: logistics, energy distribution, the Santiago Transport Headquarters, offices, leisure, hospitality, retail – they’re all sized and positioned to support the primary function, transit. Every square meter serves transit flow.
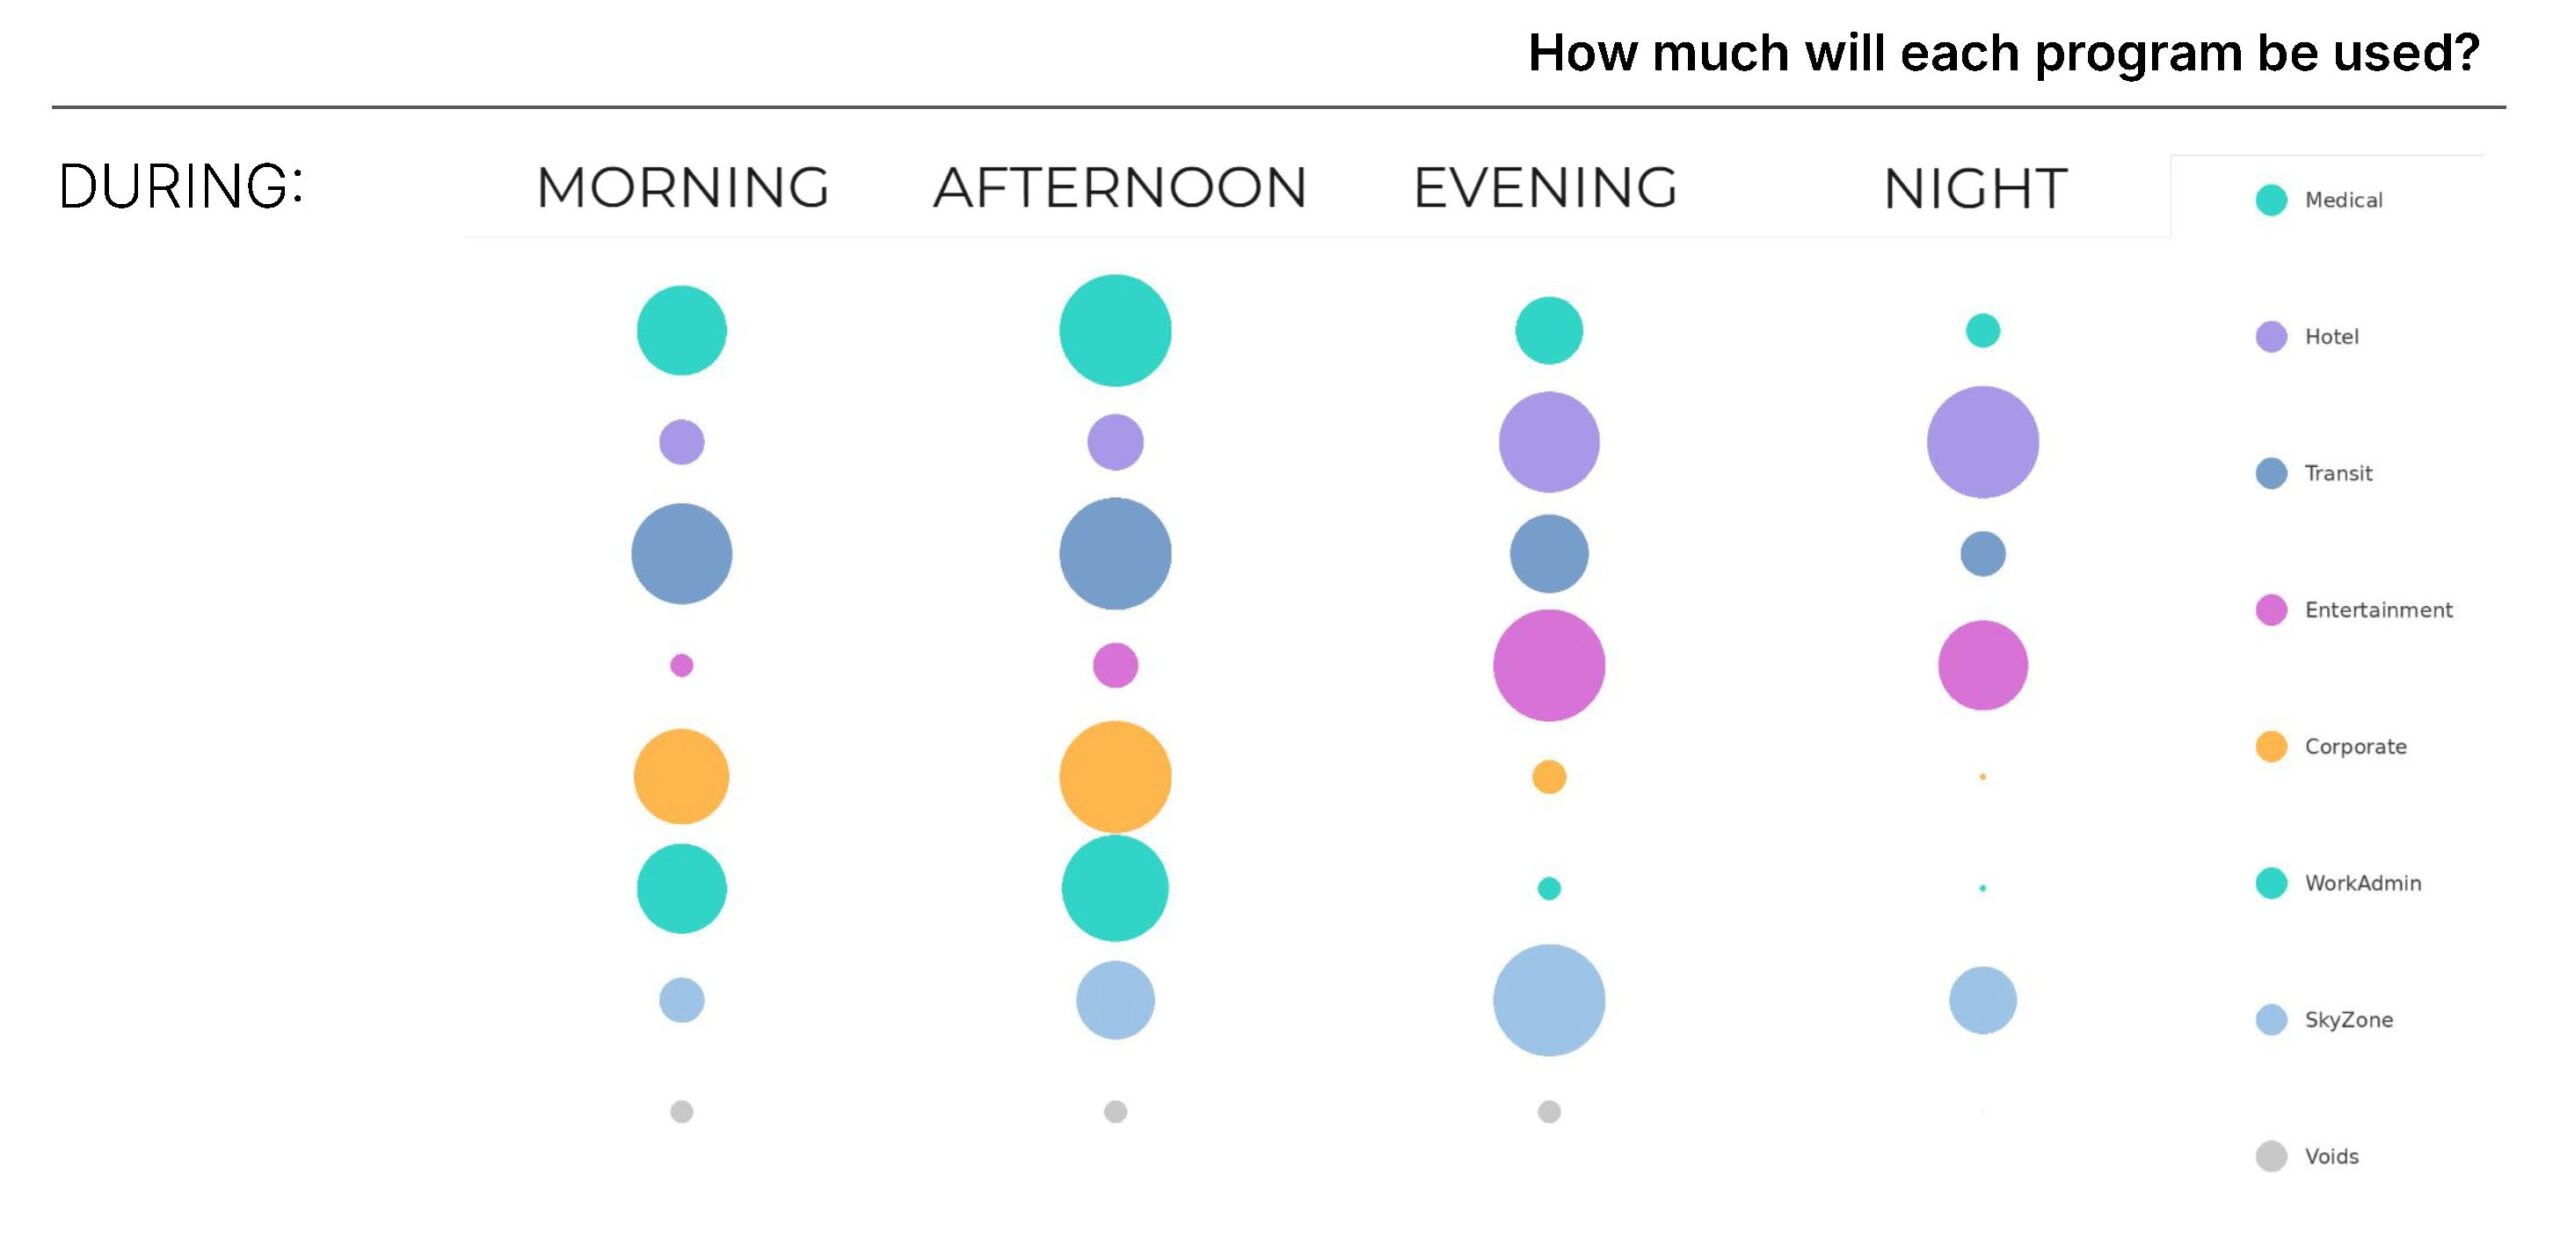
Program in Time
We asked ourselves, how will each program be used in time? Each circle shows a building program at a specific time of day. Size equals occupancy demand. Watch how Transit peaks during commutes, Hotels grow at night, Entertainment stretches in the evening, and Corporate collapses after hours. This is the logic behind our live Revit geometry – it reshapes itself based on time.
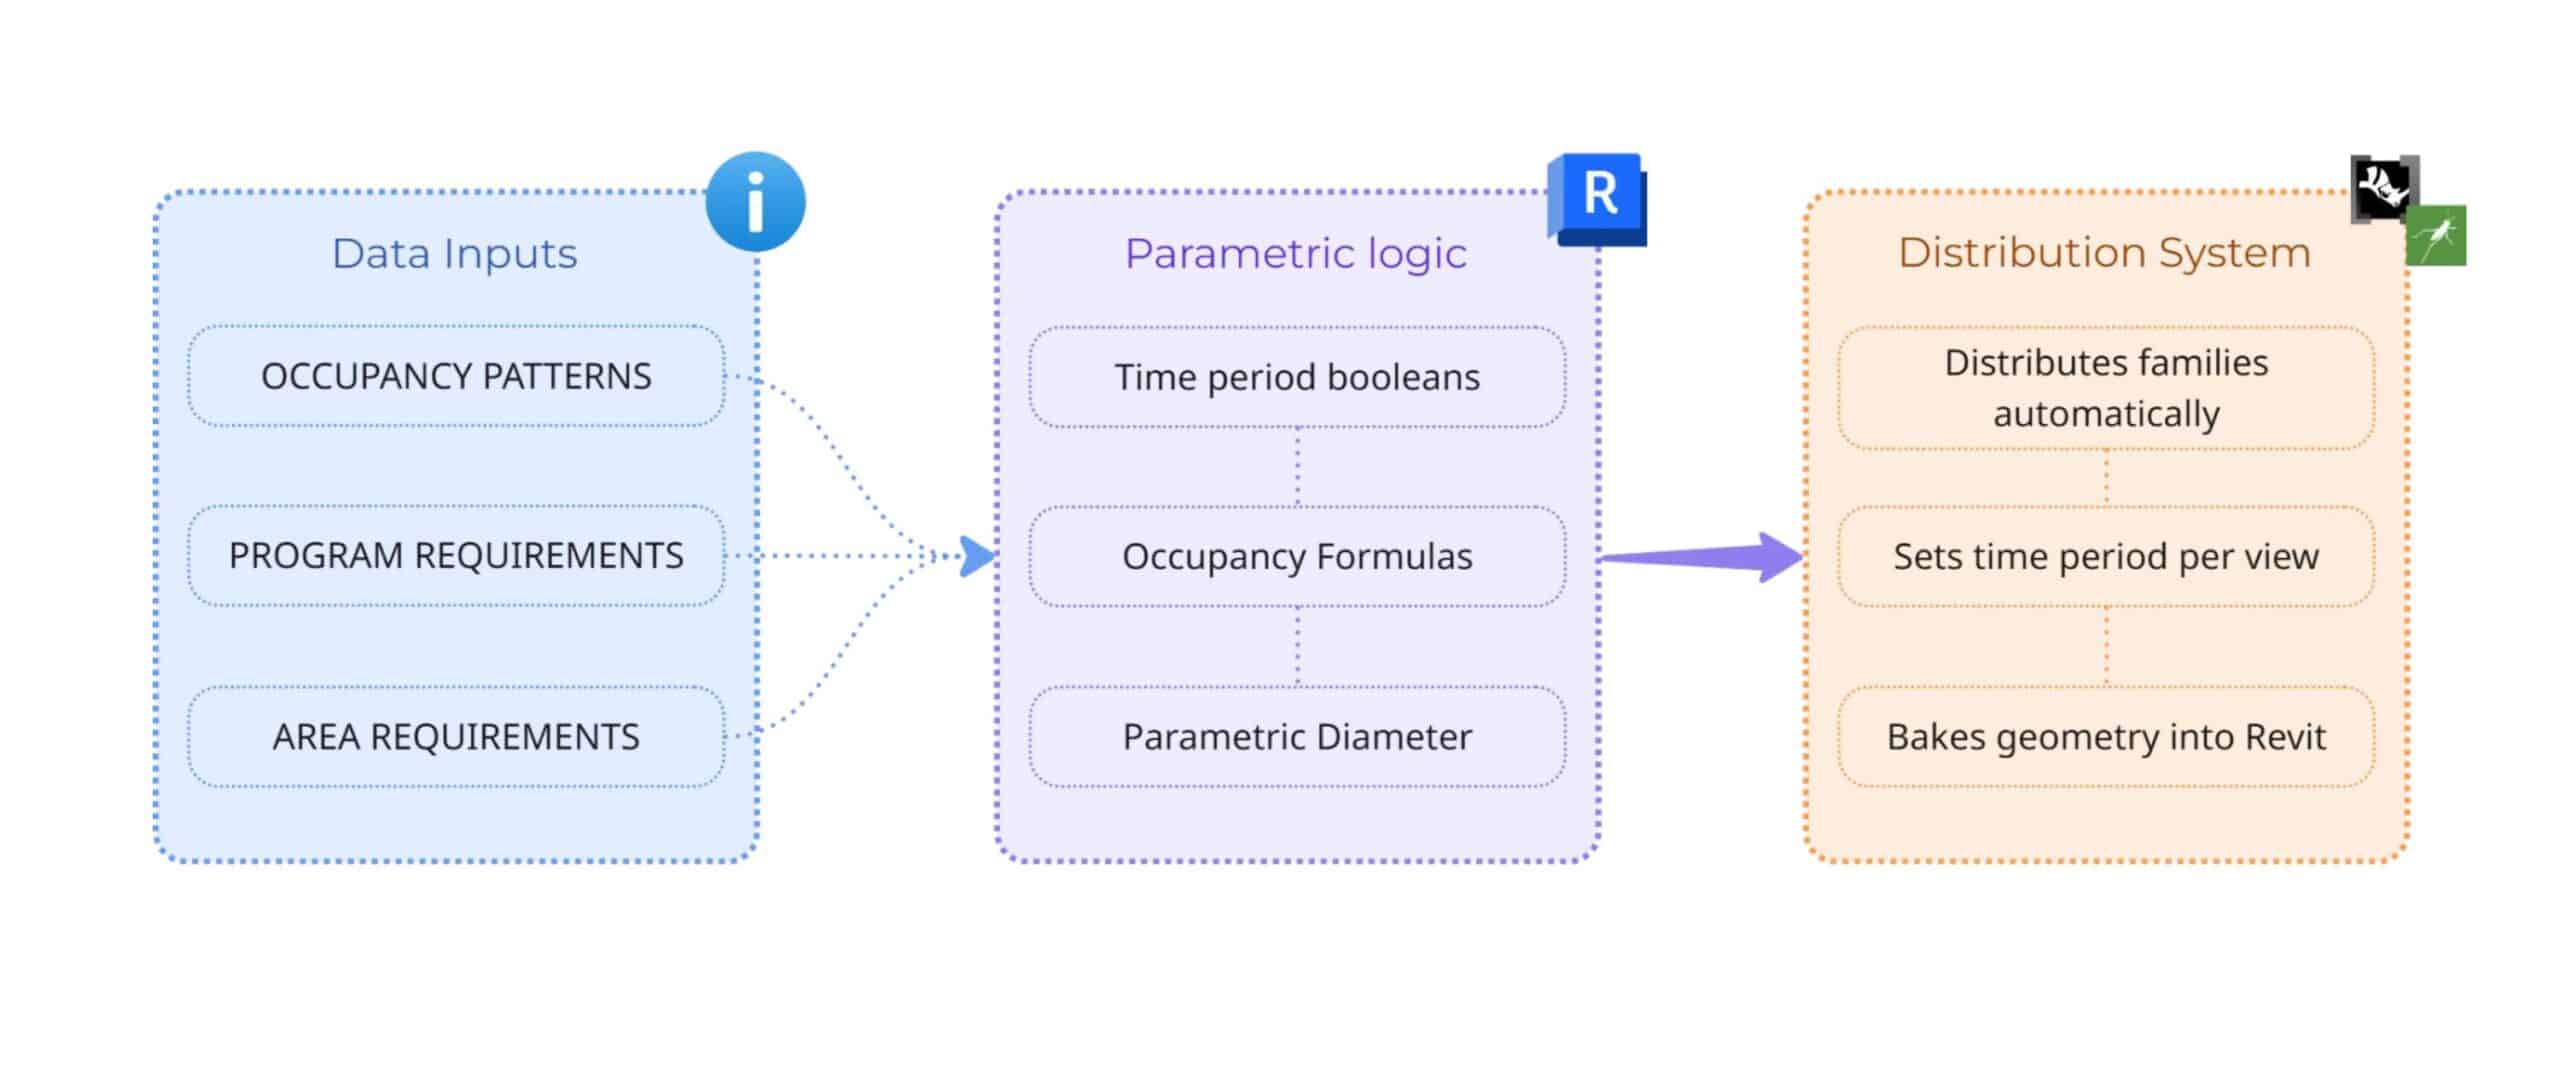
KPI-driven BIM Parametric Workflow
Our workflow transforms data into dynamic geometry through three key stages. First, we input occupancy patterns, program and area requirements. These feed into Revit’s parametric logic, where time period booleans trigger nested formulas that calculate diameter for each program type. Finally, Grasshopper distributes the families spatially, sets the time period per view, and bakes the geometry back into Revit. The result is a building that automatically resizes based on occupancy flow throughout the day.
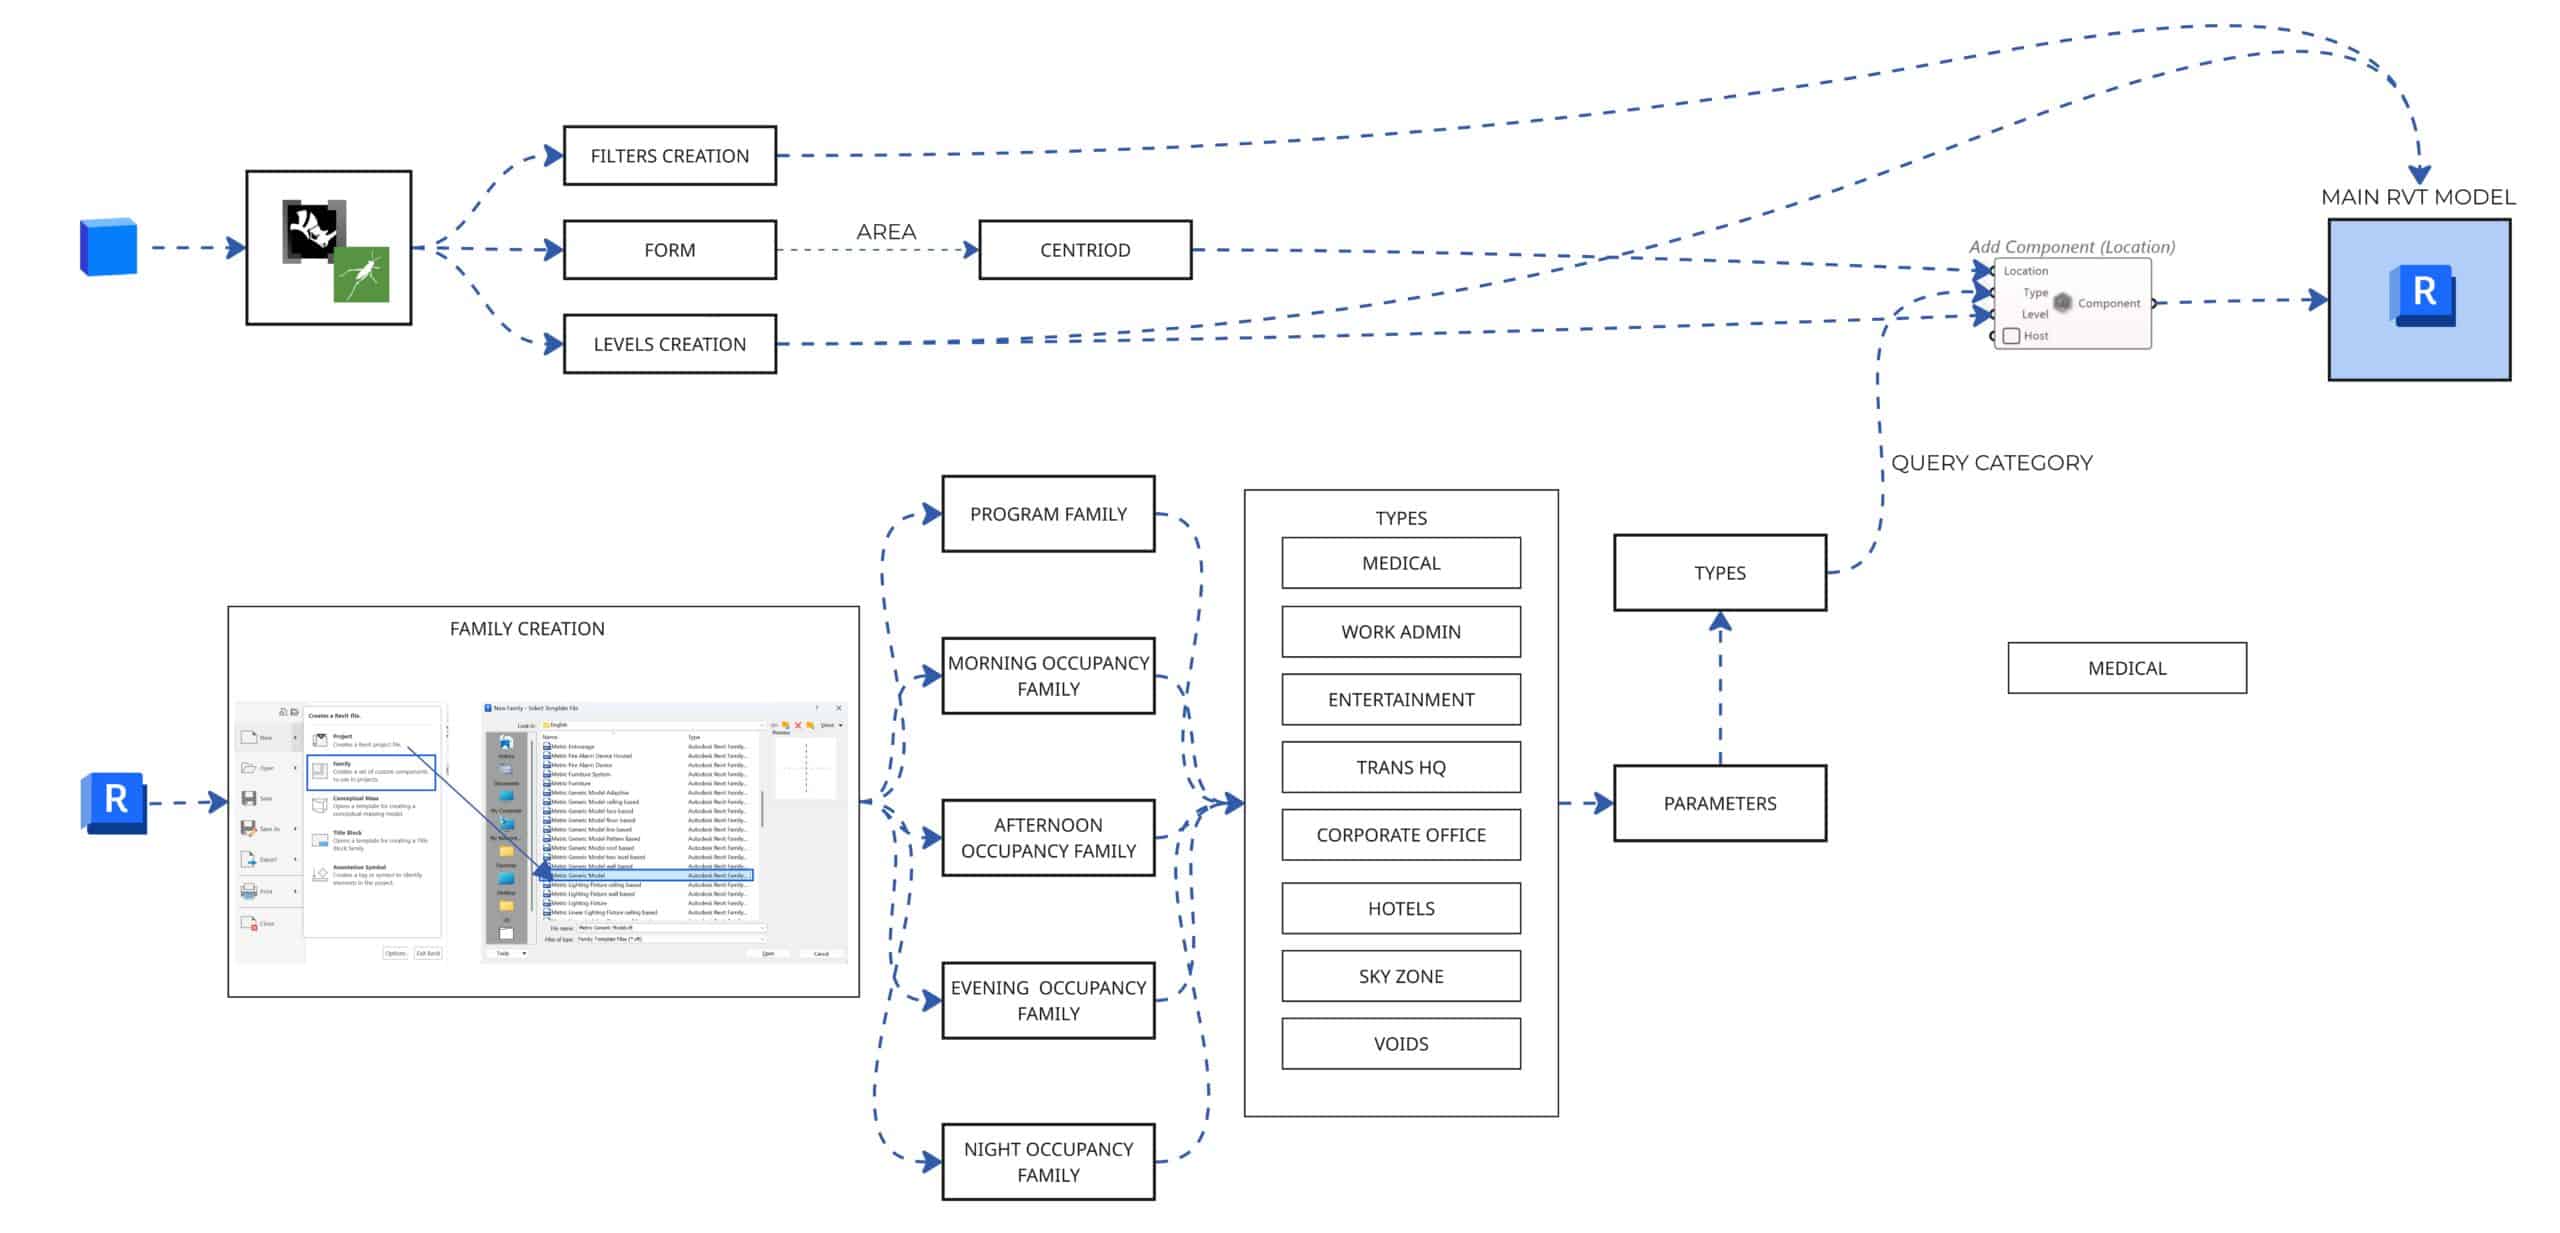
Workflow
The process begins with Speckle, which streams geometry data into the system, enabling seamless interoperability and real-time data exchange. In parallel, the Revit model feeds into a family creation pipeline, establishing the core parametric families that drive the entire system.
This data pipeline enables the simultaneous generation of:
- Filters
- Form
- Levels
A critical step within this stage is the computation of the centroid from the form’s area, which precisely determines the spatial placement of each component within the model.
Five key parametric families are developed:
- Program Block
- Morning Occupancy
- Afternoon Occupancy
- Evening Occupancy
- Night Occupancy
These are organized through a query-based category system, covering diverse program types such as Medical, Work Admin, Entertainment, Transit HQ, Corporate Office, Hotels, Sky Zone, and Voids.
Finally, all extracted parameters and categorized data are reintegrated into the main Revit model through location-based placement, ensuring a fully coordinated, data-driven output.
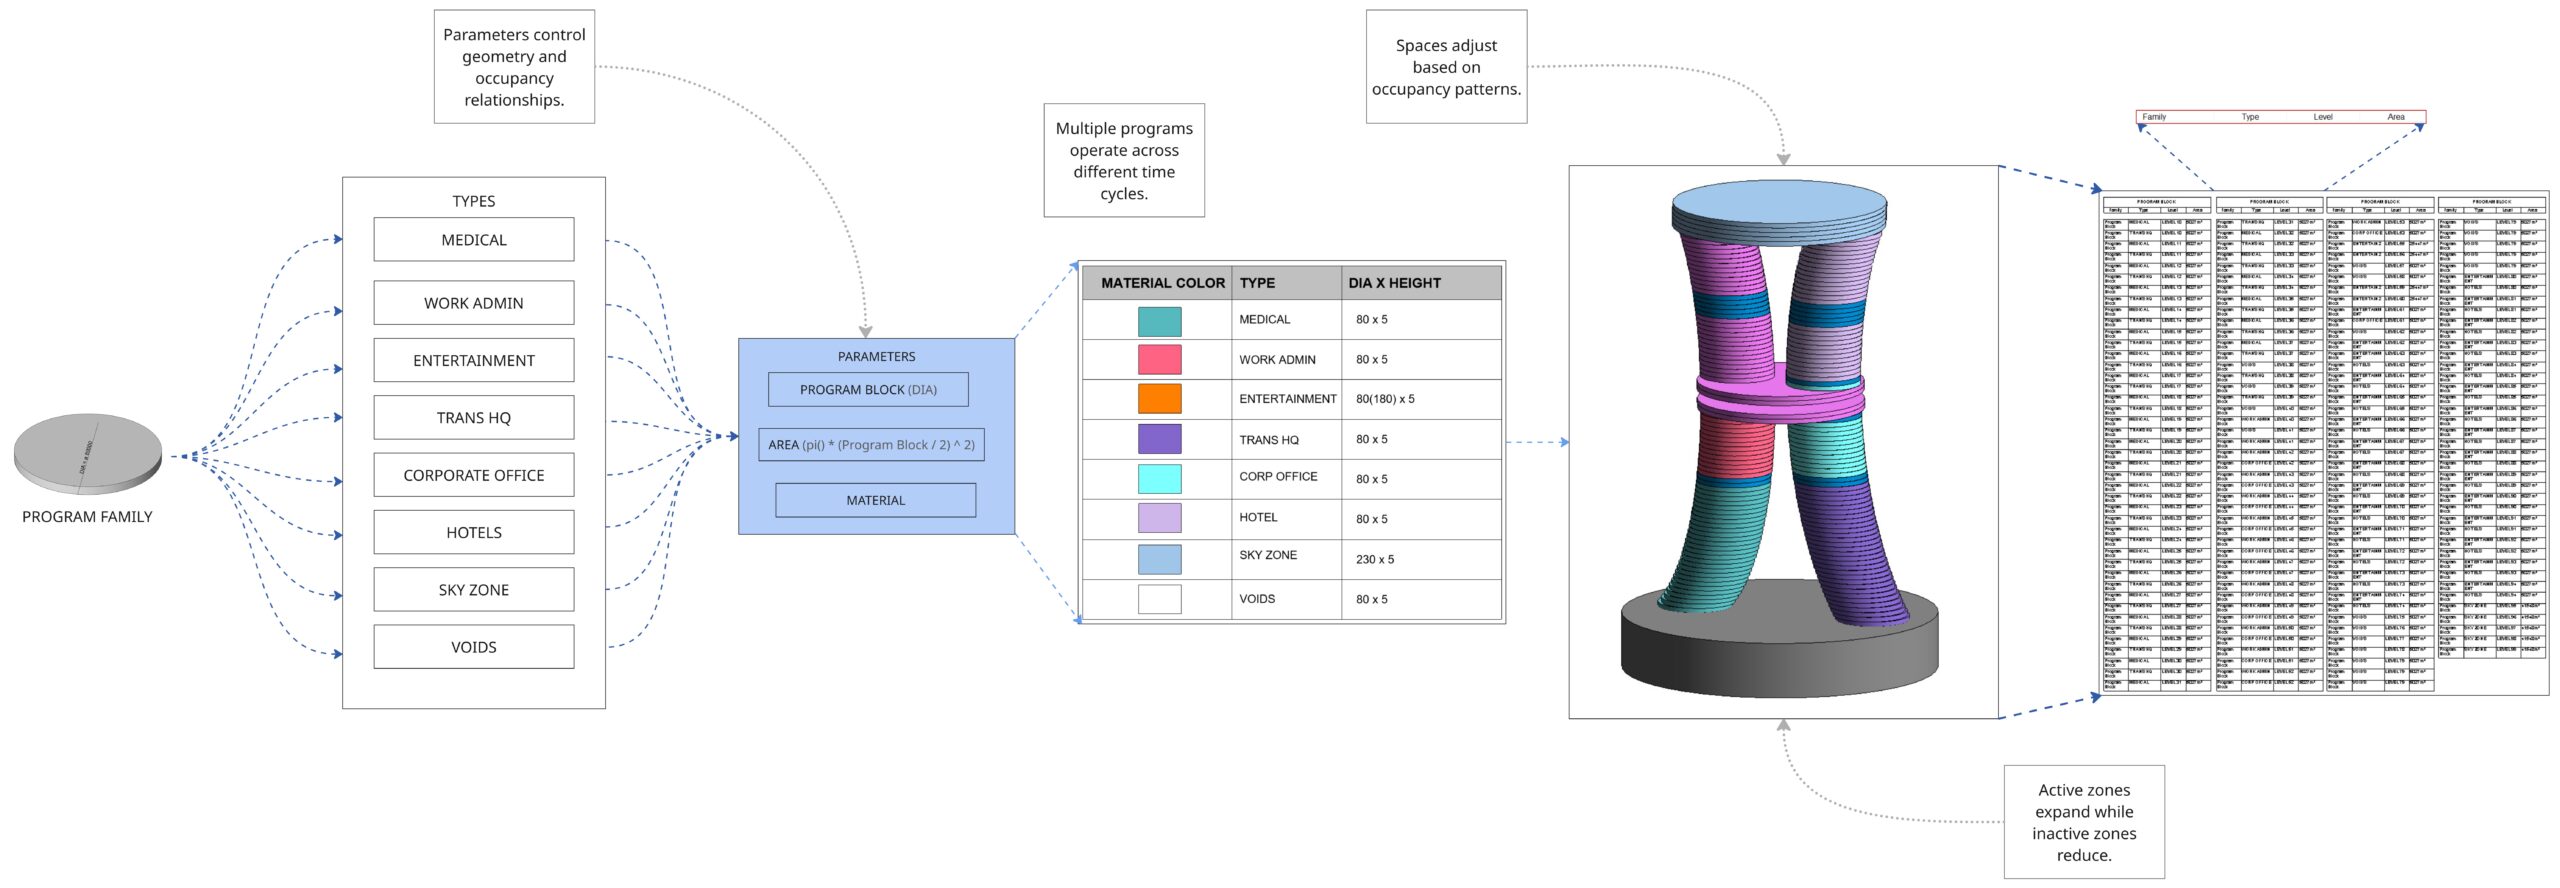
The Program Block: A Responsive Core
At the heart of the system lies the Program Block, an adaptive framework that defines the building’s spatial logic.
Eight distinct zone types are assigned:
- Unique material identities
- Parametric dimensions
- Area-based formulas
The system dynamically adjusts:
- Active zones expand
- Inactive zones contract
This allows the tower’s geometry to continuously respond to changing occupancy patterns, making the building behave as a living system rather than a static structure.
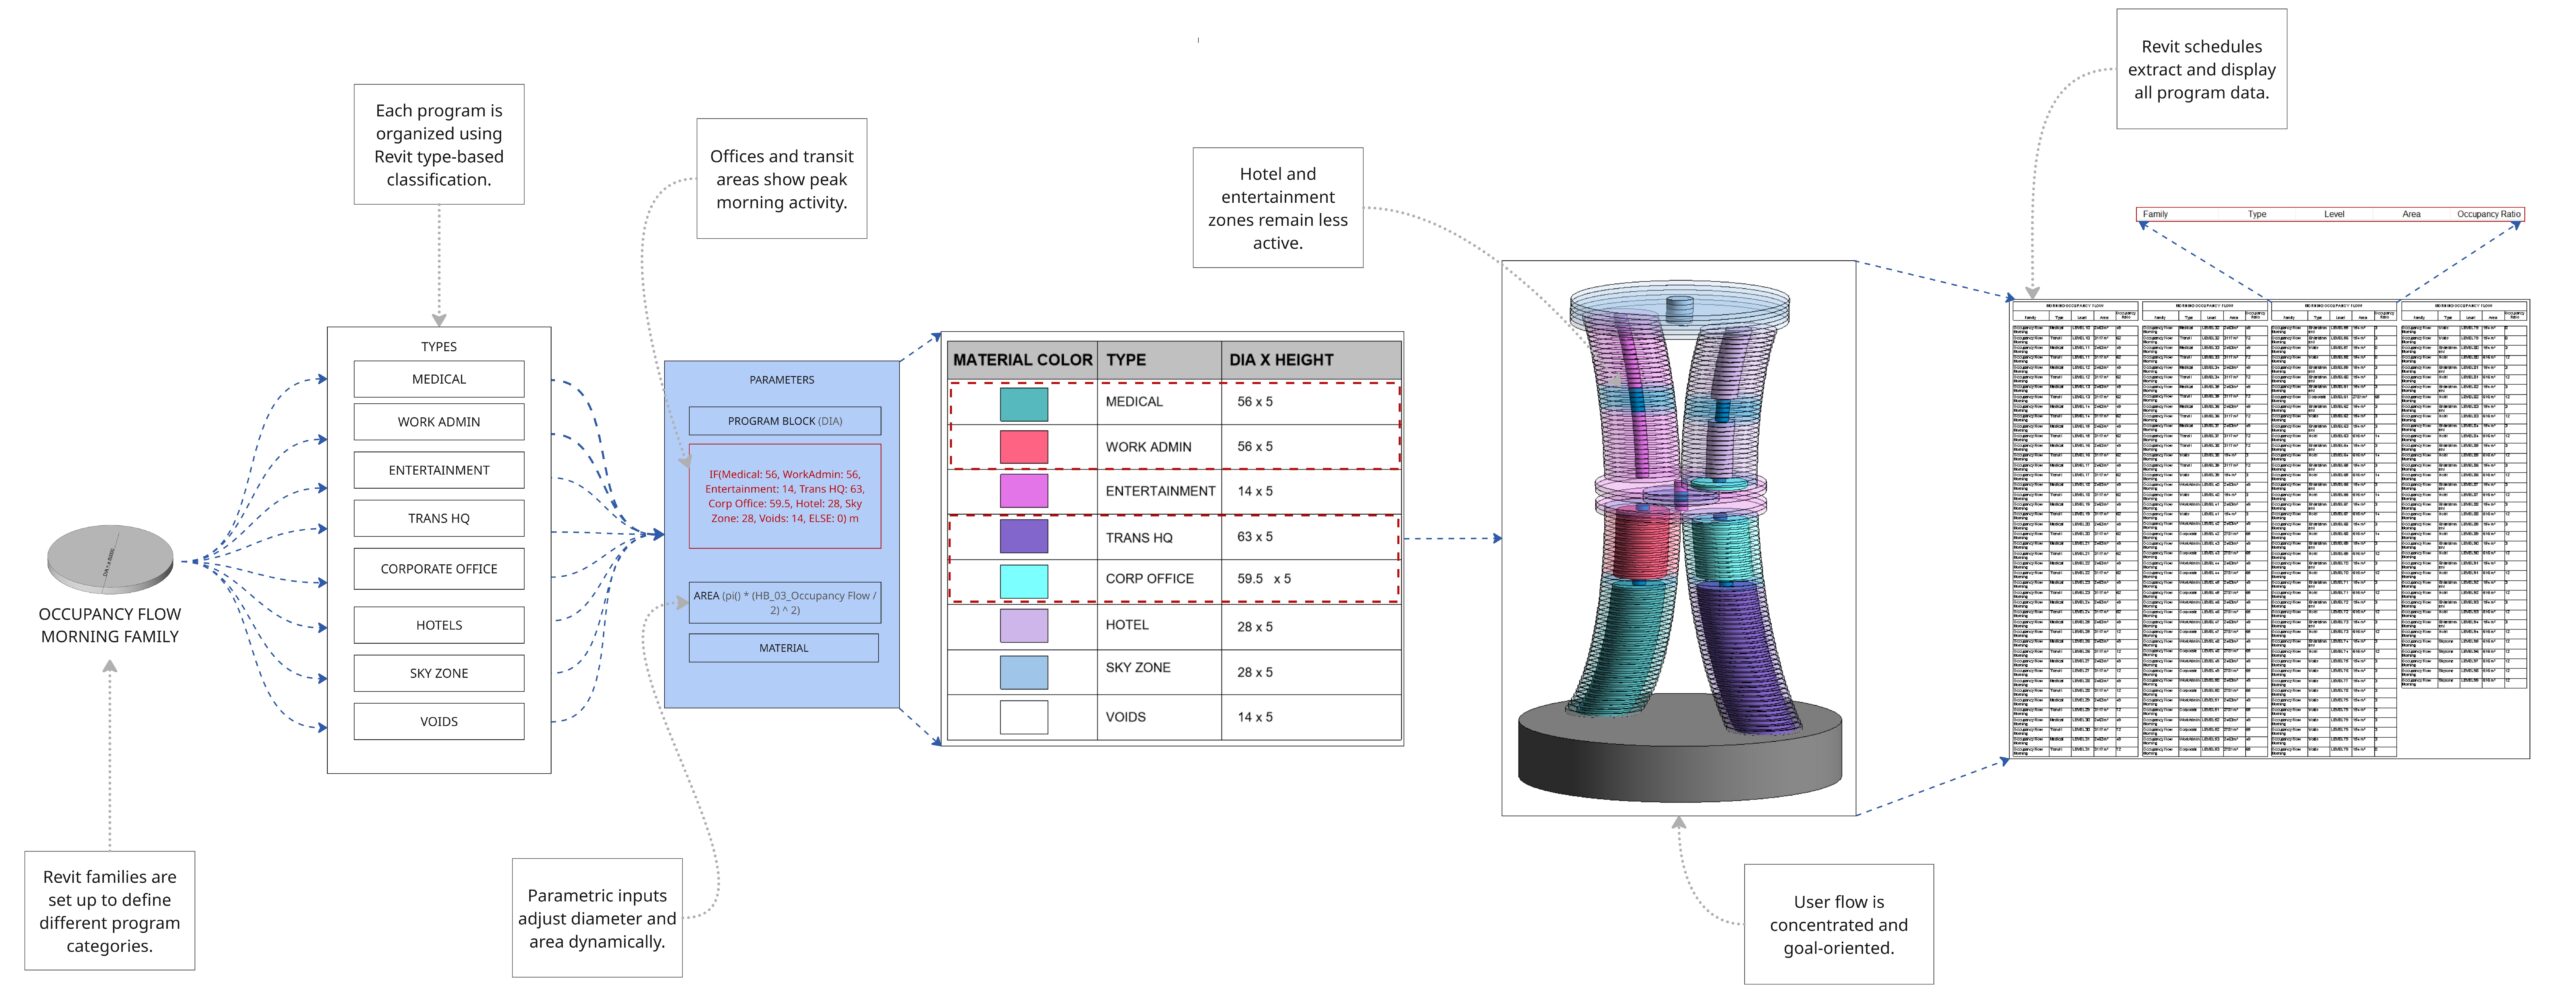
Morning: Structured Productivity
In the morning, the tower reflects a highly focused and goal-oriented environment.
- Work Admin, Transit HQ, and Corporate Office zones expand significantly
- Hotels and Entertainment remain compressed
User flow is direct and efficient, with parametric inputs in Revit automatically adjusting zone diameters and areas to reflect peak productivity.
Revit schedules play a key role here, extracting structured data such as:
- Family
- Type
- Level
- Area
- Occupancy Rate
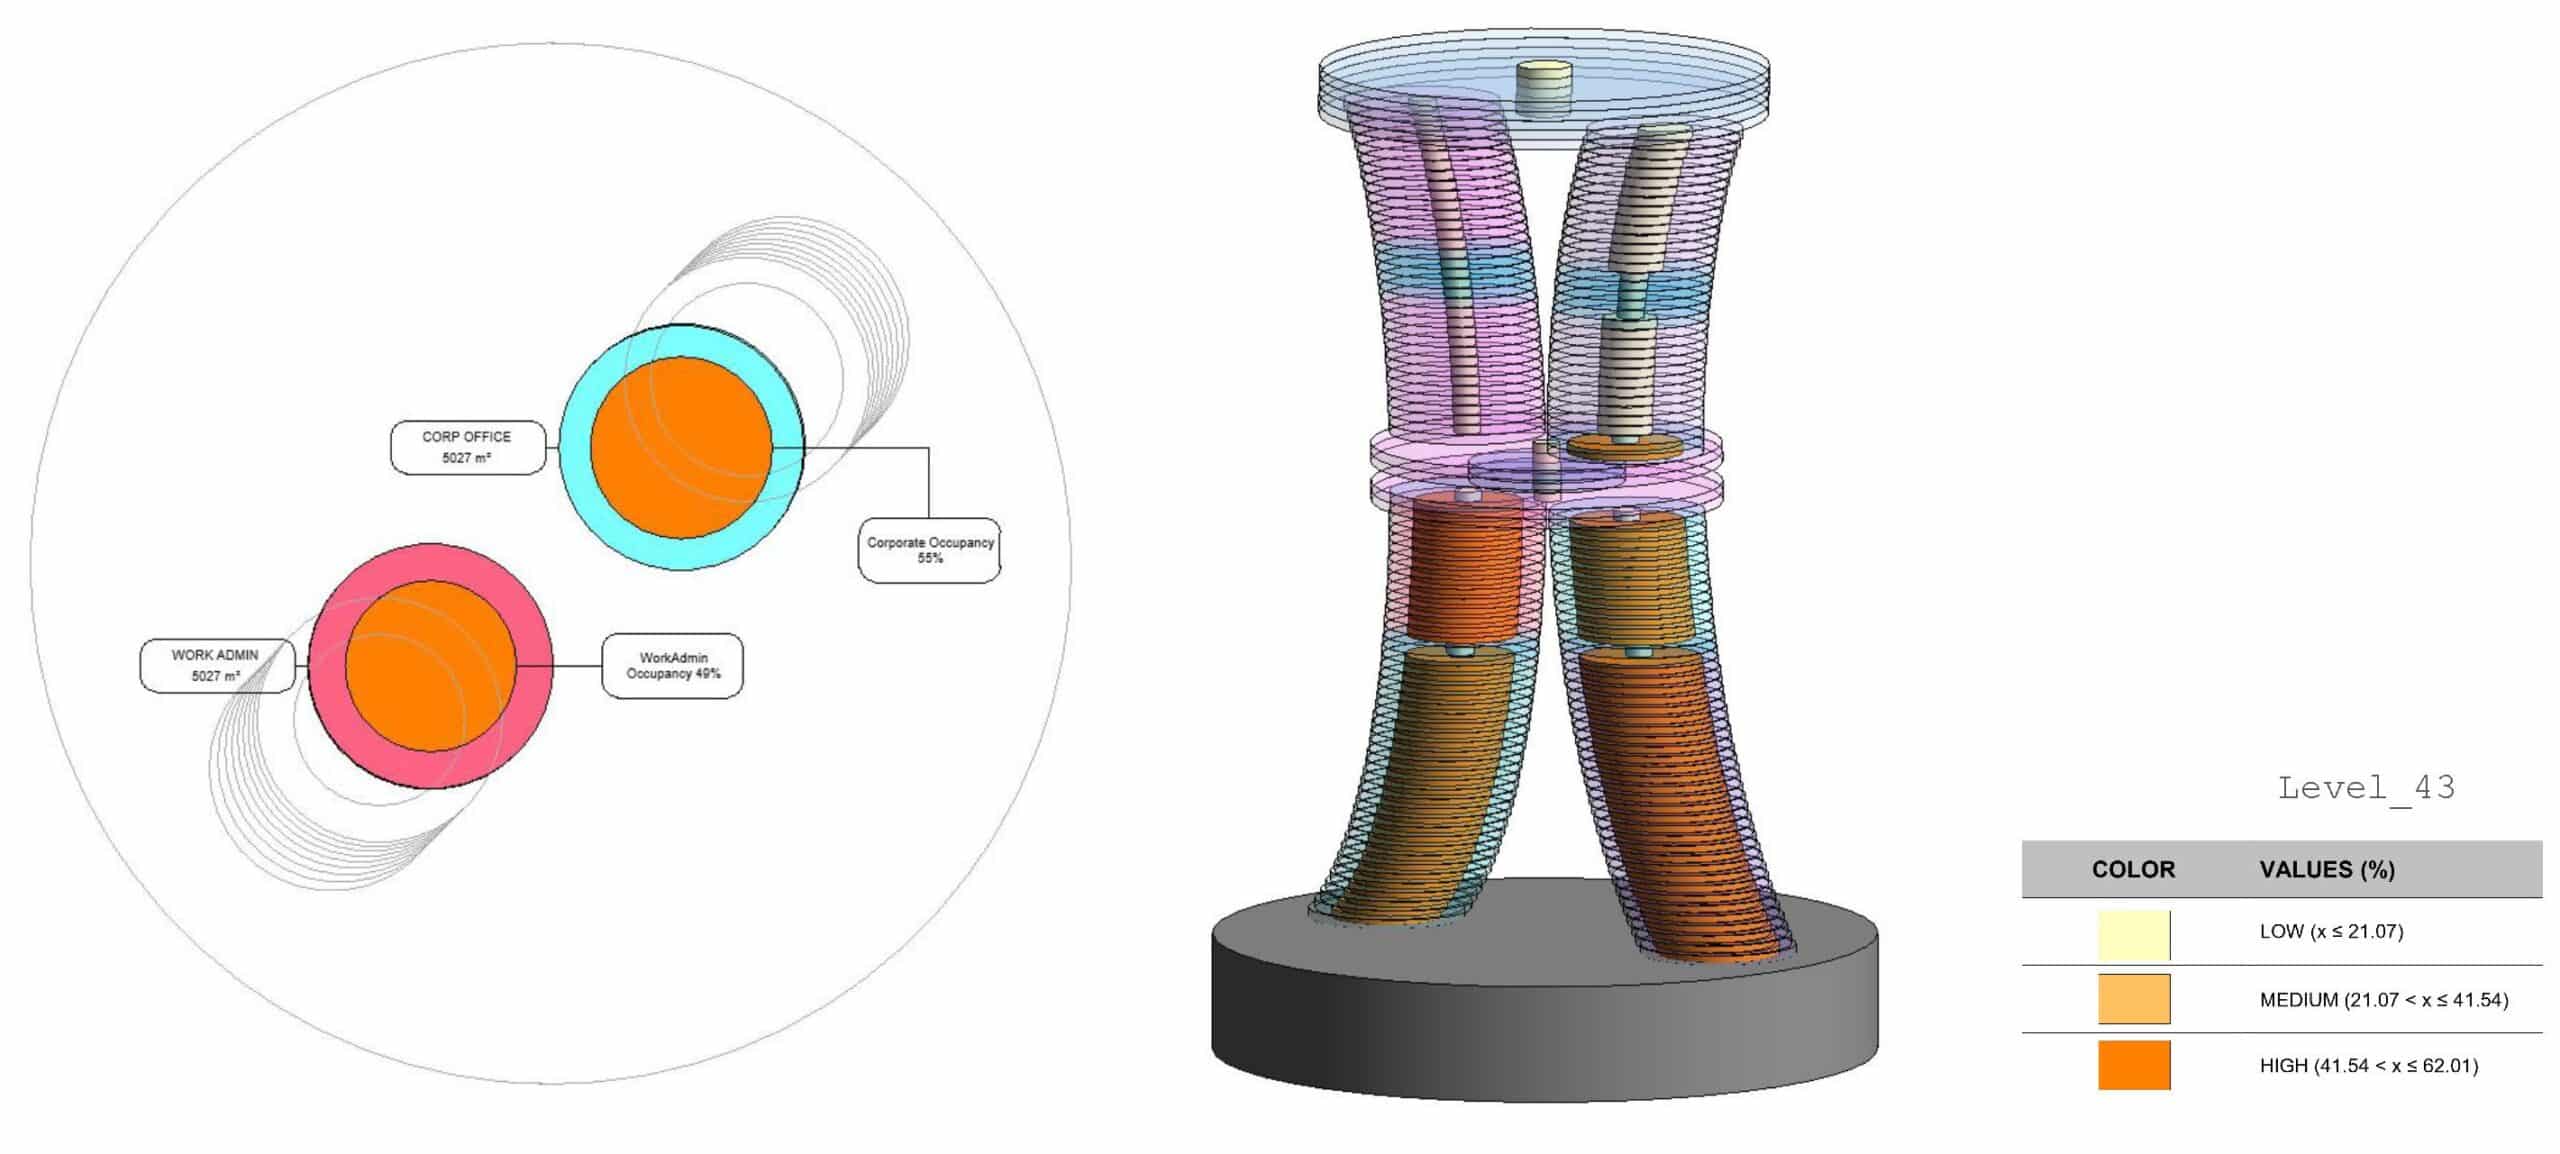
In addition, we aimed to further explore the relationship between floor area and actual occupancy usage. To make this comparison more explicit, we generated a series of plan views. As you can see, we included labels that display both percentage values and corresponding areas, allowing for a clearer and more quantitative reading of the data. For example, on Level 43 in the morning scenario, we can observe that Work Admin and Corporate Office zones have higher occupancy ratios.
This approach helps us understand not only the spatial distribution, but also the intensity of use across different program types.
All of this data is directly linked to Revit schedules, where parameters such as family, type, level, area, and occupancy ratio are automatically extracted and visualized, supported by filters created for each time scenario.
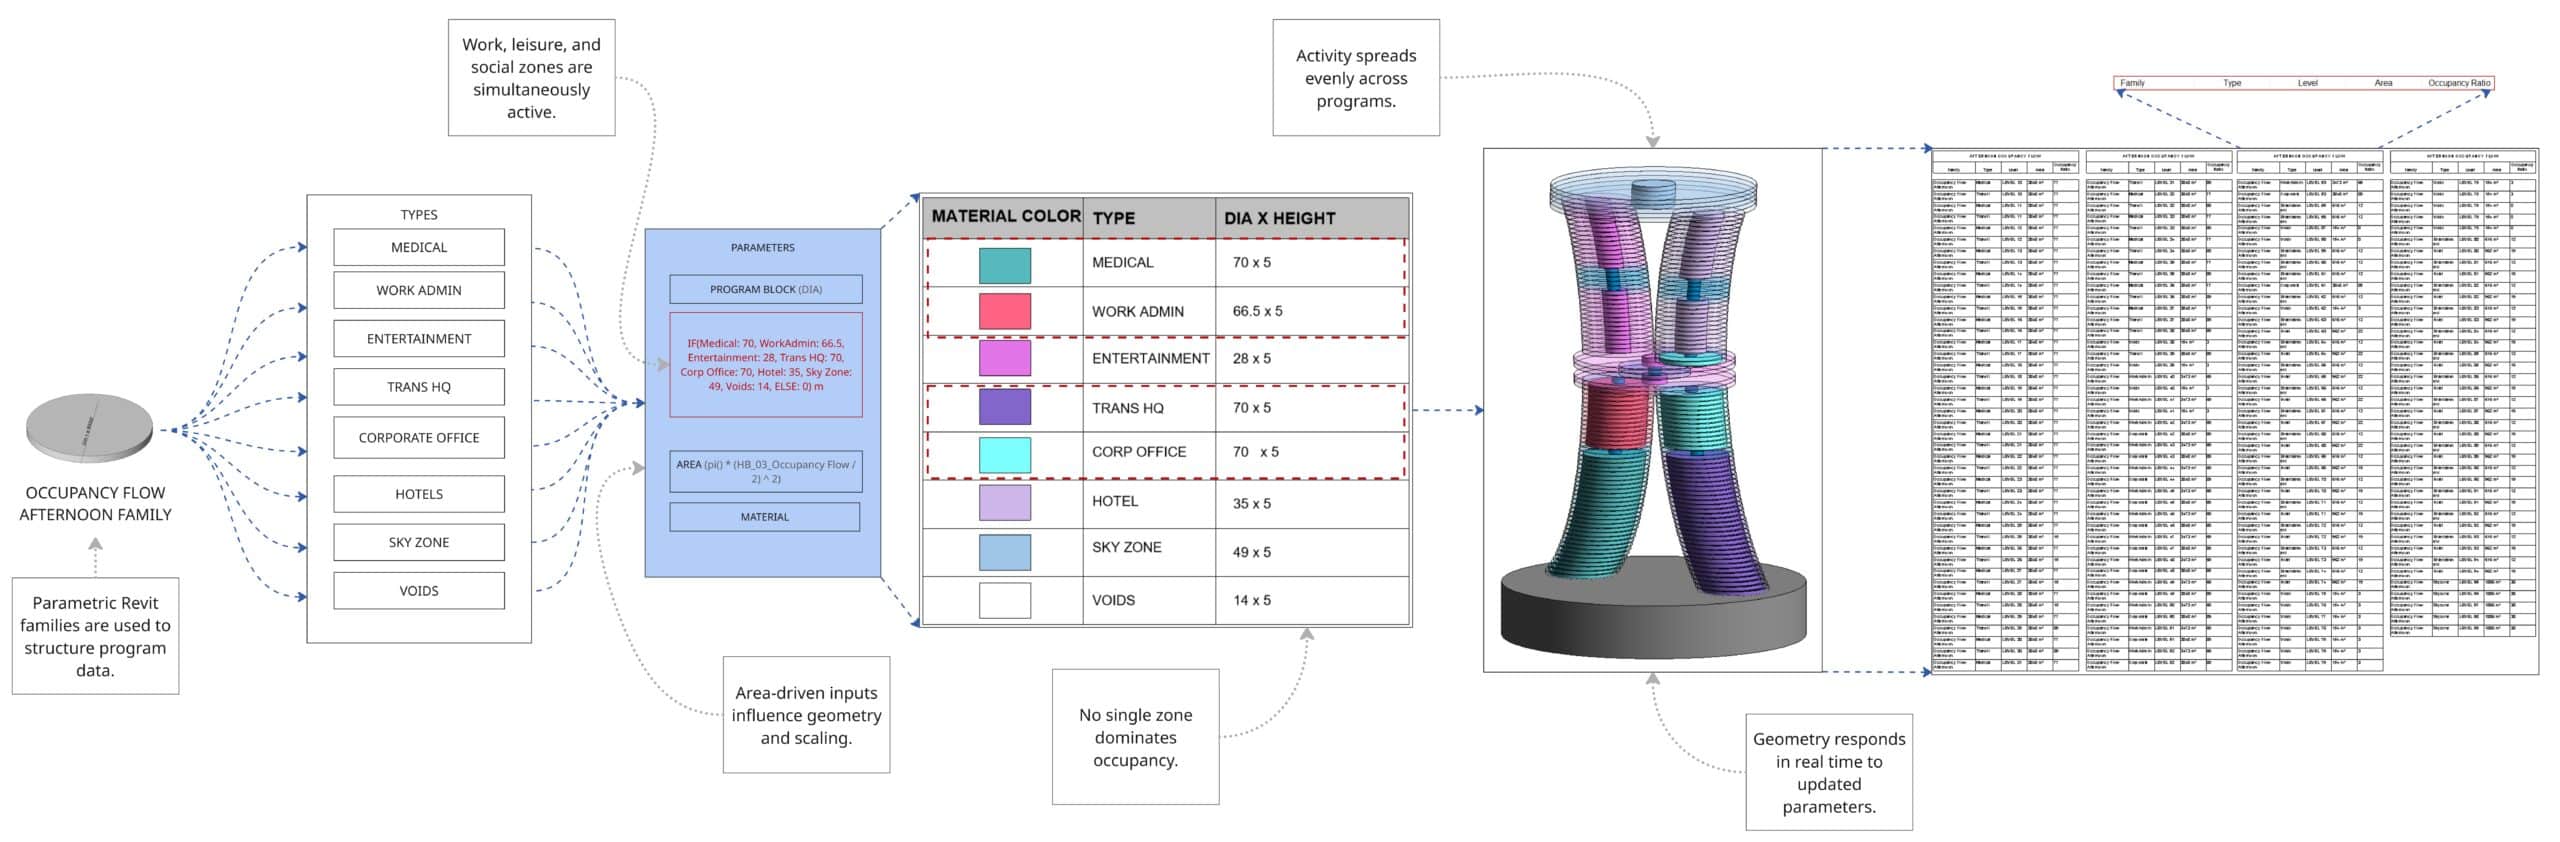
Afternoon: Balanced Activity
As the day progresses, the tower transitions into a more balanced spatial condition.
- Work, leisure, and social zones become equally active
- No single program dominates
Parametric inputs drive real-time geometric transformations, with zones such as Medical, Transit HQ, and Corporate Office reaching uniform dimensions (e.g., 70-unit diameters).
This phase represents a hybrid condition, where productivity and social interaction coexist.
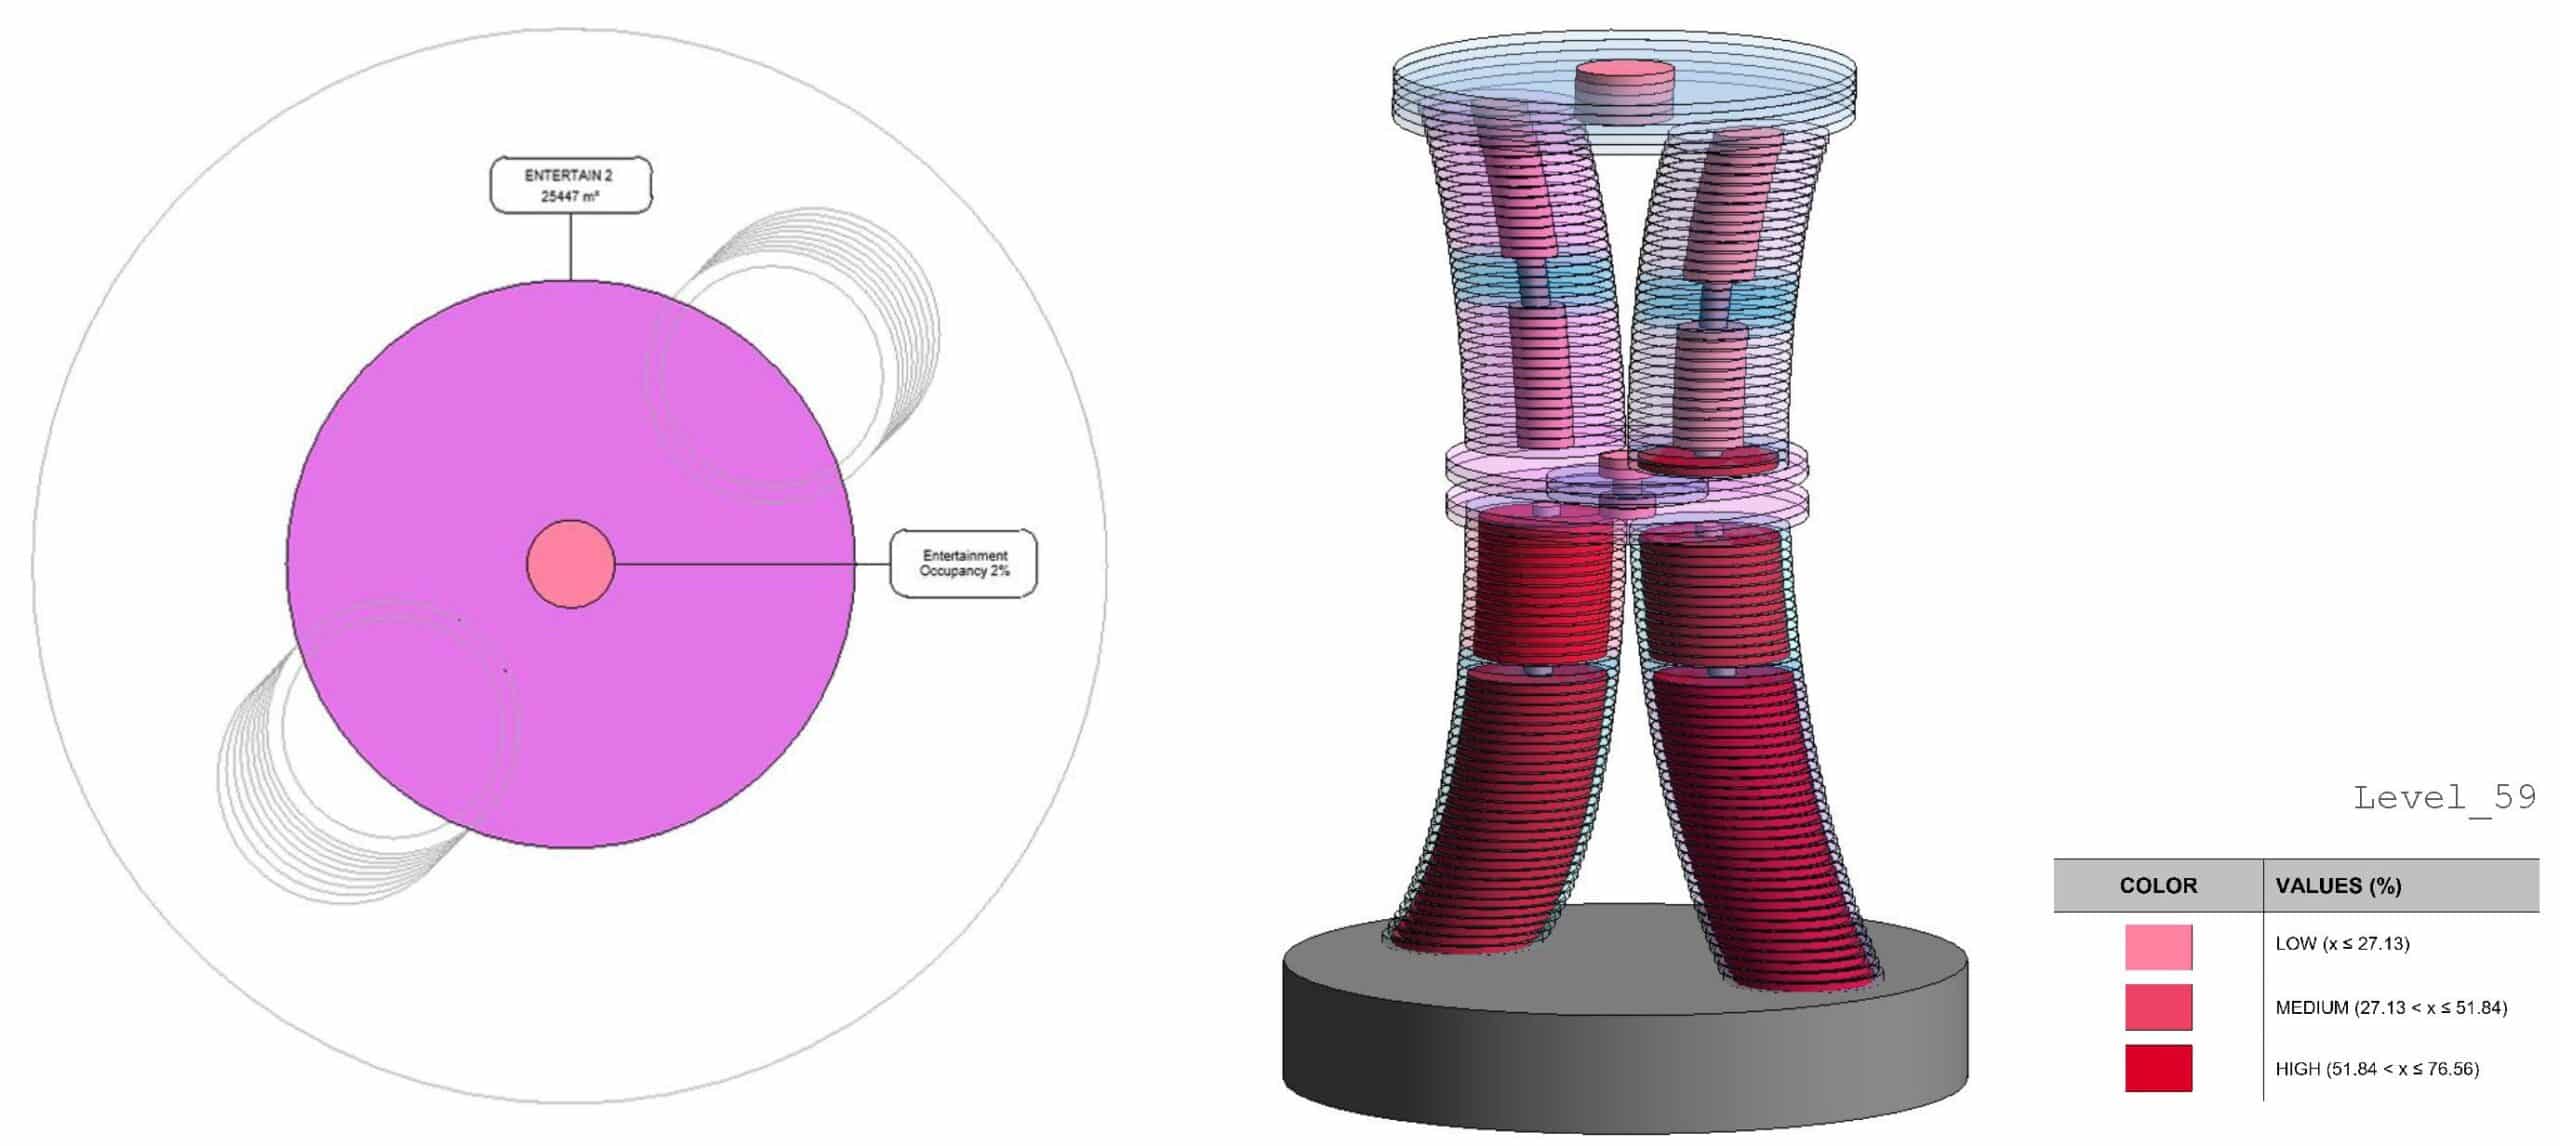
In the afternoon scenario, the occupancy of this zone is low. This is indicated by the color coding, which is defined as ‘low’ in the legend.
All occupancy ratios are categorized into three levels: low, medium, and high, and the filters are given accordingly.
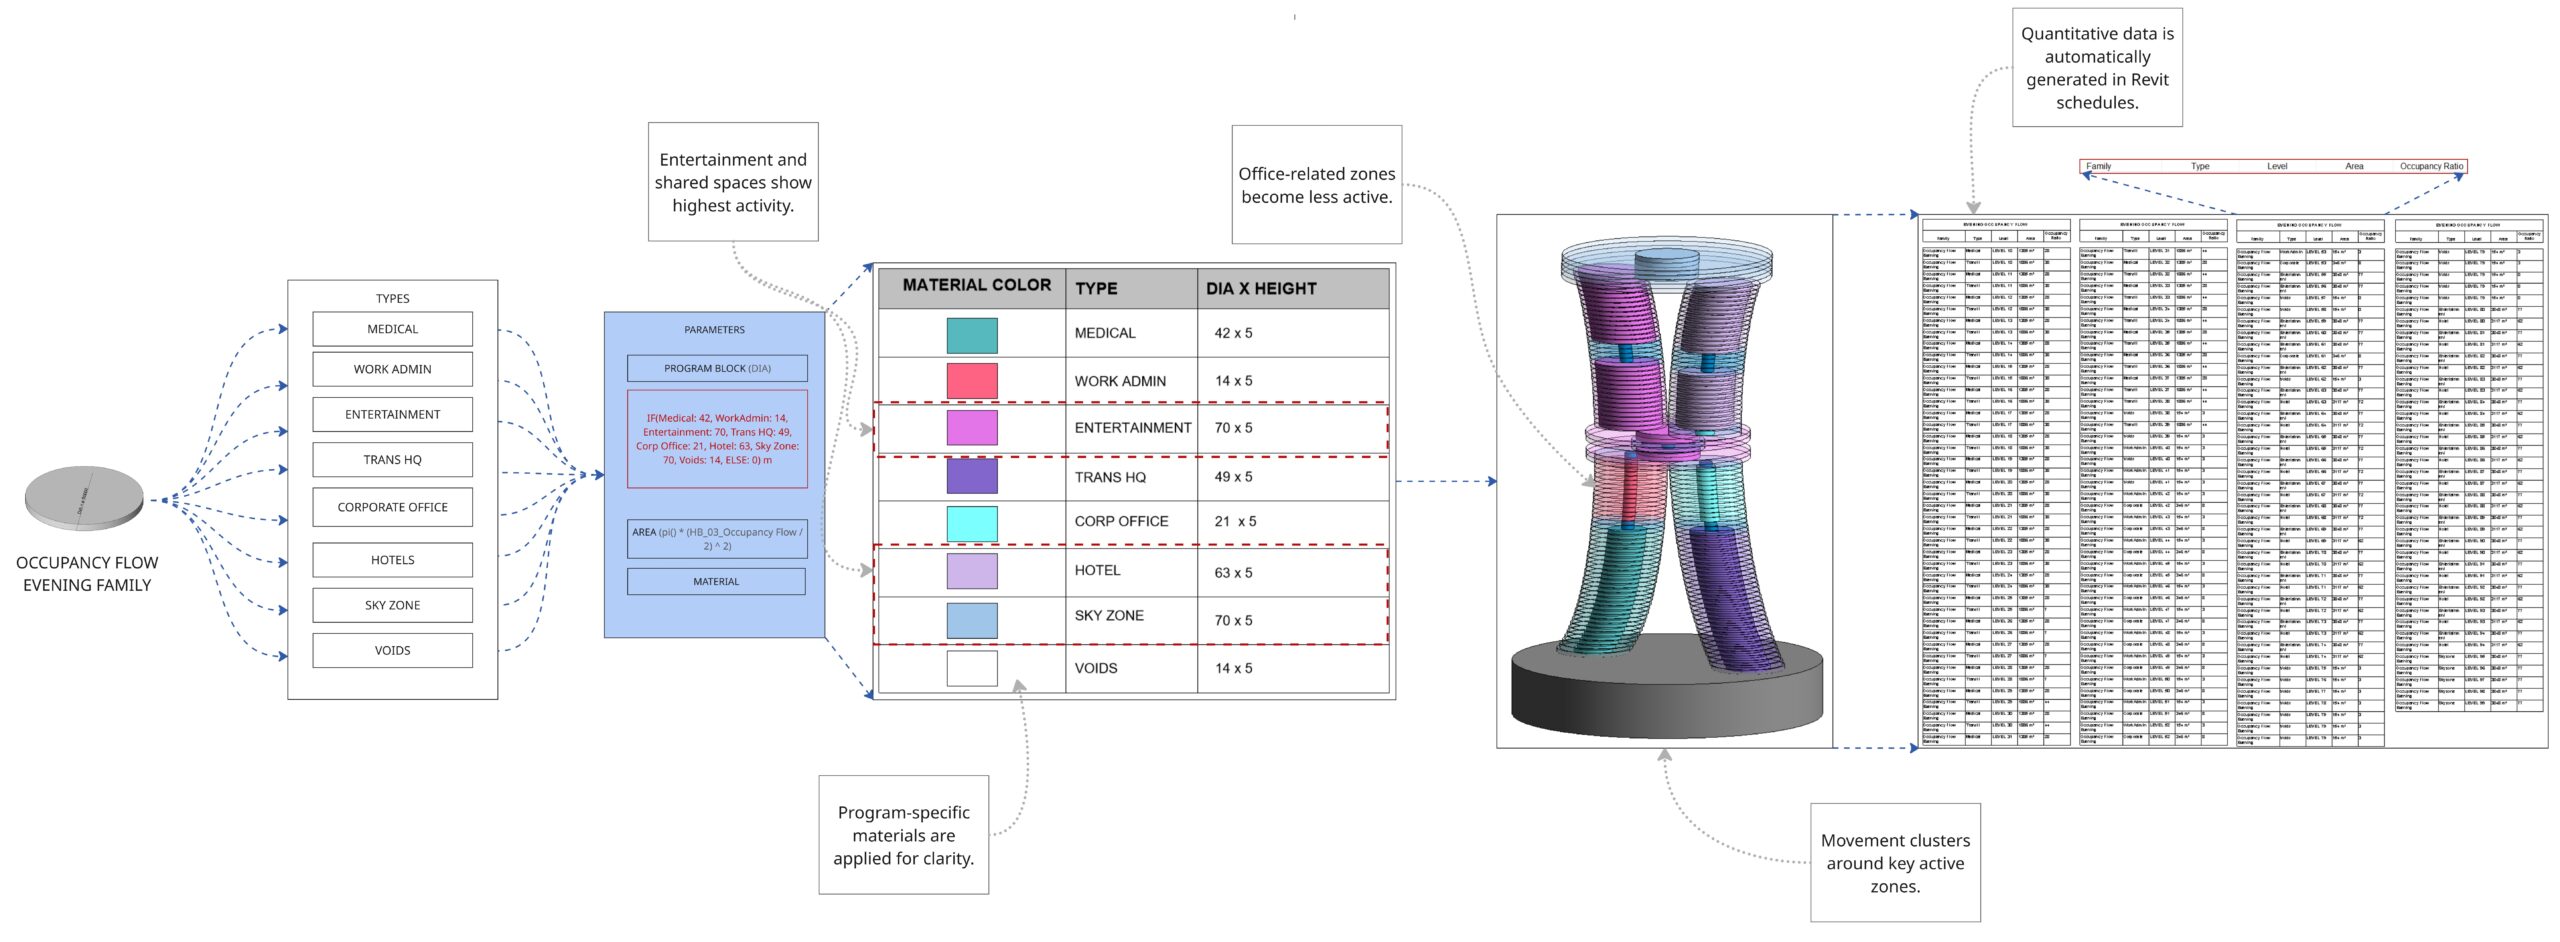
Evening: Social Expansion
In the evening, the spatial hierarchy shifts dramatically.
- Entertainment, Hotels, and Sky Zone expand to their largest extents
- Work Admin and Corporate Office zones contract
User movement clusters around social and leisure hubs, creating a vibrant and dynamic environment. Revit schedules automatically document this redistribution, capturing the shift in spatial priorities.
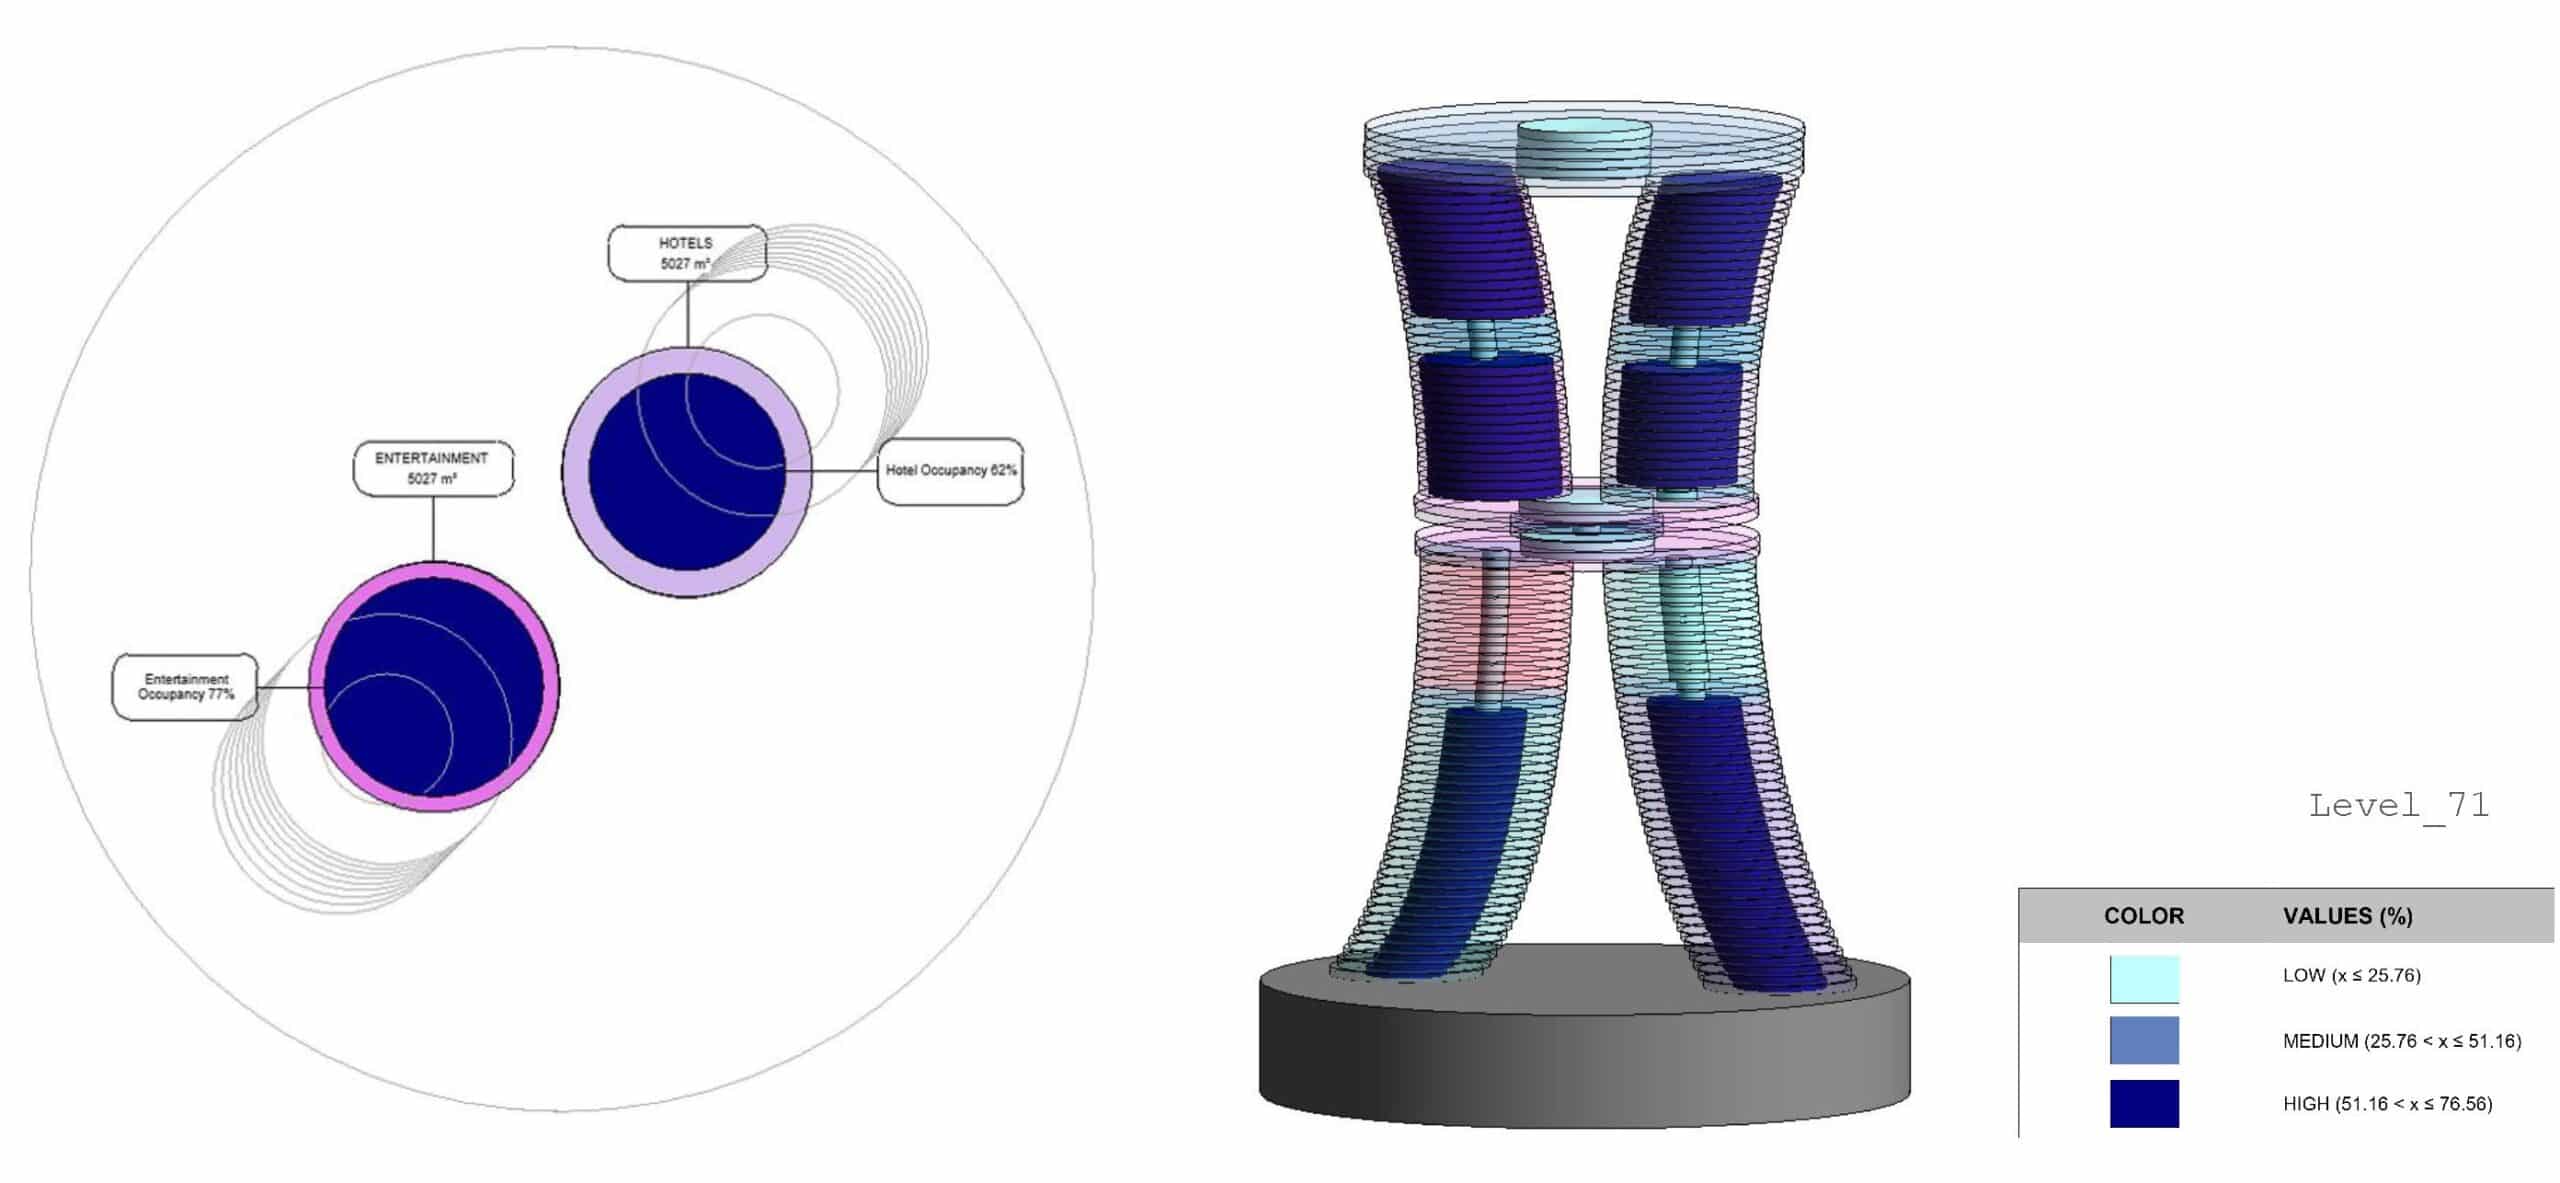
Here, we can see Level 71, where the Hotel and Entertainment program blocks are located. In this scenario, both zones show high occupancy ratios, as indicated by the color coding defined in the legend.
Night: Minimal Occupancy
At night, the tower reaches its most reduced form.
Most zones shrink to a minimal diameter (approximately 0.7m),
- Only Medical and Hotel programs retain meaningful activity
Conditional parametric rules respond to time-based inputs, streamlining the building into its lowest-energy, lowest-occupancy configuration. This reflects a significant drop in user density while maintaining essential functions.
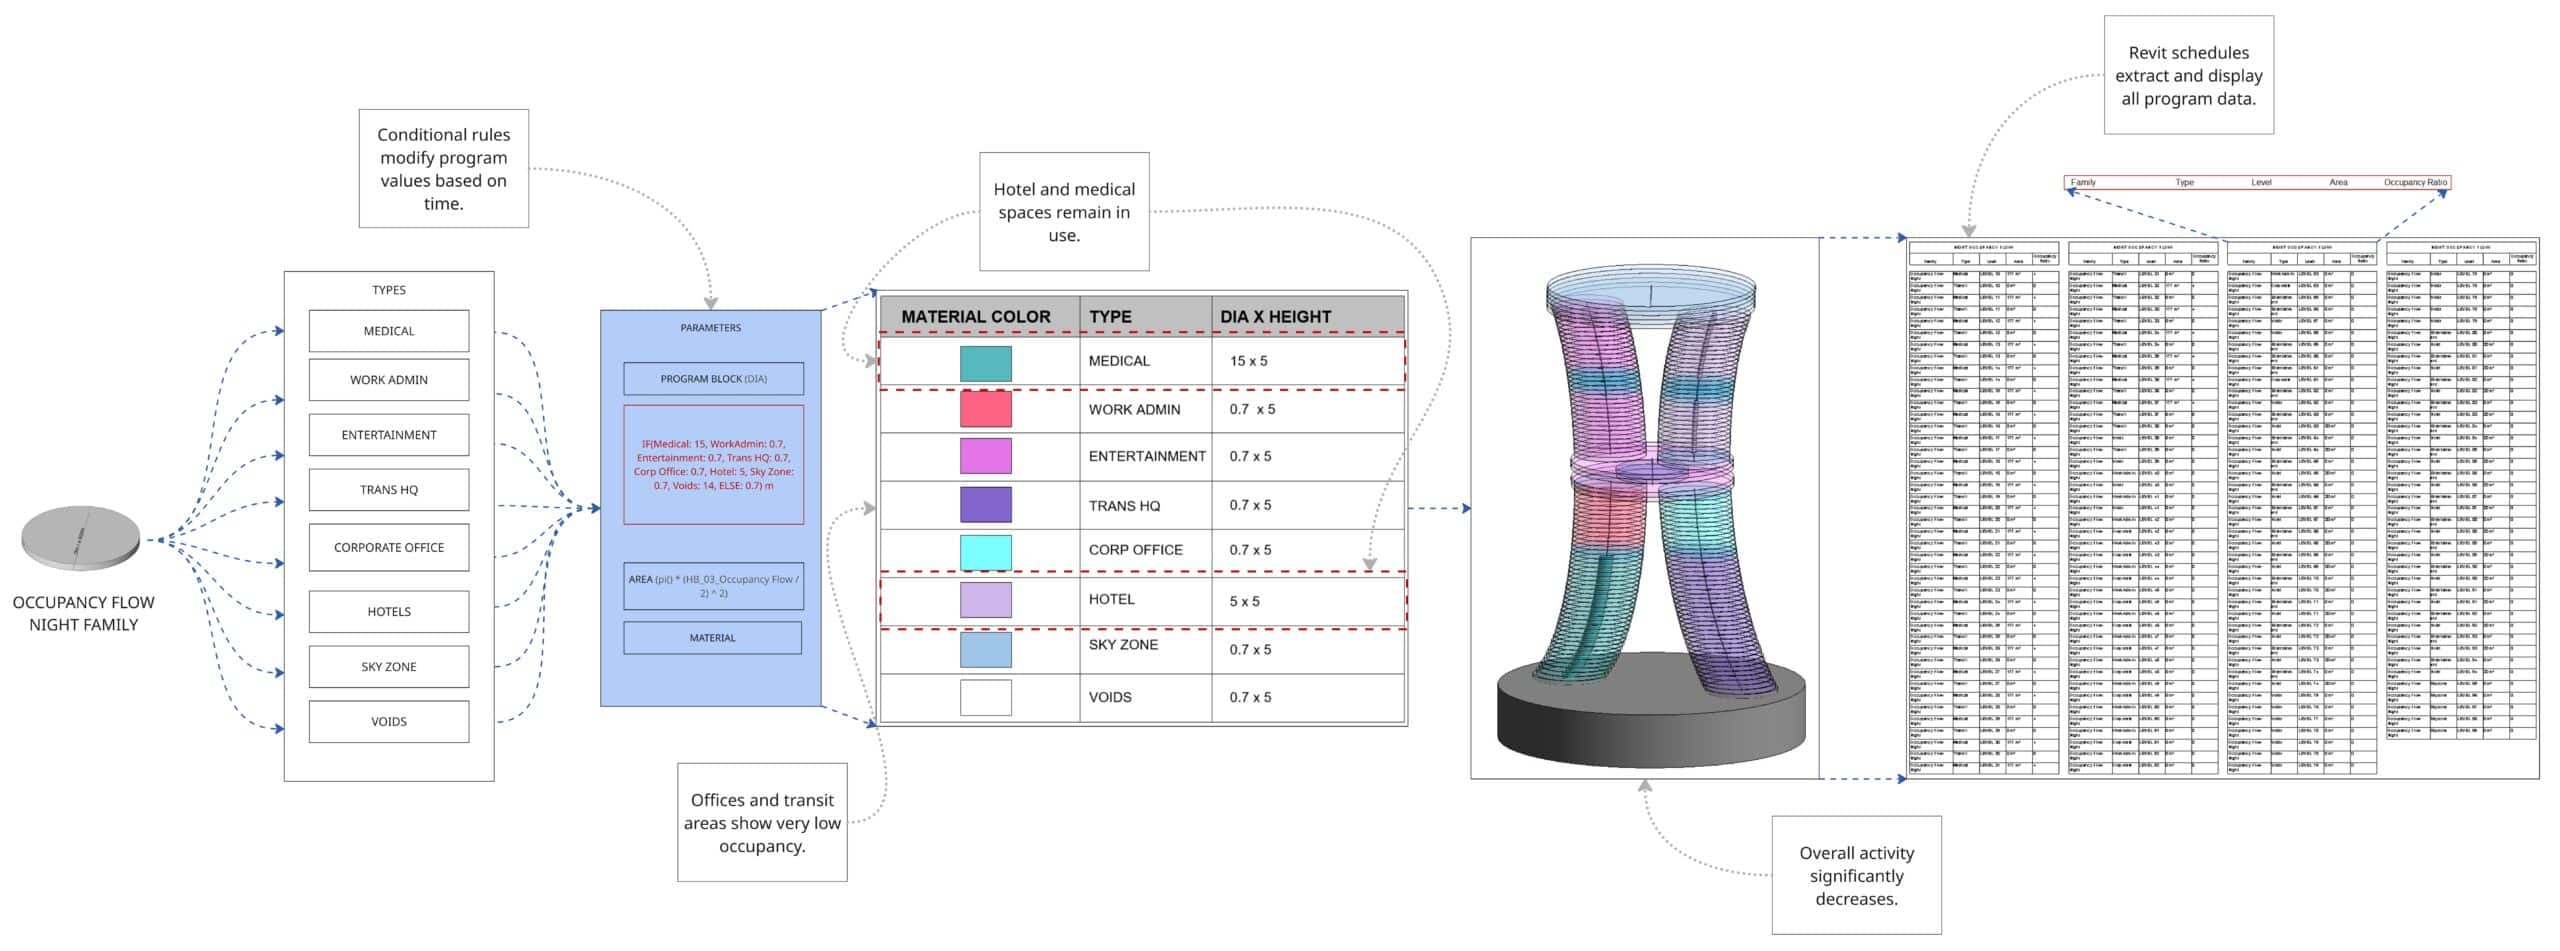
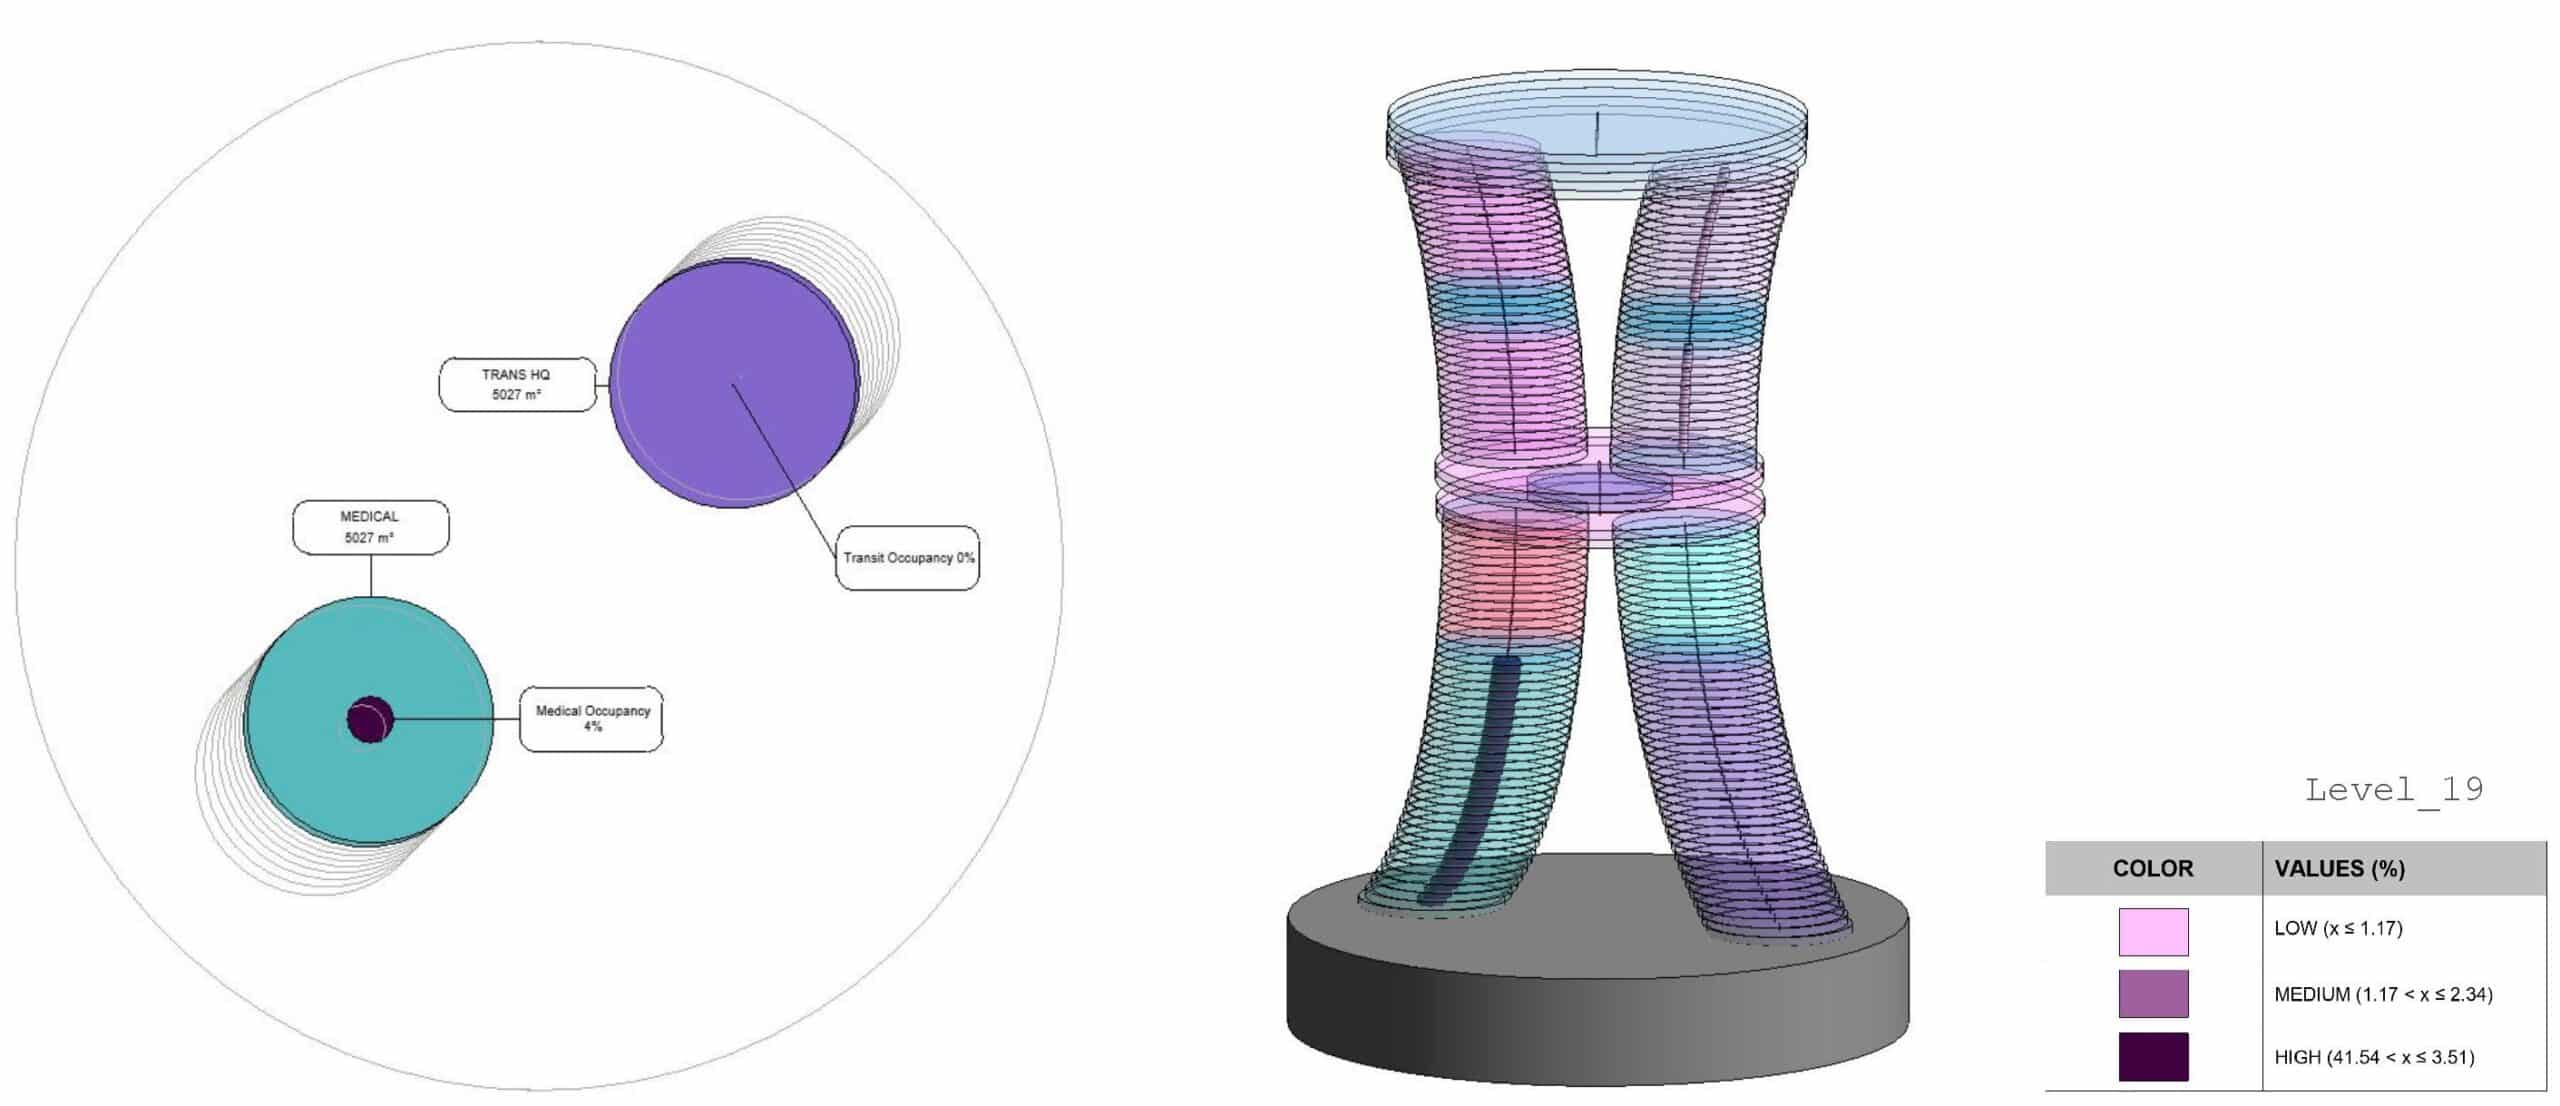
In the night scenario, where the occupancy ratio formula is applied based on our KPIs, we can observe the expected usage pattern. In this case, there is no occupancy in the Transit Headquarters office zone, which reflects the typical inactivity of office-related functions during night time.
The plan view and labels show the occupancy distribution, indicating very low or no usage in these areas, as defined by the legend.
Conclusion
While the physical structure must accommodate all programs at maximum capacity, this parametric framework translates temporal occupancy data into a spatial analysis tool. The dynamic geometry becomes an analytical instrument rather than a construction blueprint, informing building operations, wayfinding systems, space booking applications, and real-time availability management.
