
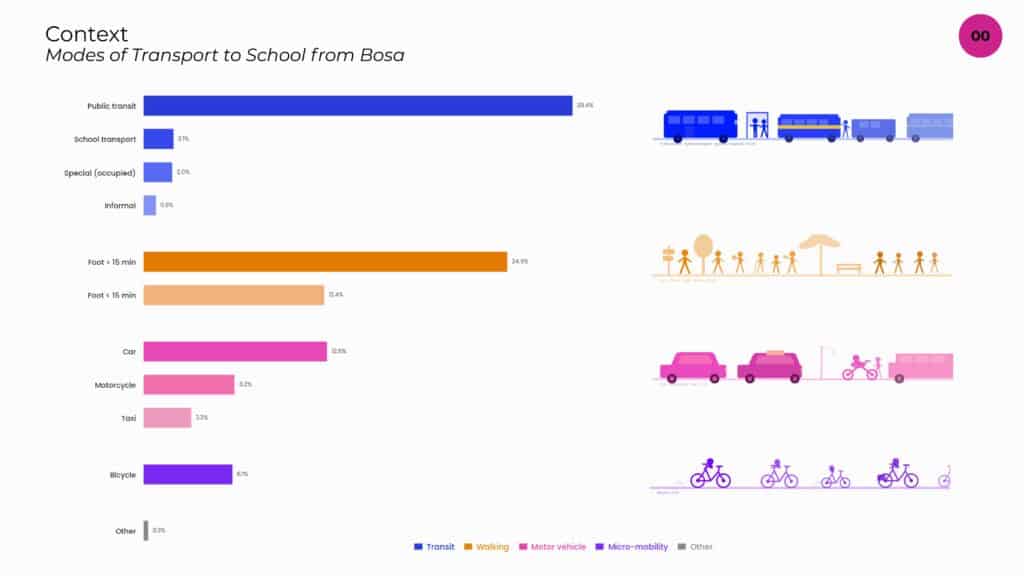
Children’s journey to school, in Bosa Apogeo, Colombia
INTRO
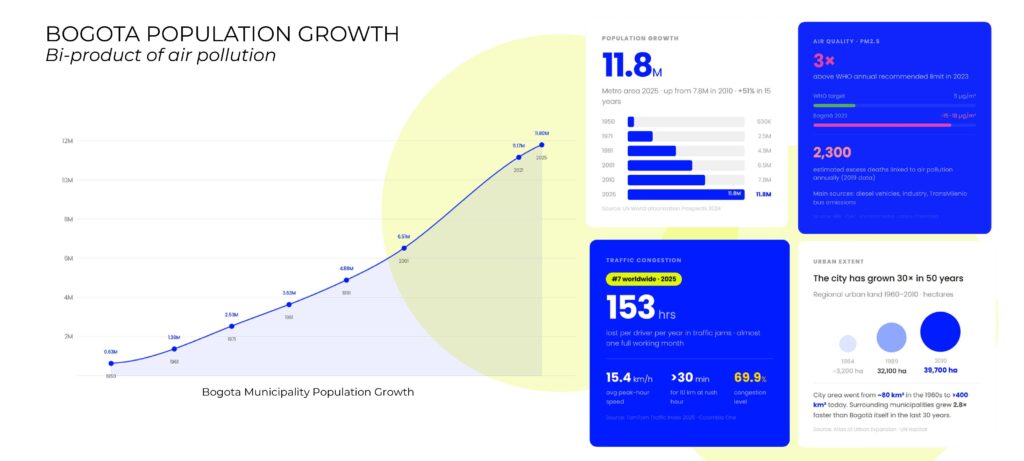
Bogotá’s growth over the last two decades has been dramatic. The metropolitan area now holds close to 11.8 million inhabitants — a 51% increase in just 15 years. That growth has not been evenly distributed across the city.
The city currently ranks 7th in the world for time lost in traffic, with drivers spending an average of 153 hours per year in congestion. That is nearly one full working month. Traffic is not just an inconvenience — it is one of the primary drivers of air pollution at the city scale. Bogotá’s PM2.5 concentration sits at roughly 6 times the WHO recommended limit, and the health consequences are significant: approximately 2,300 premature deaths are linked to air pollution each year.
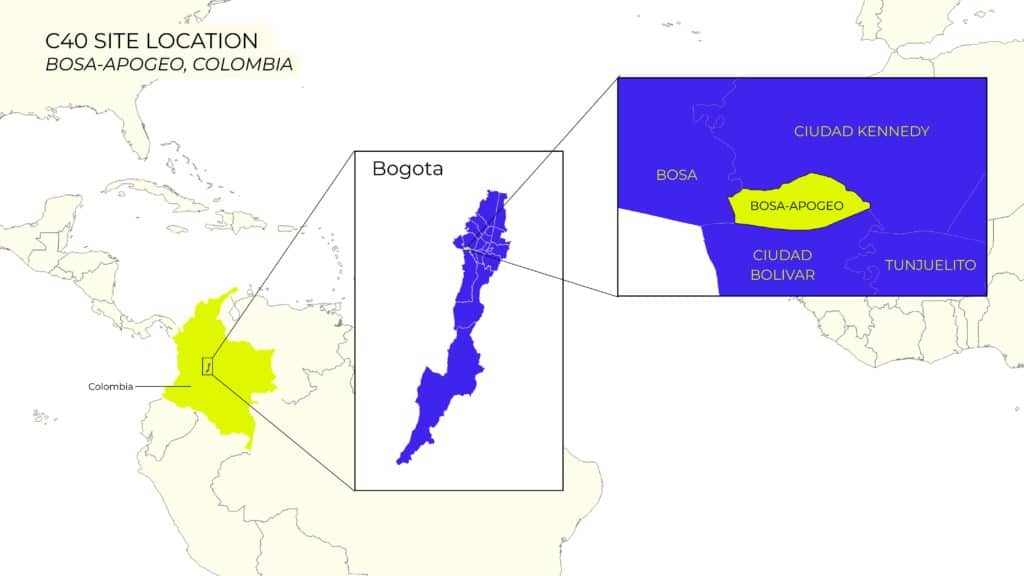
URBAN ISSUE: In Bosa Apogeo, childrens daily journeys to schools unfold along fragmented pedestrian and cycling networks where proximity does not guarantee protected mobility.
RESEARCH QUESTION: How can children’s school-related and non-motorized trips in Bosa-Apogeo be improved by identifying critical gaps in the street network and using this information to develop targeted spatial policies?
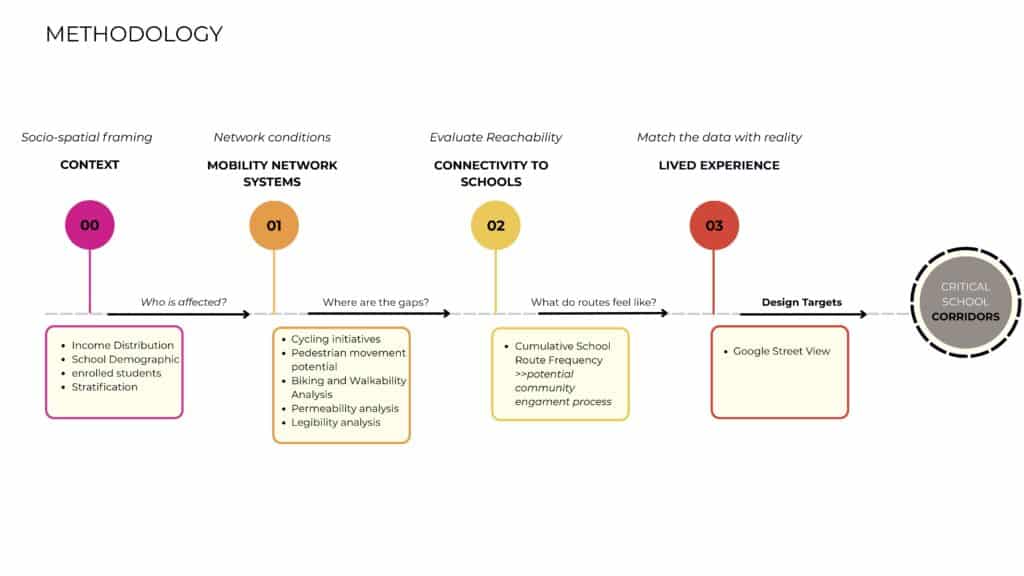
OBJECTIVE: Identify structural fragmentation in everyday mobility networks in Bosa Apogeo, with a focus on school-related and non-motorized trips (walking and cycling) – and develop a framework for improving non-motorized mobility networks that could be applied to other peripheral districts in Bogotá.
The Space Syntax analysis measures how reachable each street is from all other streets within an 800m radius — the approximate boundary within which children aged 10–12 move independently. Streets with high values are not necessarily busy by observation; they are structurally prominent, meaning the network geometry makes them the natural choice for anyone moving through the area — on foot, by bike, or by car — following the path of least resistance. This is not a model of where children actually walk today, but an identification of where movement inevitably concentrates regardless of individual choices.
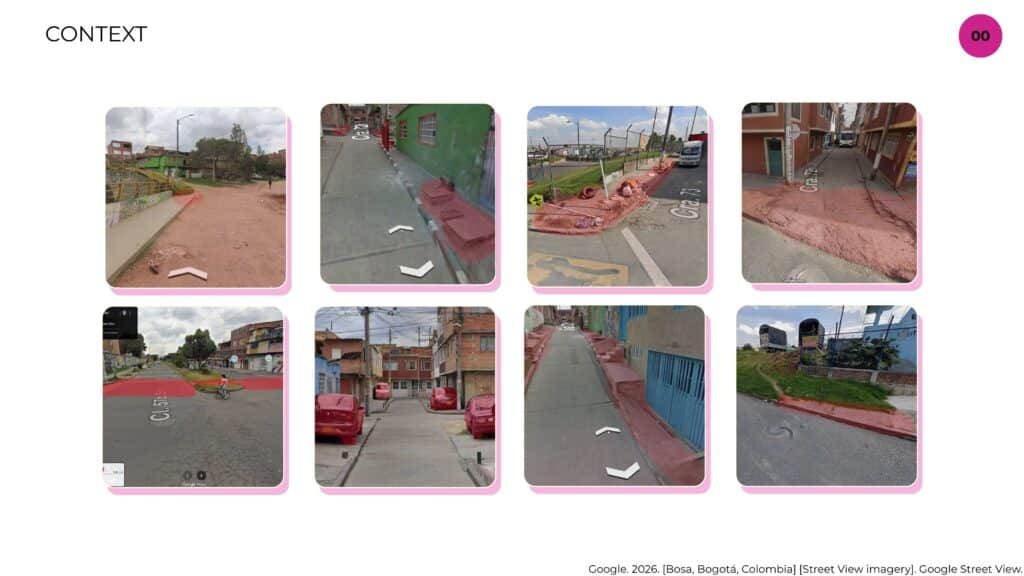
We then cross-referenced these structurally prominent streets with the presence of sidewalks and cycling infrastructure — not only through official GIS data, but through Google Street View, bringing a human perspective to what the map records as existing infrastructure.
The routing analysis calculates the shortest path from every residential origin to every school. Streets in red appear in the highest number of overlapping paths — making them the corridors with the greatest potential for school trip concentration.
