Problem & Context
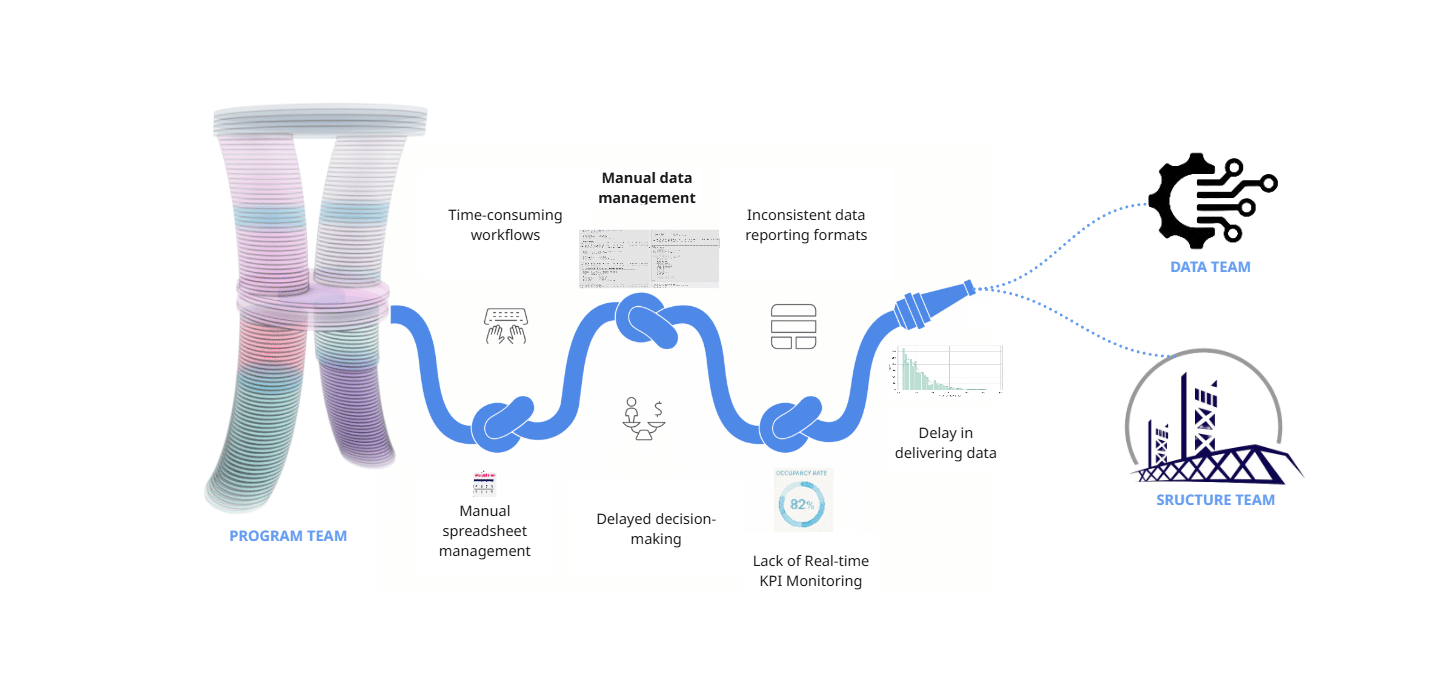
As Program team we faced a lot of challenges regarding data collection, data management and KPI monitoring which resulted in delayed and not efficient outputs we could present to our Data and Structure & Facade teams of our Hyperbuilding 02 Studio project. The manual data management proved to be time consuming and not effective in fast-paced projects like these.
Target User
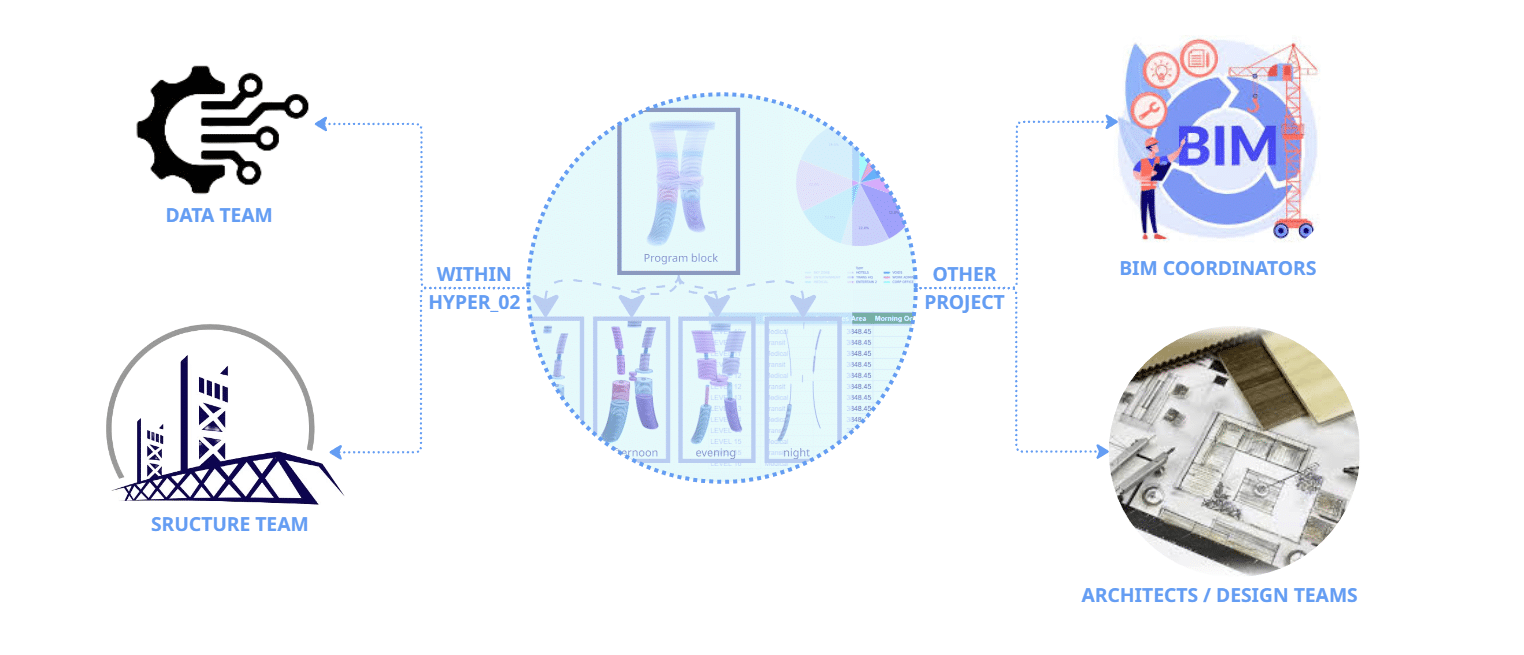
Our target user is primarily the rest of our Hyperbuilding 02 teams, but the workflows used here could be applied by BIM Coordinators managing multi-disciplinary models, and Architects and Design teams who need to validate their spatial programs against performance targets with real-time KPIs.
Proposed Solution
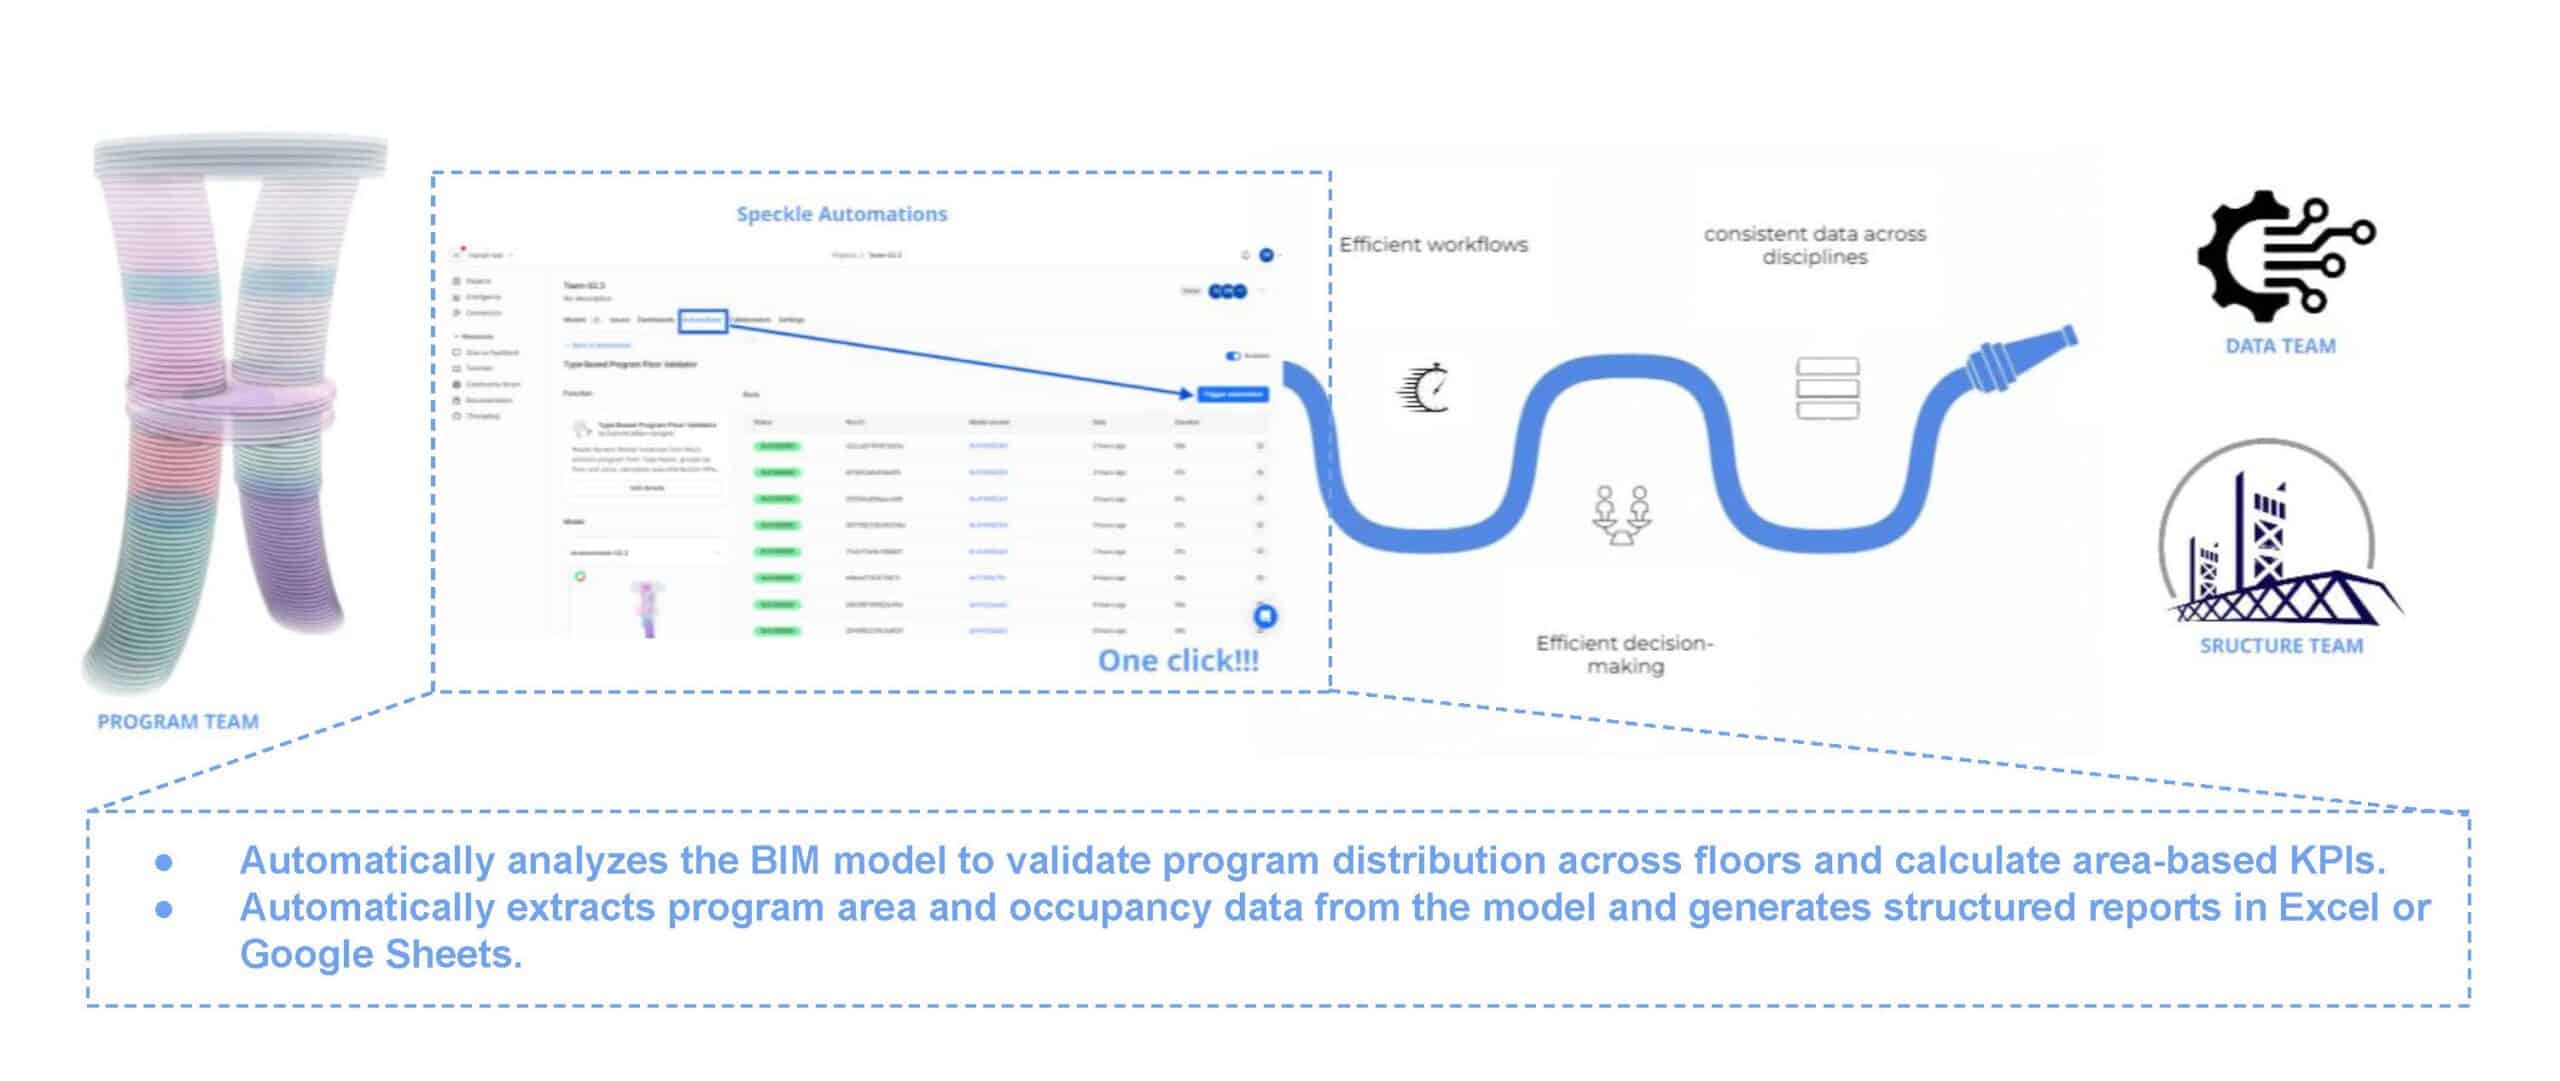
As Program team, our goal was to provide reliable program data. so we developed a set of automated functions using Speckle. These functions analyse the model, extract program areas and occupancy data and automatically calculate area-based KPIs that can be shared with other teams.
How it works | front end
System Overview
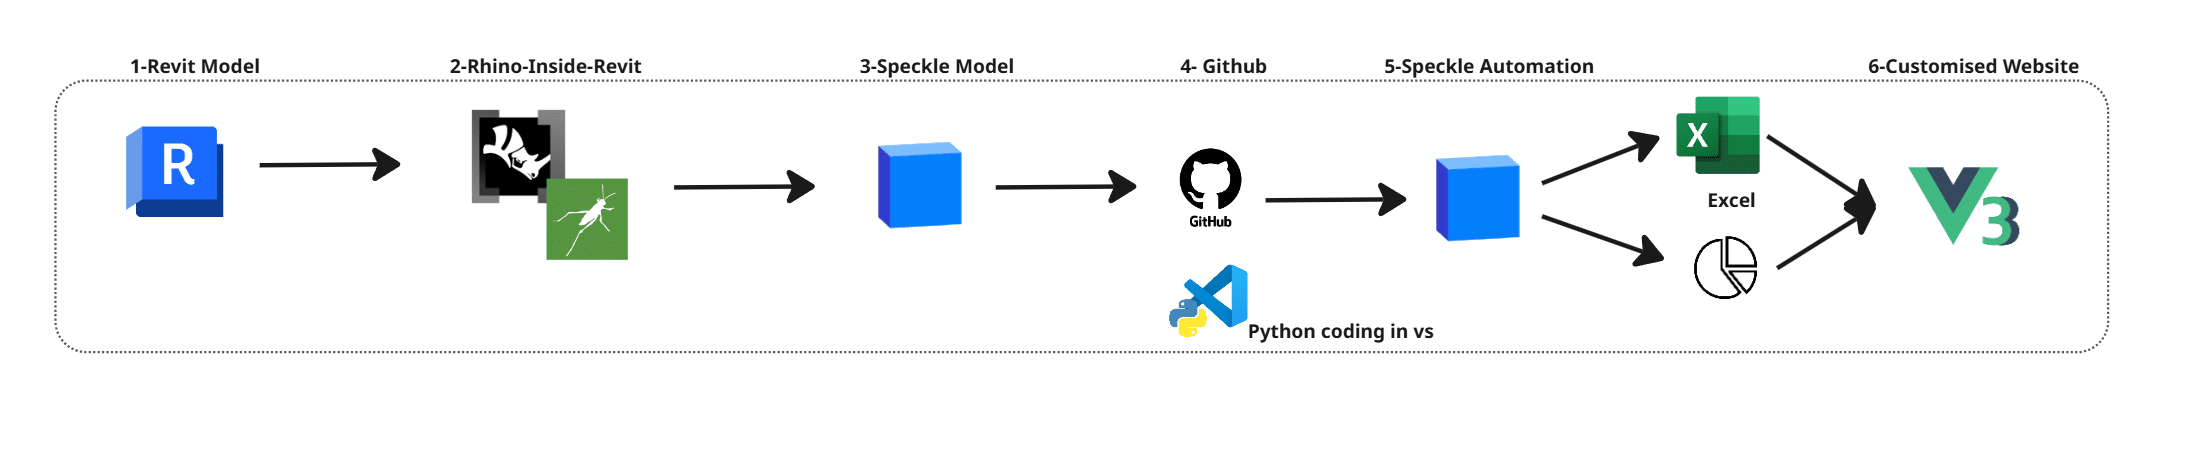
The workflow follows 6 main steps. We start with the Revit model, where the project is stored. Since our studio project had already been transferred to Revit, we used the BIM model as a shared data source. Using Rhino.Inside.Revit, we assigned program parameters. The model was then sent to Speckle, where a Python script processes the data. This script is run through Speckle Automate, and the results are visualised in a custom-made dashboard interface built with Vue.
Data Preparation
In Revit model, we structure the data using family blocks and custom parameters. Each element is assigned a program type with 8 different categories. We also define occupancy ratios for 4 different times of the day: morning, afternoon, evening and night. This allows the model to represent not only one geometry, but how space is used in time.
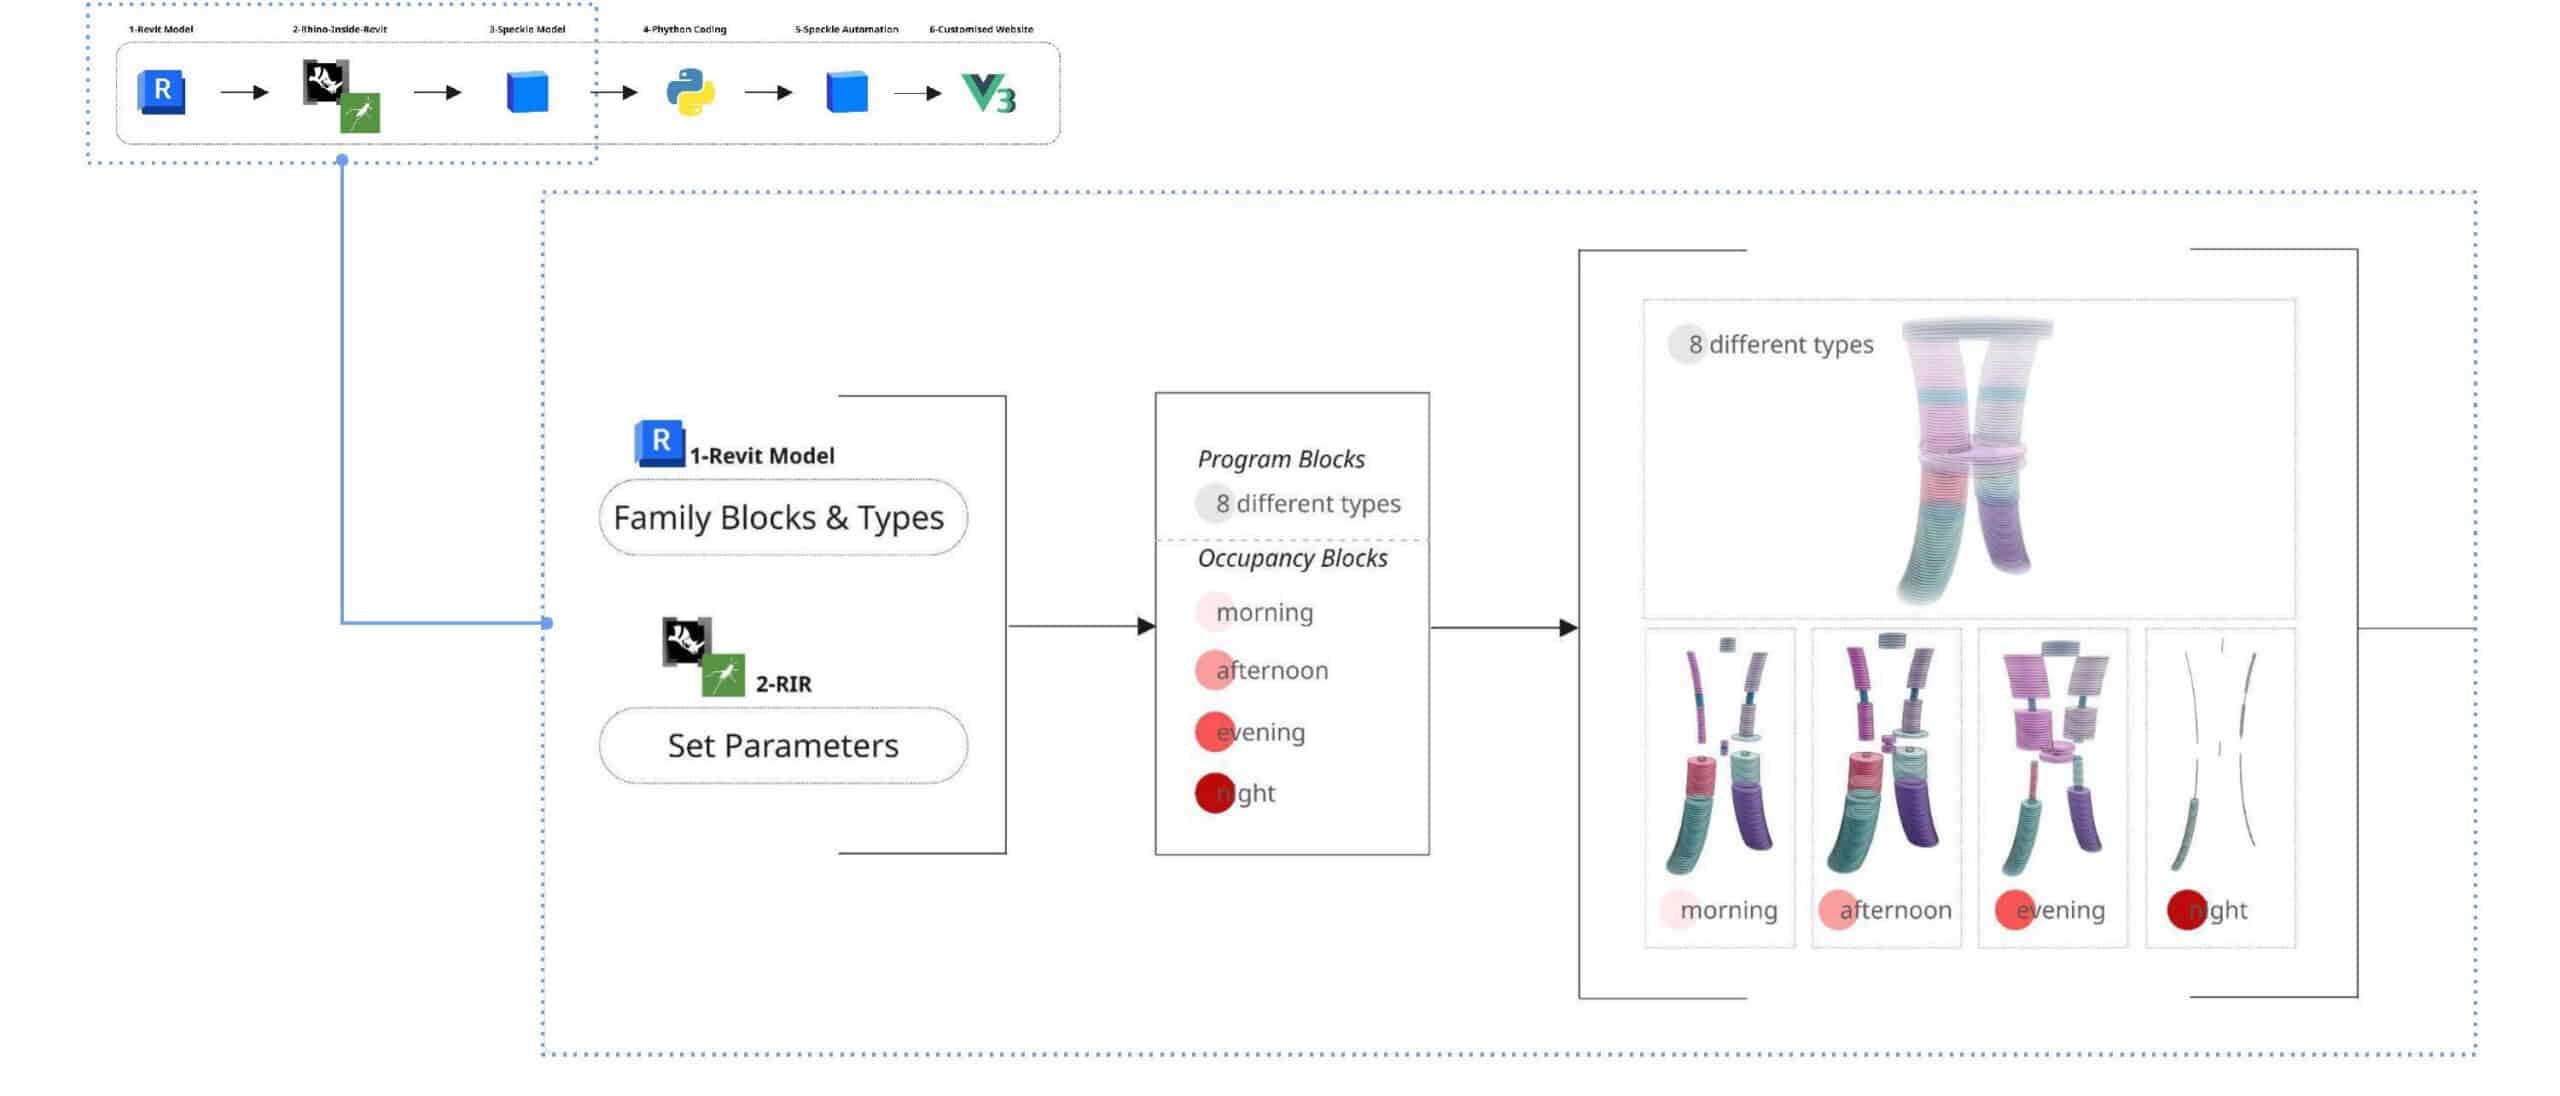
Data Processing
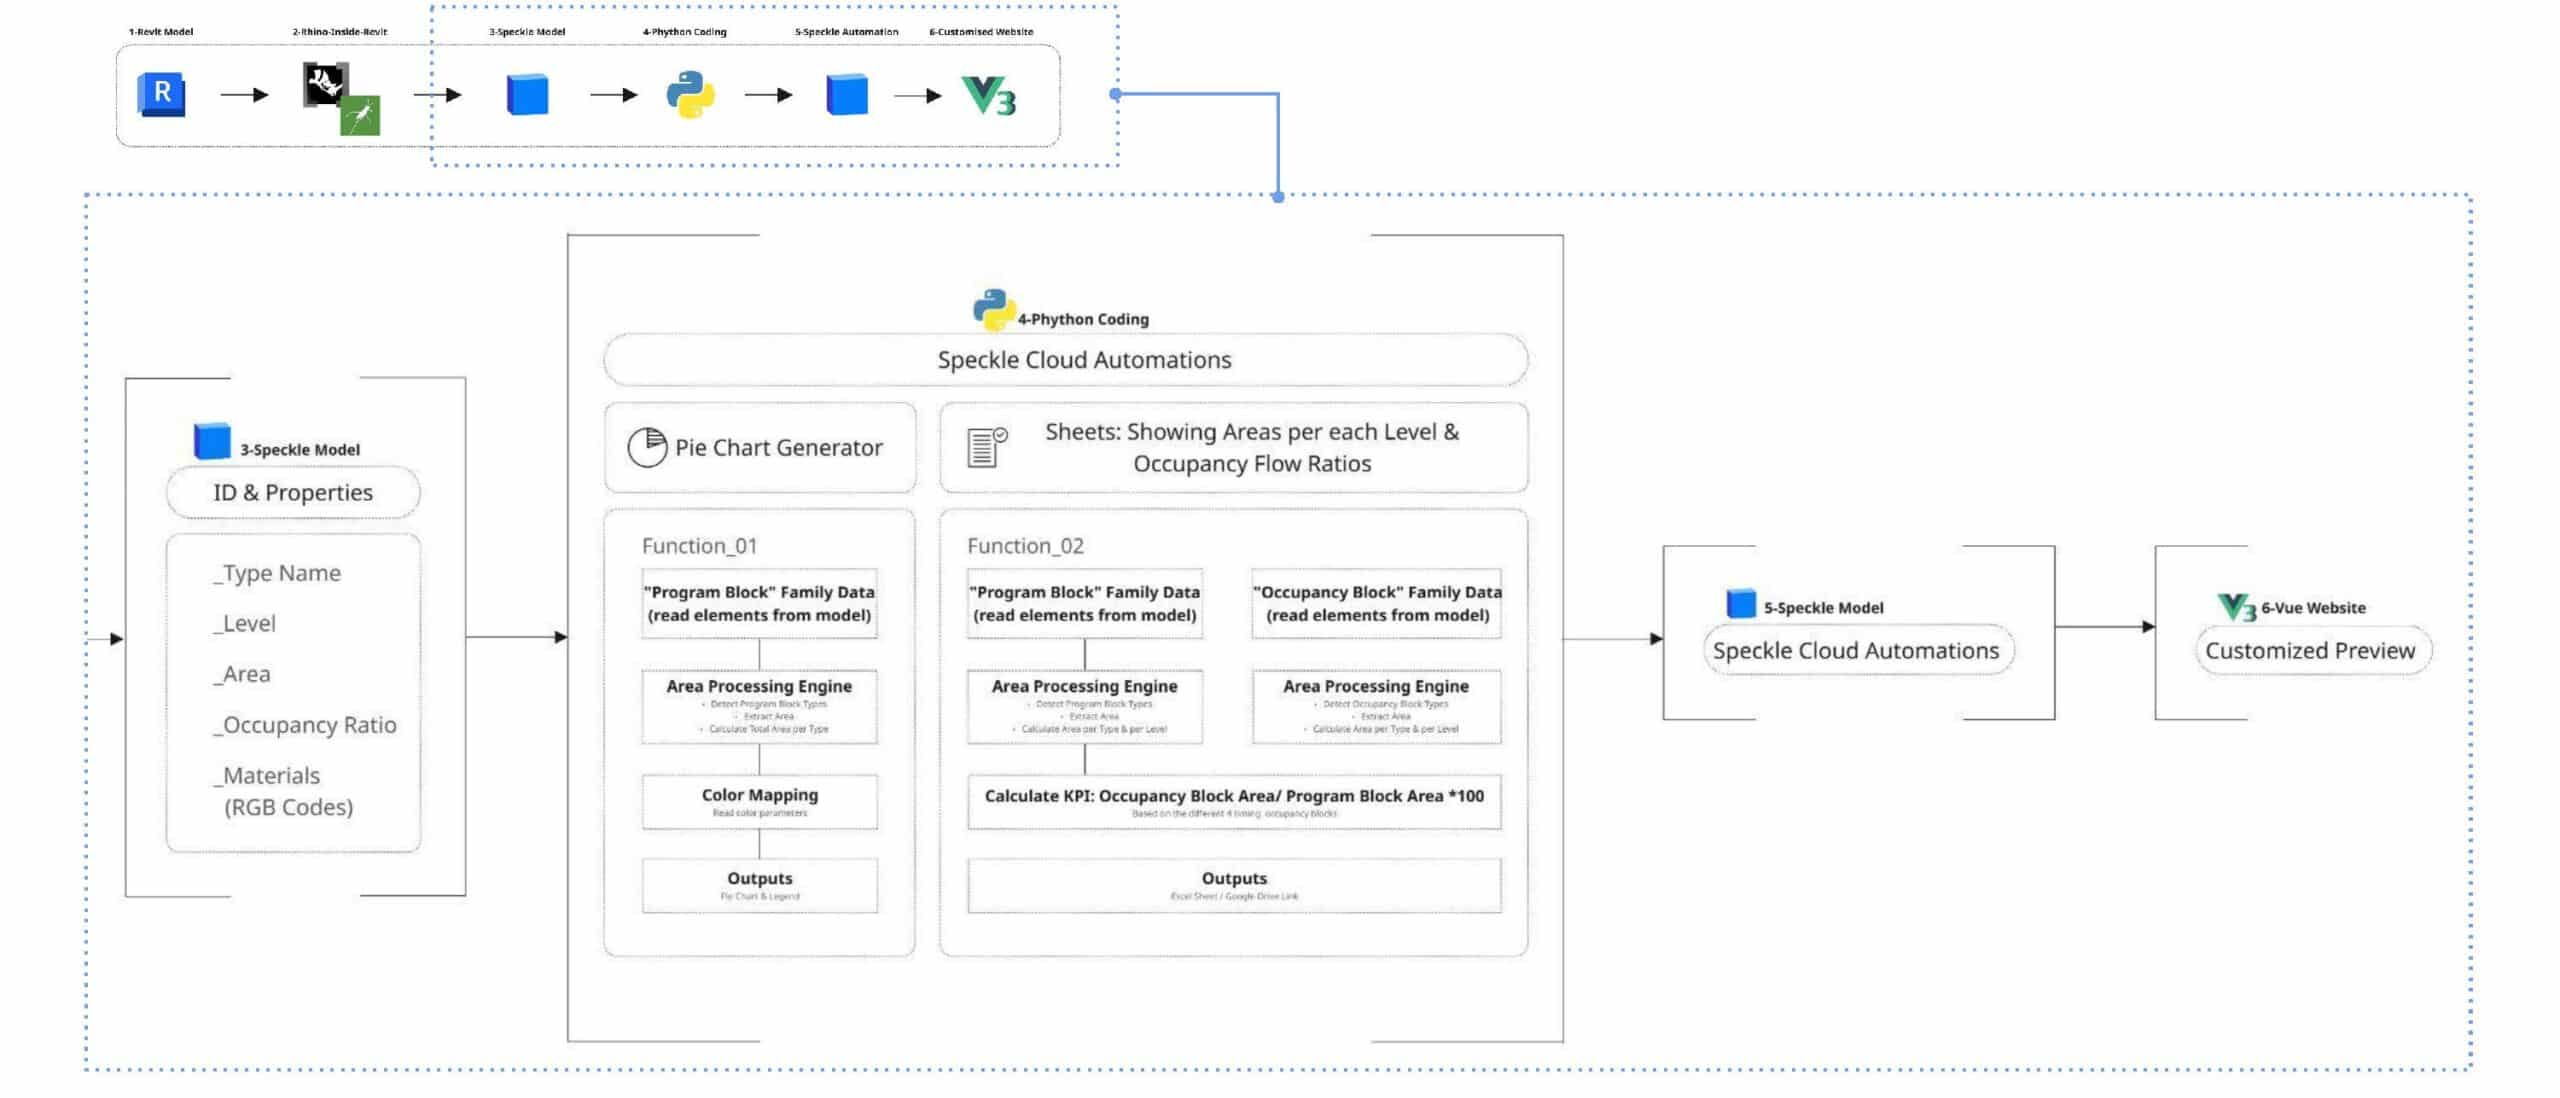
Once the model is streamed to Speckle, the data is processed automatically. Each element already contains properties such as level, area, program type and occupancy ratios. Our Speckle automations run Python functions that calculate program distribution and occupancy-based KPIs, and generate visual outputs such as chart and structured datasets. These results are then displayed in a custom app interface made with Vue.
How it works | User workflow
How it works | back end
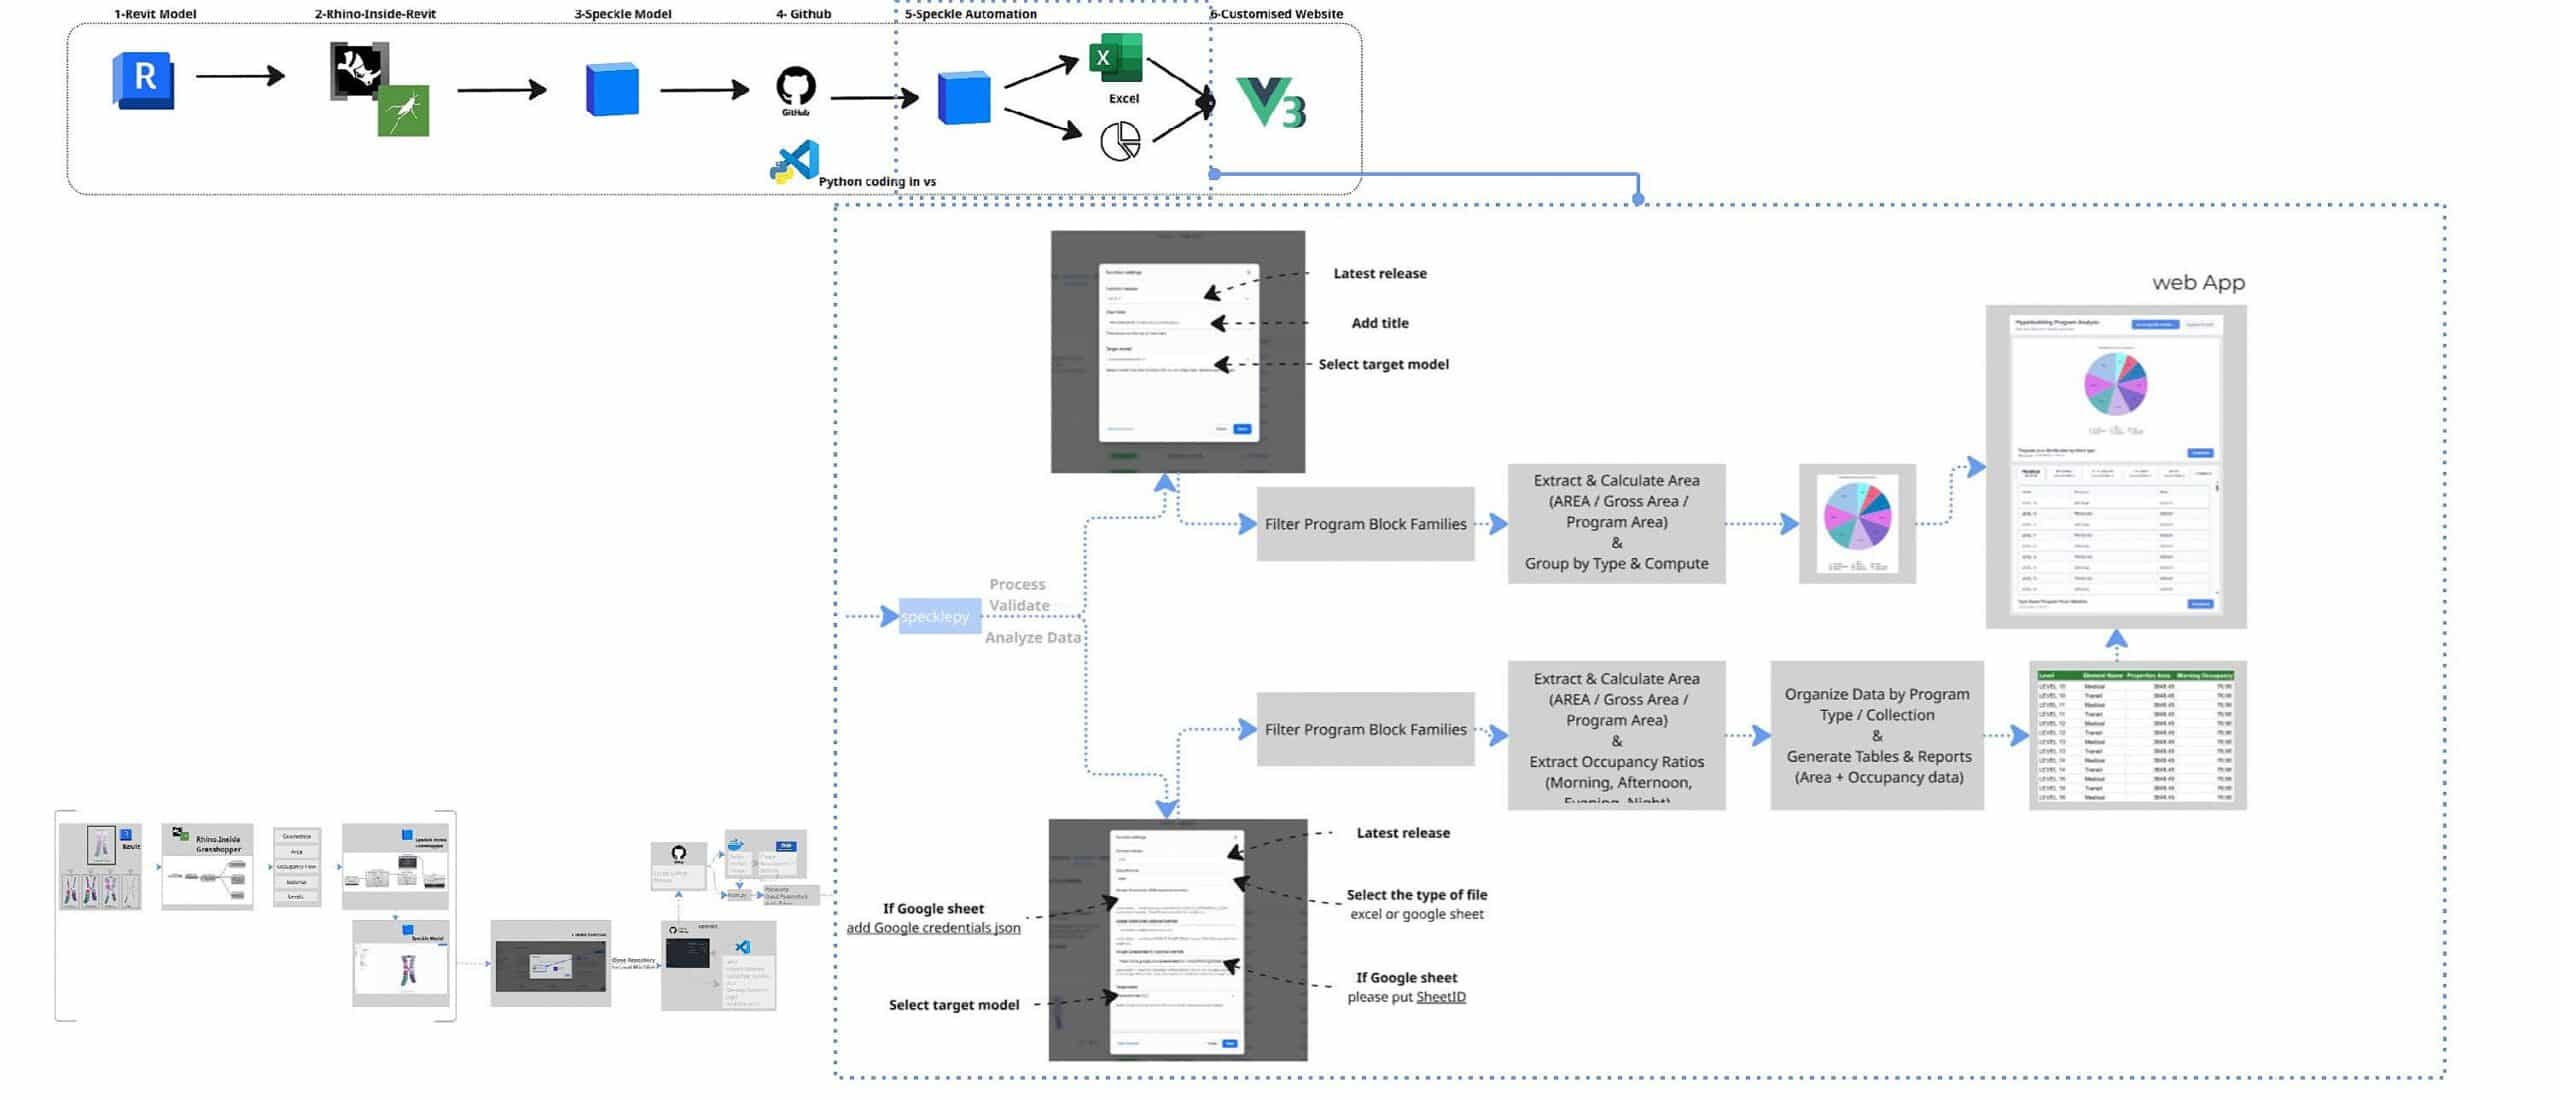
Overview of the Data Pipeline
This workflow presents a streamlined data pipeline that bridges traditional BIM modelling with automated cloud analytics and custom web visualization. By using Speckle as a central hub, design data flows seamlessly from Autodesk Revit through Python-based automation to generate real time insights. The processed information is then delivered through structured reports and an interactive interface built with Vue.js, enabling teams to quickly interpret and analyse design data.
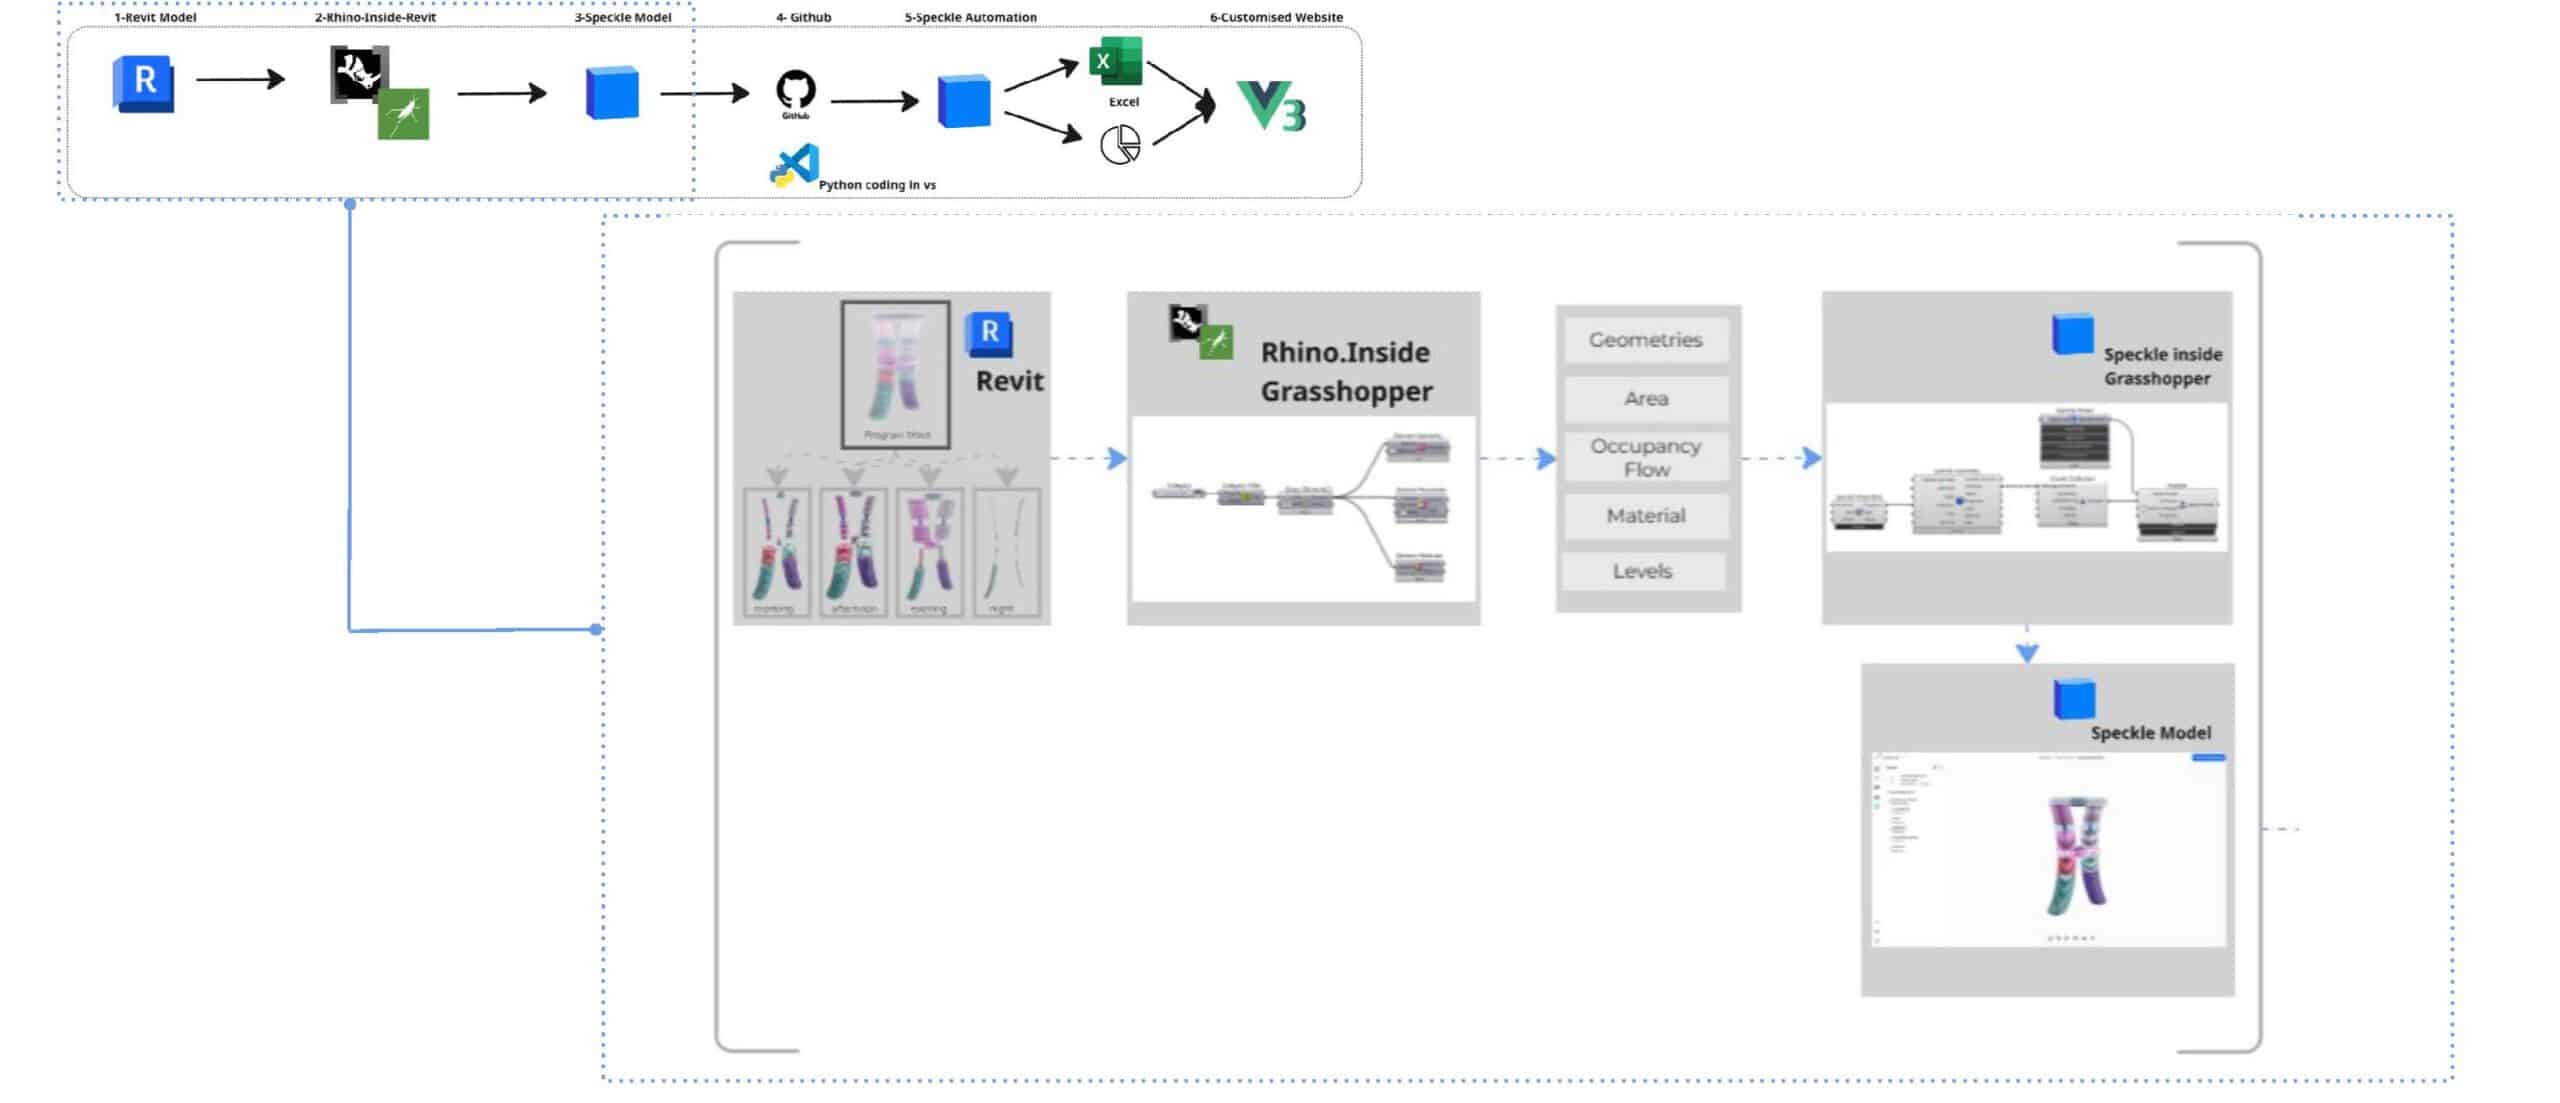
Data Extraction from the BIM Model
The workflow begins in Revit, where building geometry and parameters serve as the primary data source. Using Rhino.Inside with Grasshopper, native Revit elements are translated into a flexible computational environment. Key architectural metrics such as geometry, area, occupancy flow, materials, and levels, are isolated and prepared for analysis. This filtered dataset is then pushed to a centralised Speckle model, creating a web-accessible repository for all design information.
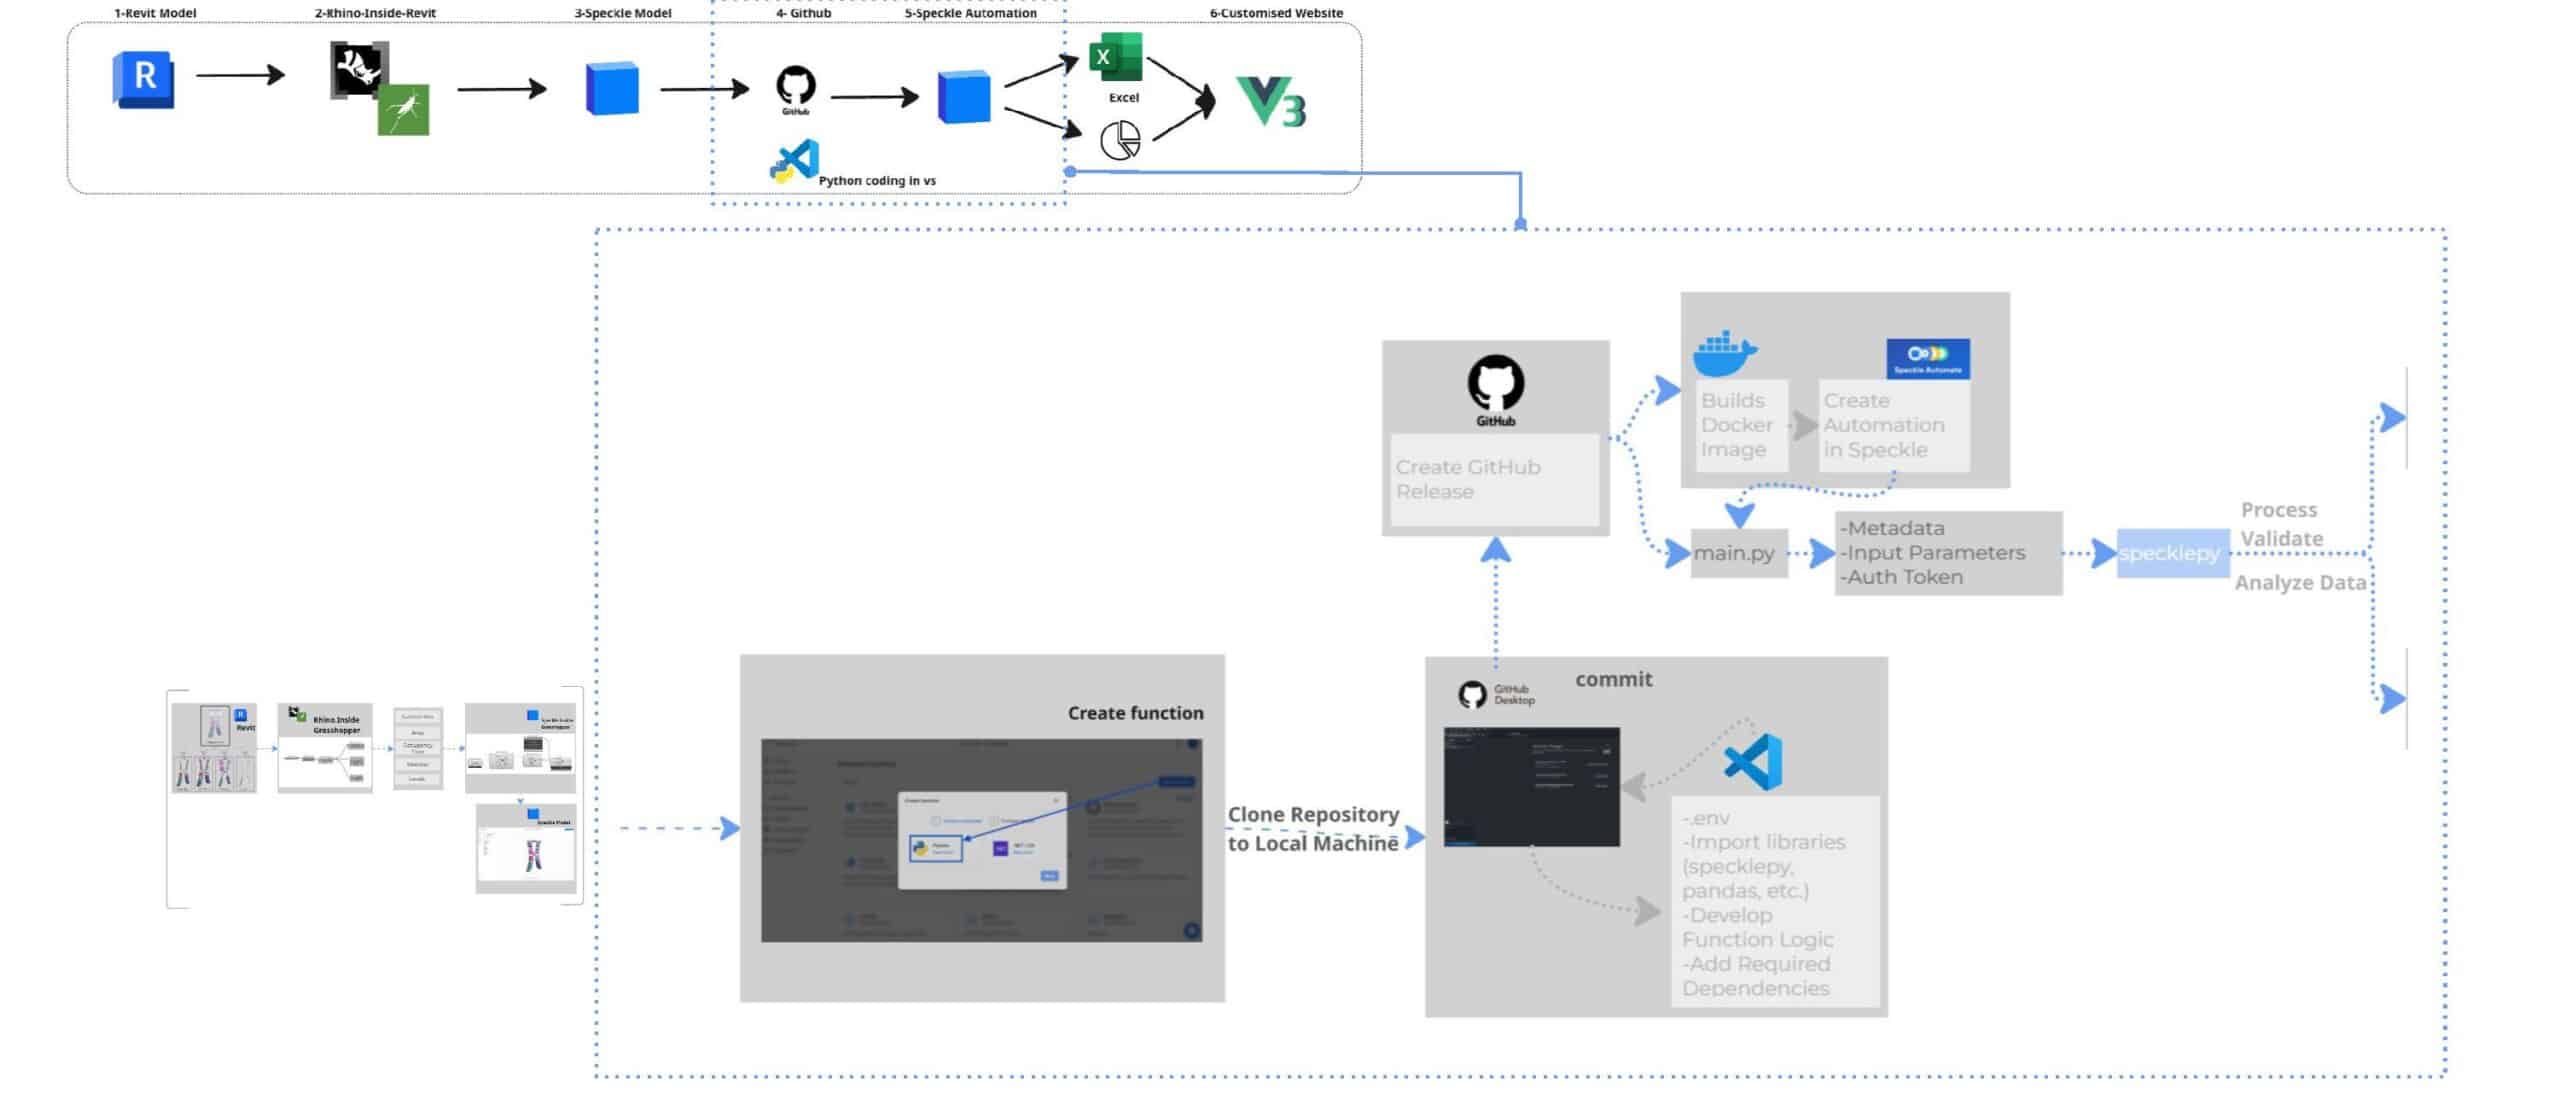
Automation Setup and Cloud Deployment
Automation begins by creating a function and cloning the repository locally for custom script development. The workflow is managed through GitHub and developed in Visual Studio Code, where Python libraries such as specklepy and pandas handle the data processing logic. Once the script is committed, a GitHub Release triggers a Docker build, allowing the automation to run reliably within a consistent and scalable cloud environment.
Data Processing and Visualization
The Speckle Automate function processes and validates the BIM data by filtering specific program block families and calculating key metrics such as gross area versus program area. It also analyses occupancy patterns across different times of the day. The resulting dataset is visualized through dashboards built with Vue.js and exported as structured reports to Excel or Google Sheets. This automation organizes program data from the BIM model, making it easier to track areas and floor distributions while providing accurate, structured information that other teams can use for analysis and decision-making.
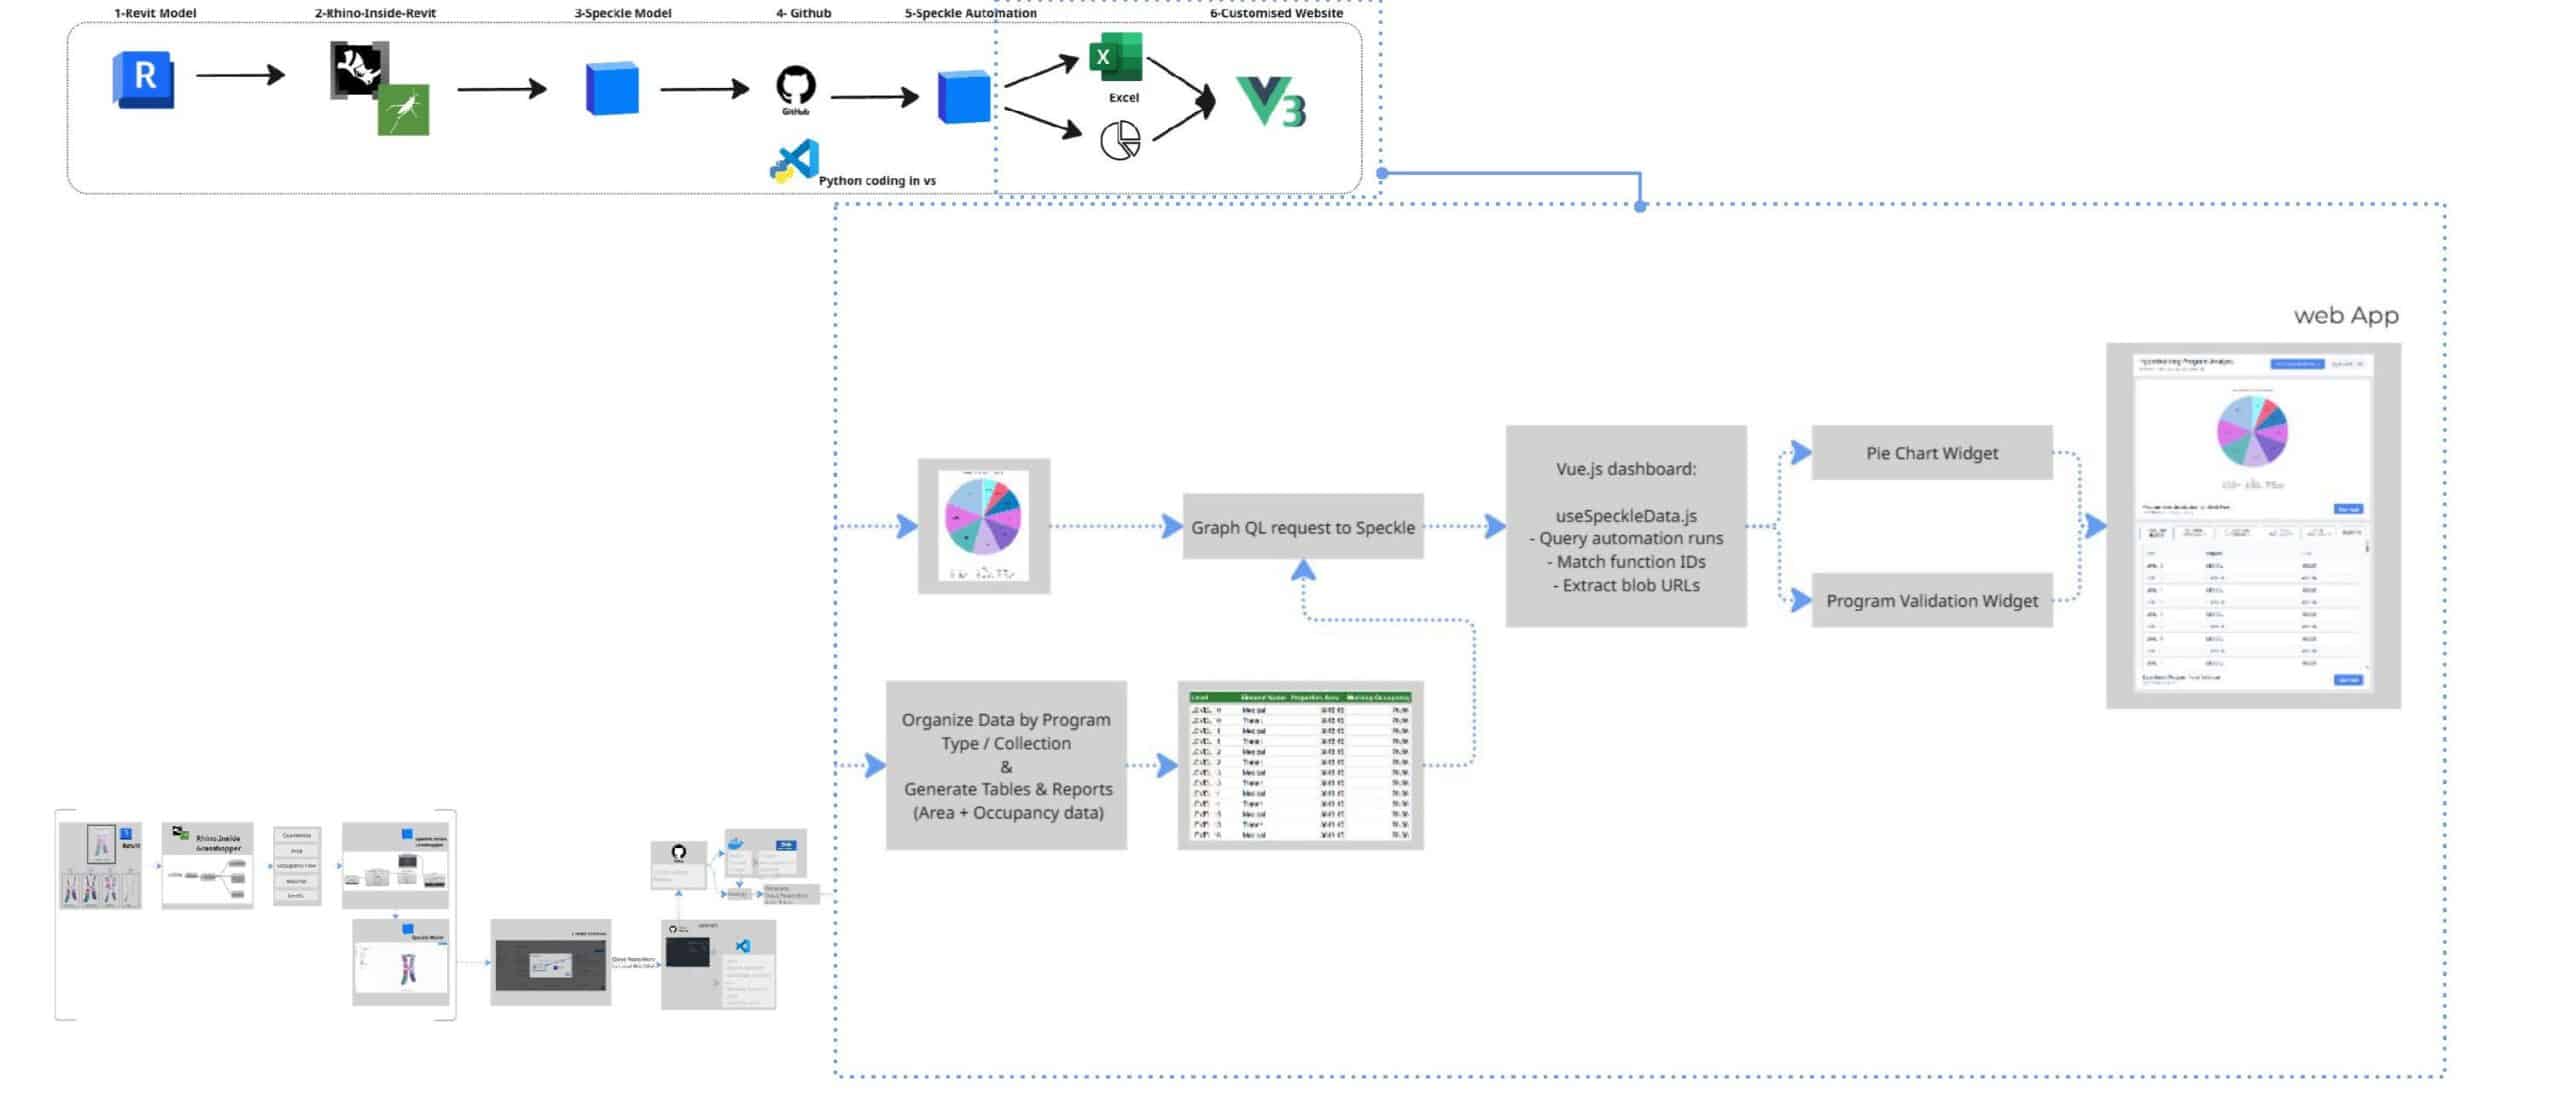
Customised Dashboard App
After the pie chart and Excel sheet are generated by Speckle Automate, our custom Vue dashboard connects to display the results. The dashboard queries Speckle’s GraphQL API every 60 seconds, fetches the latest automation results by project and model ID, matches the function IDs to identify which speckle blob contains the pie chart and which contains the Excel validation data, and displays both in real-time.
Critically, the dashboard doesn’t trigger the automation – it simply displays the results that were automatically generated when the model was updated. It’s a live window into the latest validated state of the design.
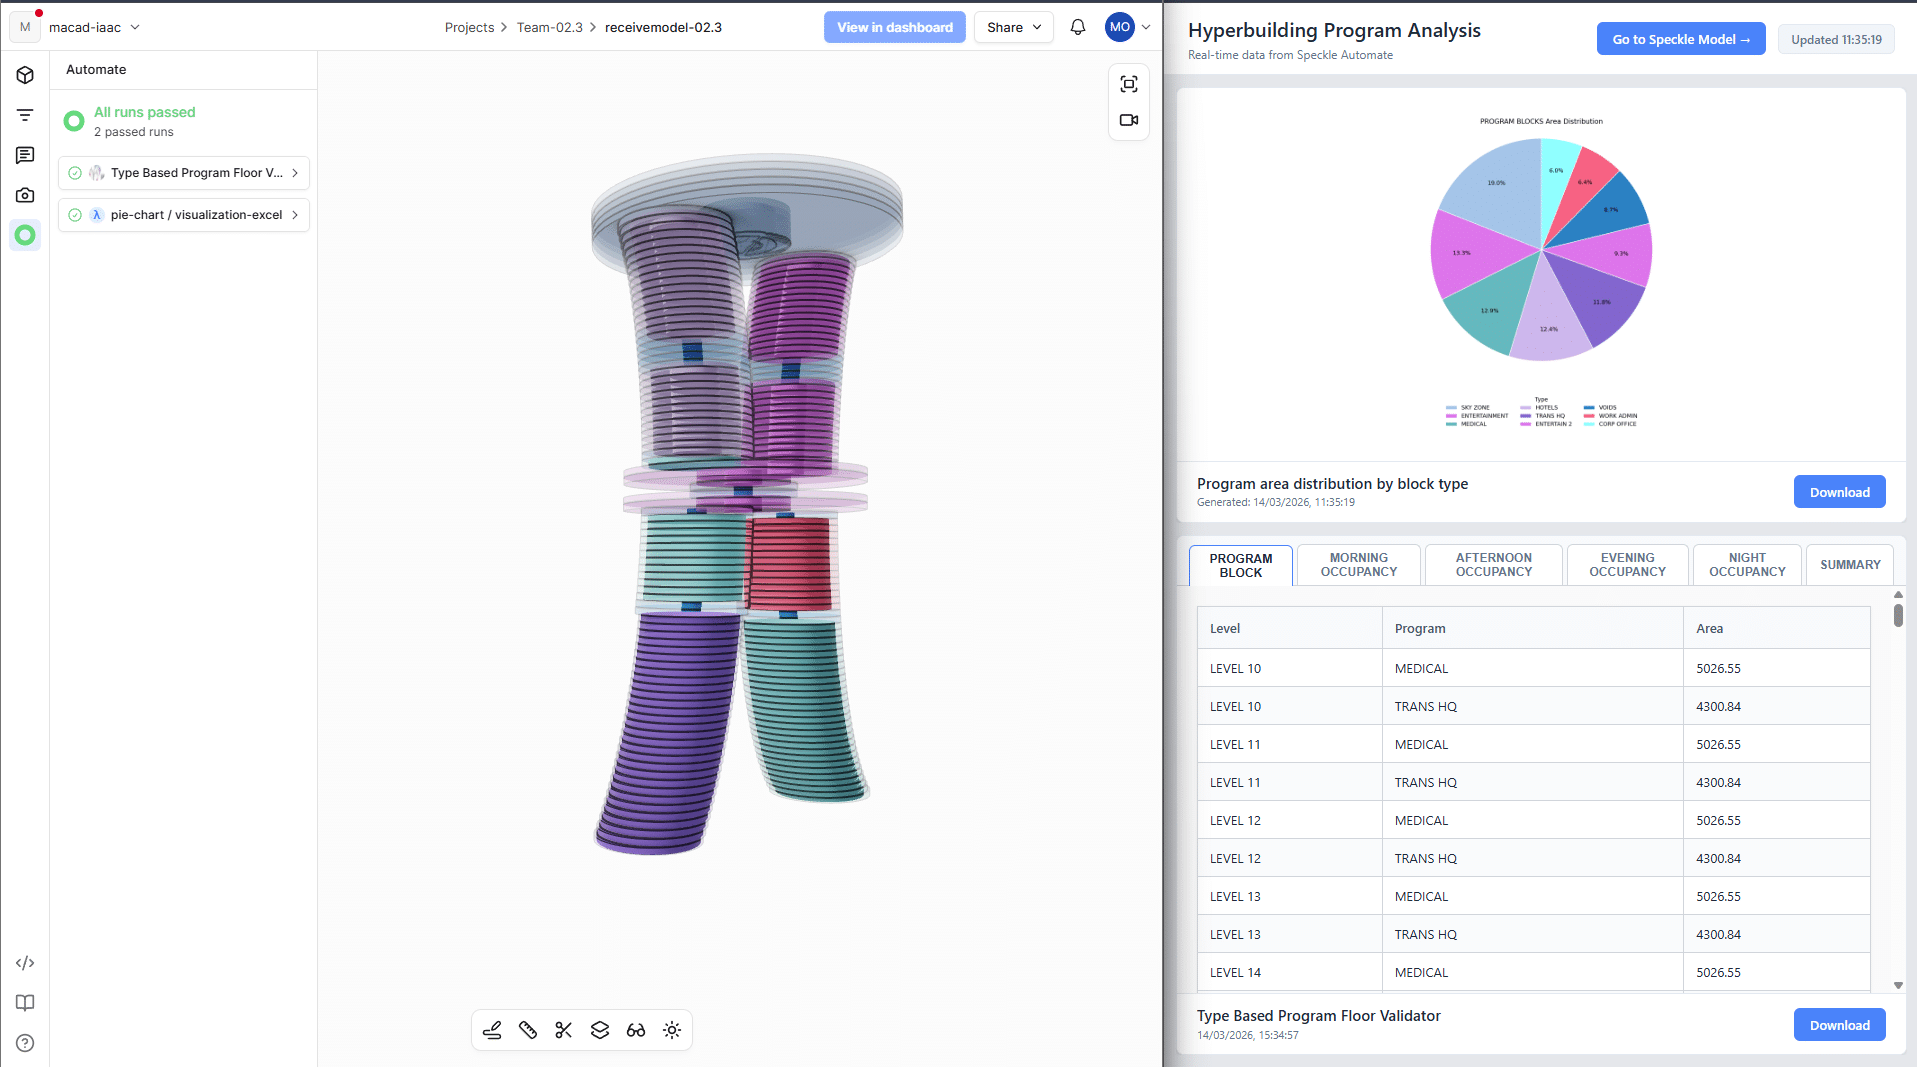
And here’s what that looks like in practice. On the left, you see the Speckle 3D viewer showing our building model with the automation status panel – you can see both functions ran successfully and are marked as ‘passed.’
On the right is our custom Vue.js dashboard, which team members can open in any browser to visualise the results of the speckle automation functions in real time without having to download attachments every time the project is updated.
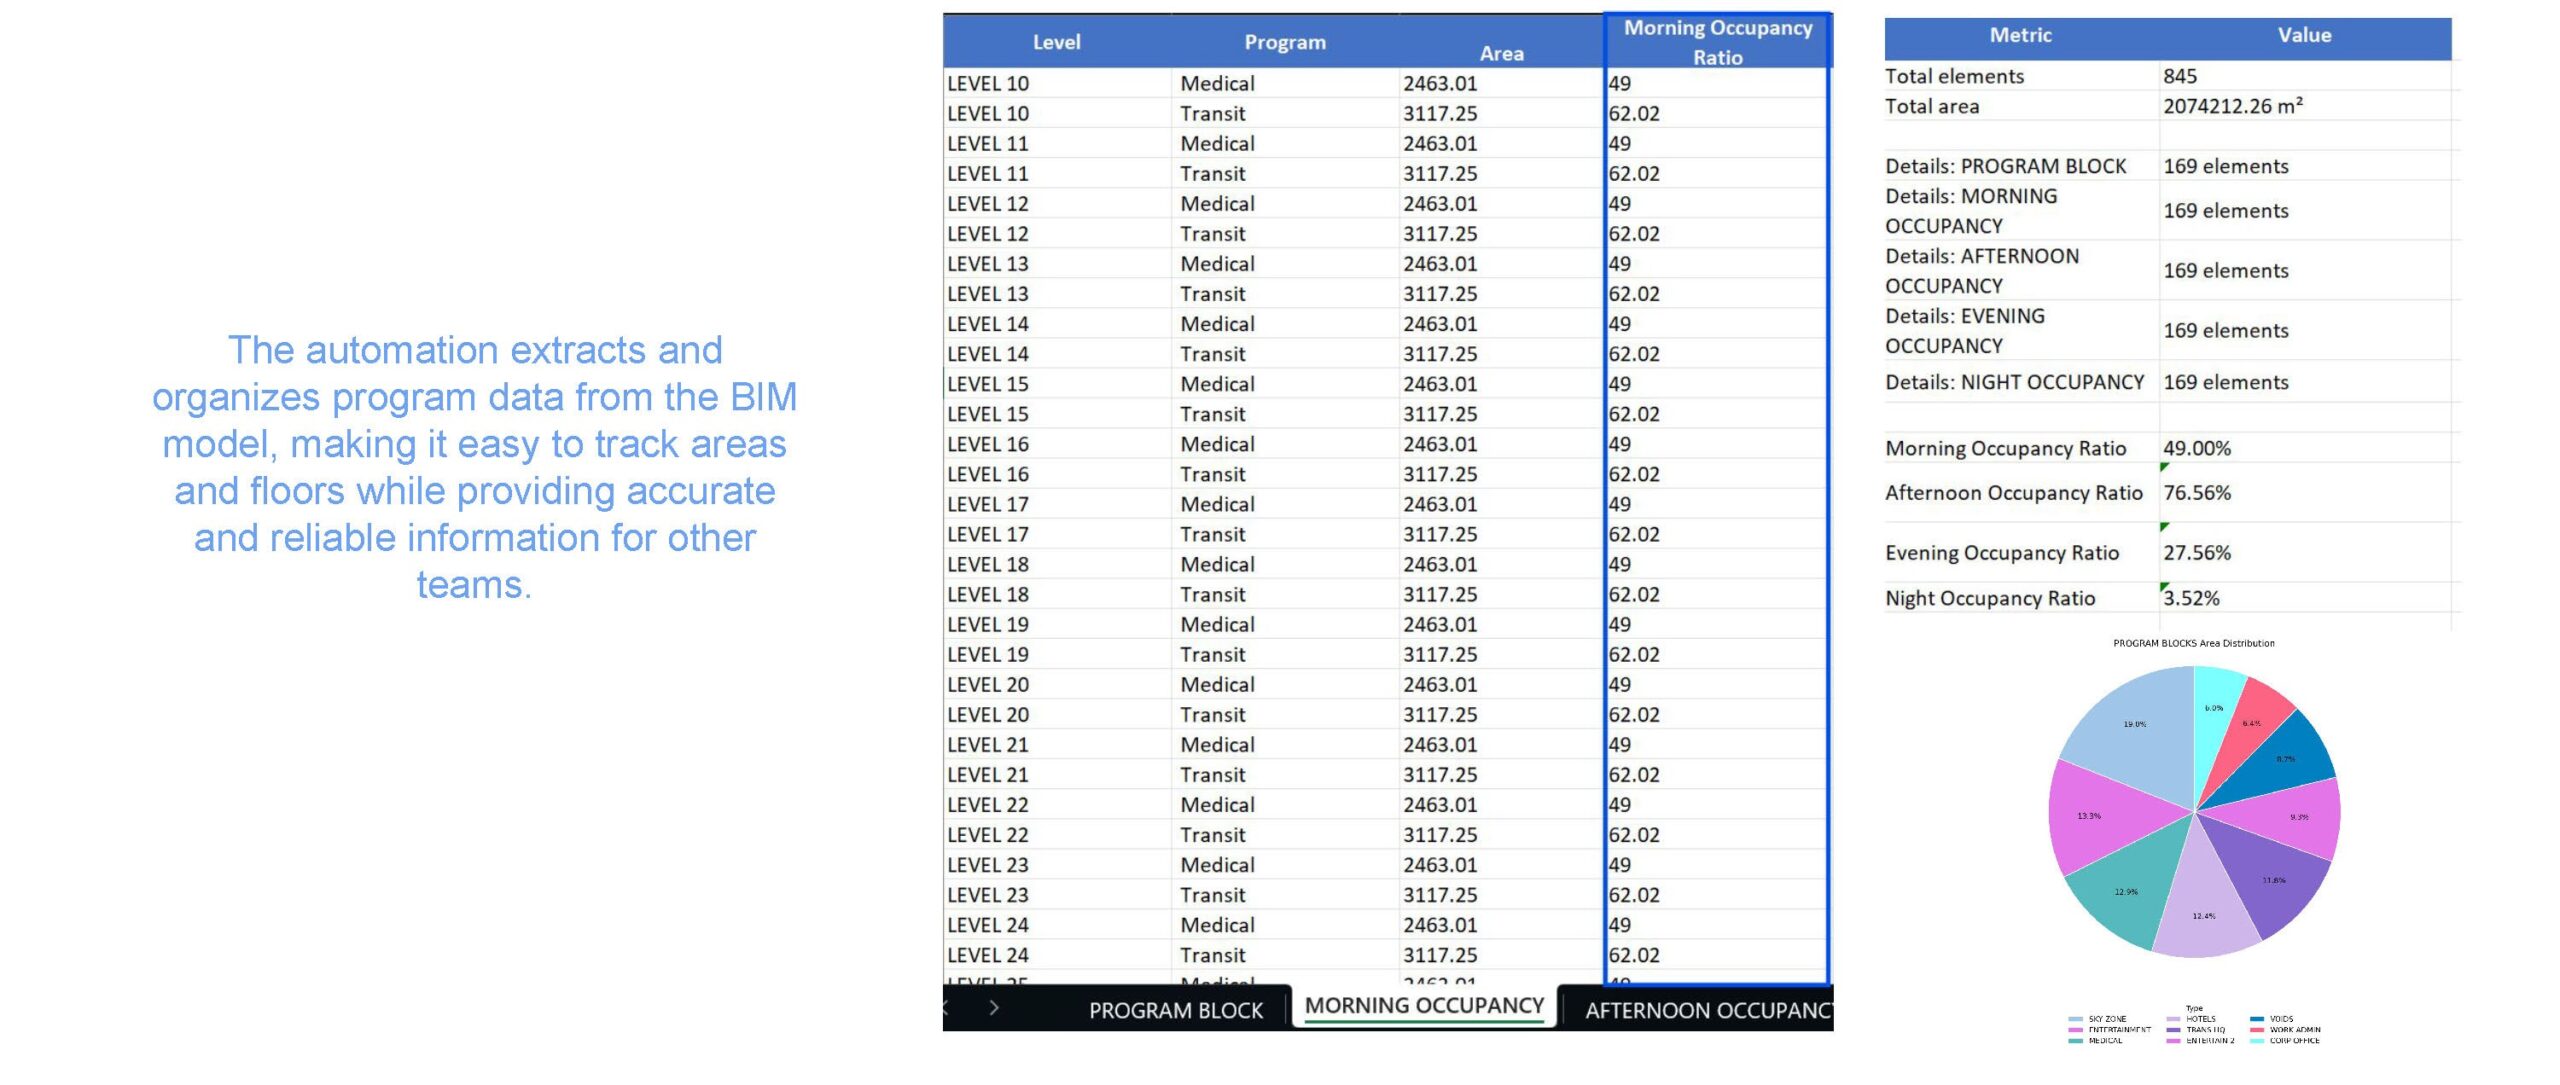
Automation Results
The automation extracts and organises the program data from the BIM model, making it easier to track areas, floor distribution and occupancy flow. It provides accurate and structured data that other teams can use reliably for analysis and decision making.
Success Criteria
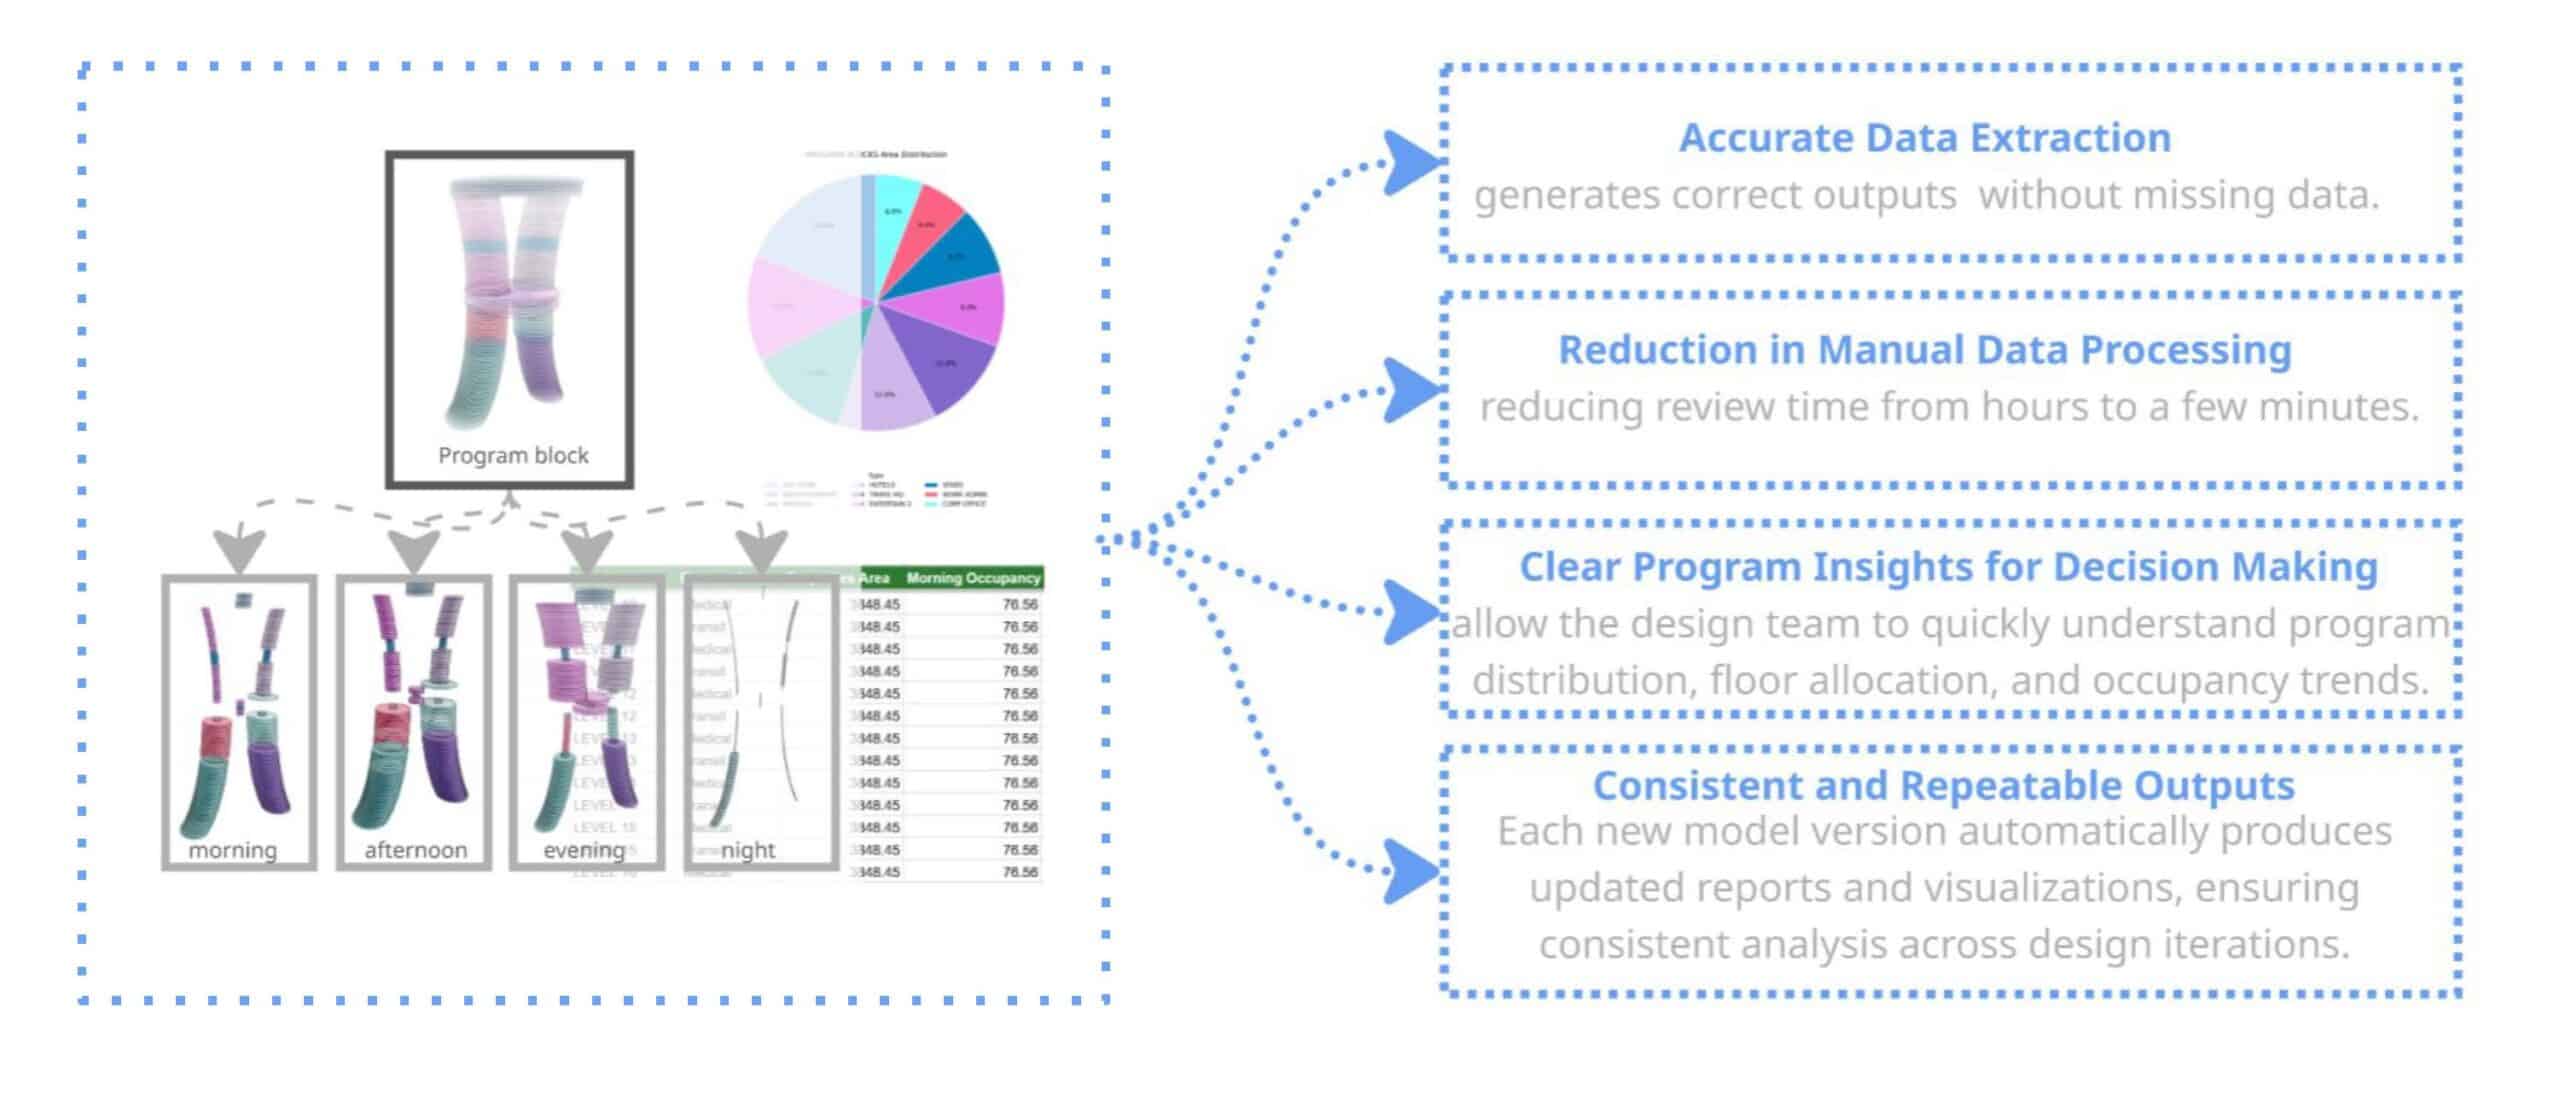
To evaluate the system, we defined a few success criteria:
First, the functions should accurately extract program and occupancy data from the BIM model.
Second, the workflow should reduce manual data processing, allowing the team to generate results in just a few minutes.
It should also provide clear insights about program distribution and occupancy patterns.
And finally, the system should produce consistent outputs across different model versions, so the analysis can be repeated during the design process.
Future Scope & Limitations
While the system currently depends on quality model data, future development could compare actual area and occupancy values with predefined program requirements and automatically detect program mismatches.