
This project aims to explore the possibilities of mapping global scale data onto an 3D globe – in this case the CO2 emissions per country in Megatons.
The project reveals the five biggest contributors to CO2 Emissions in 2019 – China, USA, Russia, Indian & Japan
and also shows how little CO2 is emitted by countries more likeley to affected by climate change.
Process
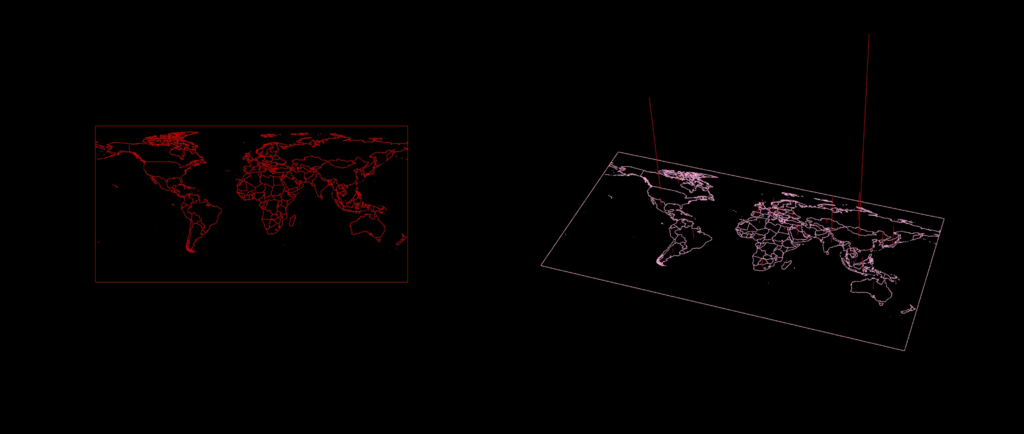
For this grasshopper visualization a .GEOJSON file with the data for the outlines of the countries and their CO2 emissions were
mapped from 2D onto a sphere, extruded boxes around the contries centerpoints represent the emitted CO2 value in MT.

CO2 Emissions per country in 2019 in Megatons MT
Data
Data on CO2 and Greenhouse Gas Emissions by Our World in Data – https://ourworldindata.org/
