HB02: The Heart of the Vertical Machine
1. Project Overview
1.1 HB02 within the Vertical Machine
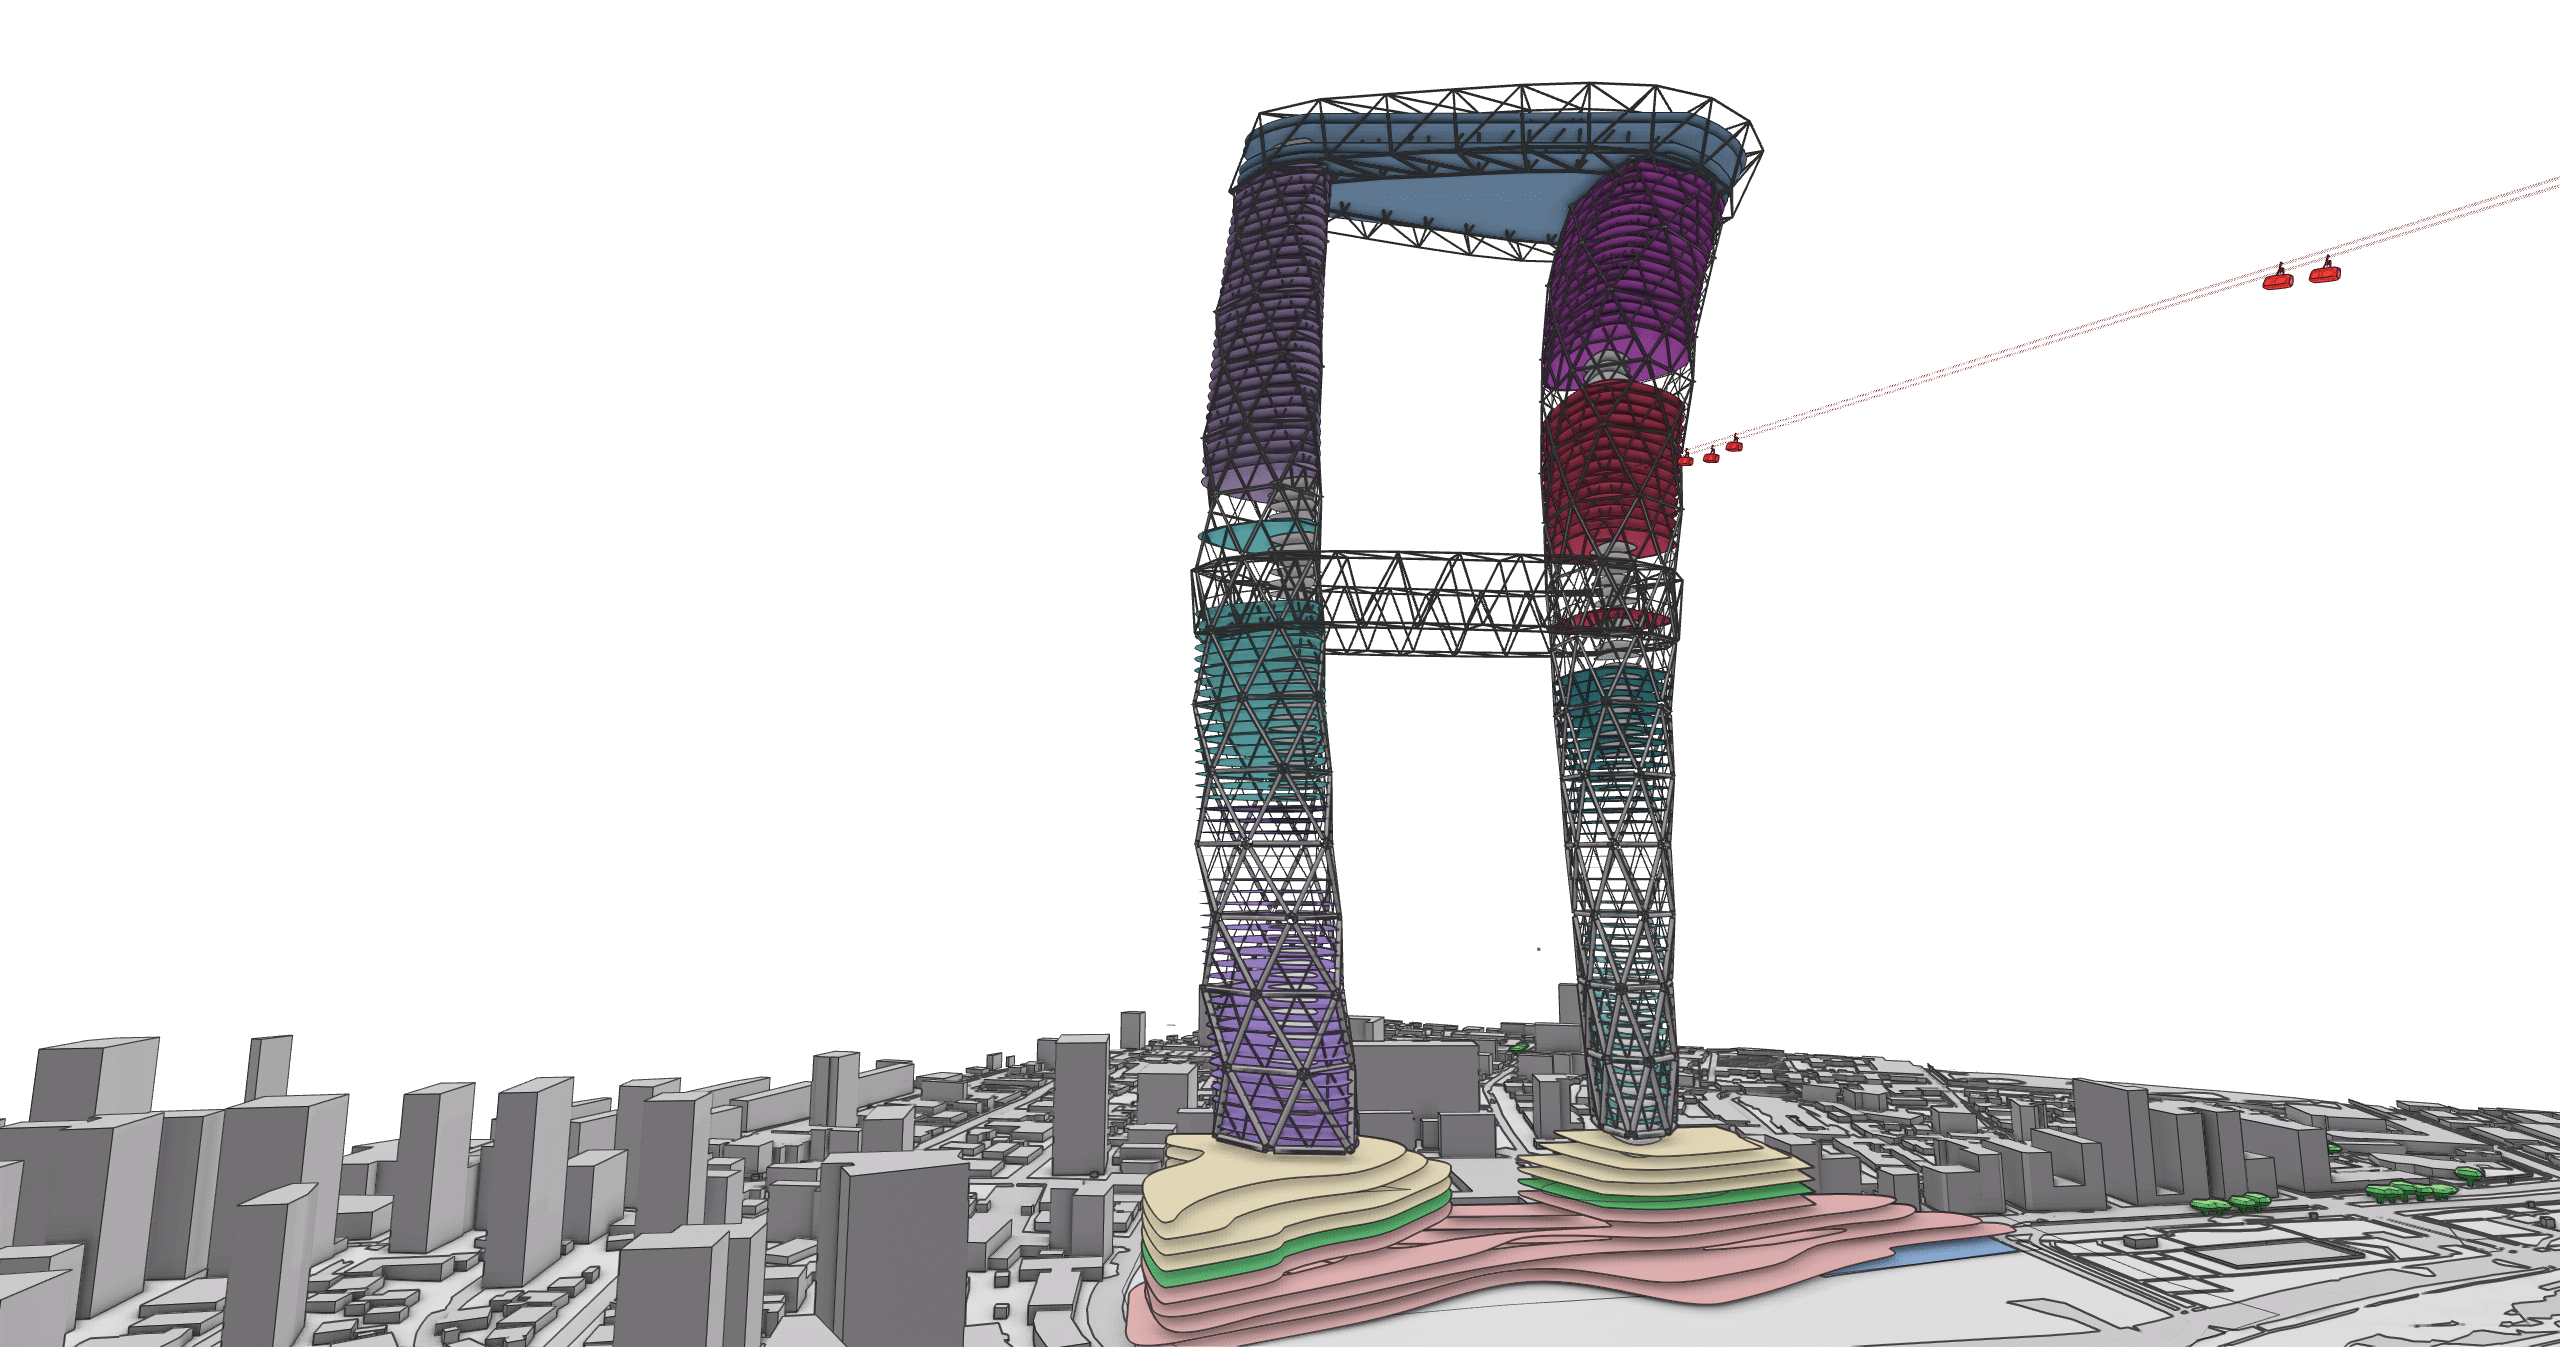
In the pursuit of reimagining high-density urban living, our collaborative team developed Hyperbuilding 02 (HB02), also known as “The Heart”. As part of a larger 3-million-square-meter urban organism, HB02 serves as the vital circulatory engine, pumping life, data, and energy through the “Vertical Machine”.
This project was a massive interdisciplinary effort, bringing together three specialized groups: Data, Structure/Facade, and Program. Together, we designed a system where architecture doesn’t just house functions—it breathes with the rhythm of the city.
2. Interdisciplinary Collaboration Framework
A project of this scale requires seamless integration across disciplines.
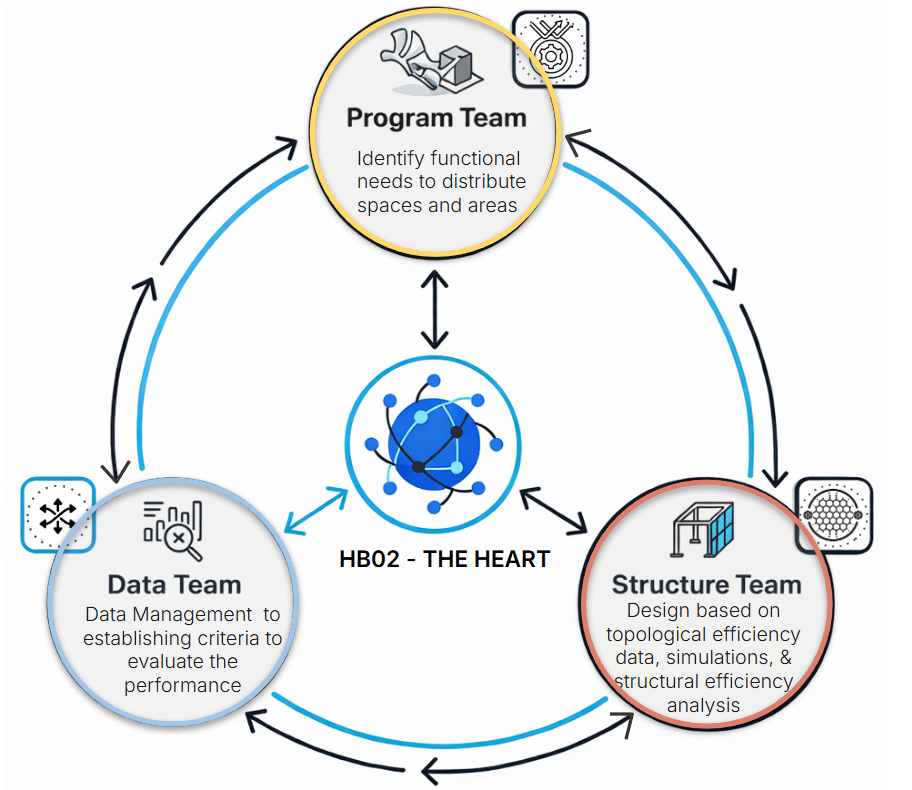
2.1 Team Roles: Data, Program, and Structure/Facade
- The Data Group: Our team of three focused on the project’s “metabolism,” building the data pipelines and KPI frameworks that monitor operational and spatial performance.
- The Program Group: Responsible for the complex zoning of “organs,” ensuring that commercial and hotel functions are strategically placed to capture the flow of travelers.
- The Structure/Facade Group: Designed the “skeleton” and “skin,” creating an exoskeleton that thickens at points of high stress and a facade that acts as a thermal map of the building’s activity.
3. Urban Role and Mobility Intensity
3.1 Eight Transit Modes & 153,000 Daily Travelers and
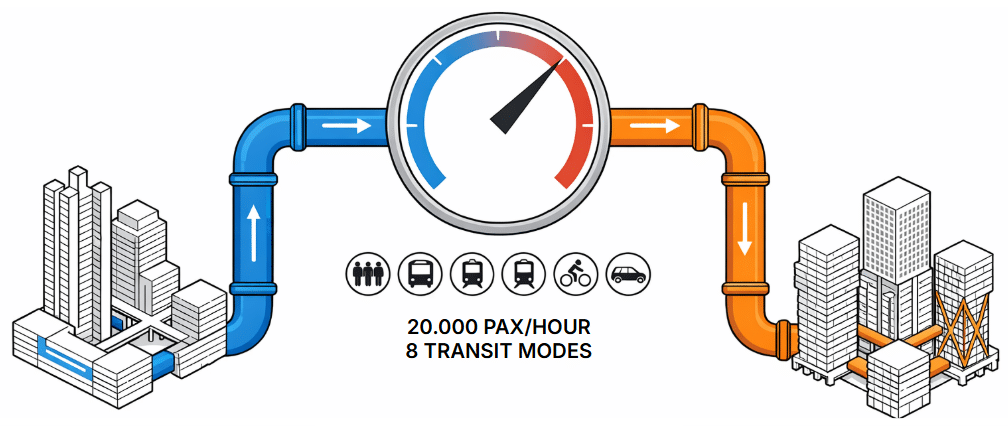
HB02 is defined by movement. It is the single confluence point for eight transit modes, including metro, bus, taxi, and pedestrian paths.
- Peak Flow: At its highest intensity, the heart handles 20,000 people per hour.
- The Rhythm: Morning rushes push “blood” (commuters) toward offices, while evenings and weekends shift the flow toward leisure and hotel functions.
4. KPI Framework
To ensure the Vertical Machine remains healthy, our data team established key performance indicators (KPIs) to monitor the building’s vitals in real-time:
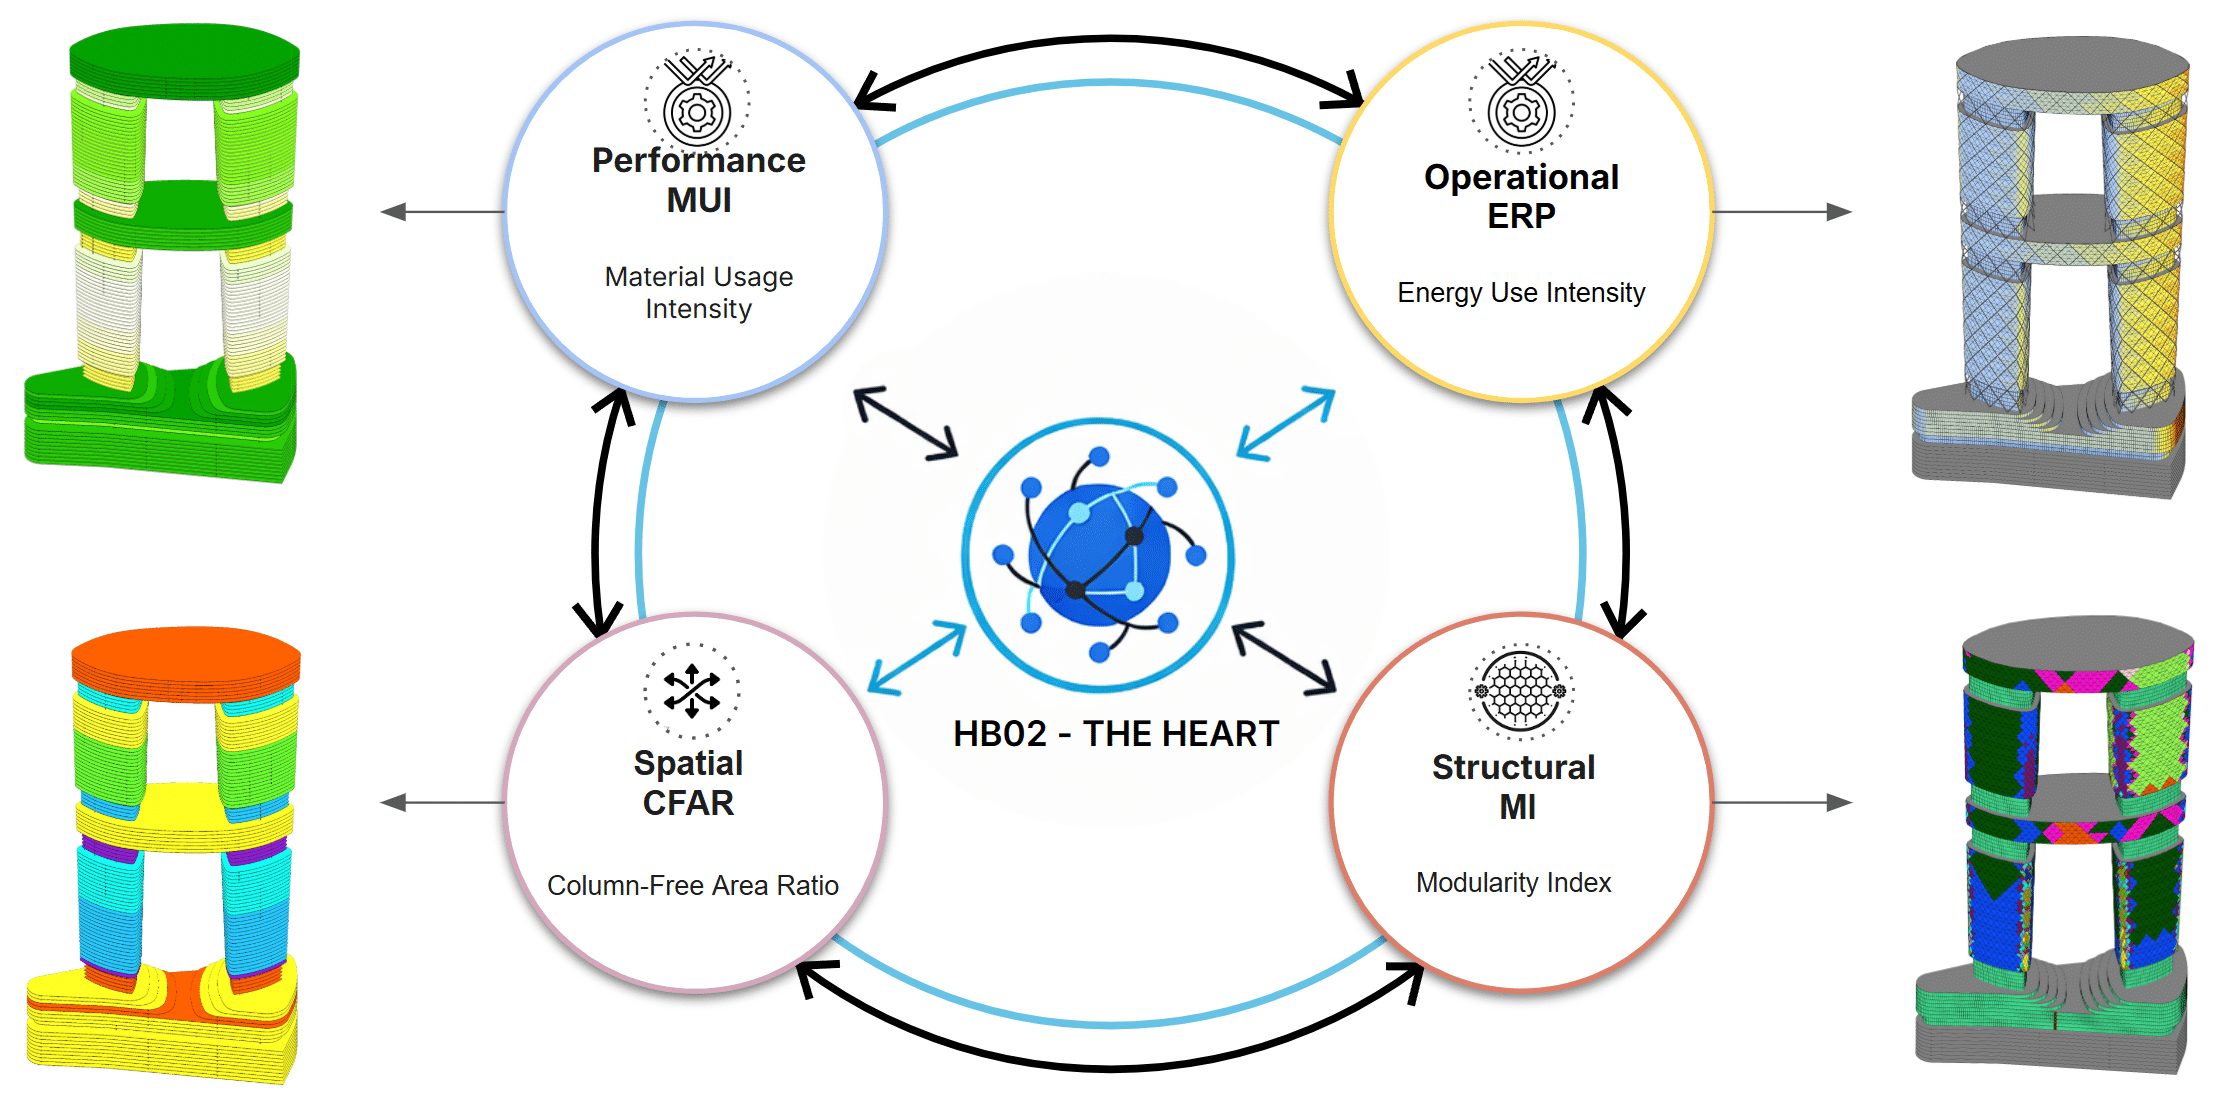
4.1 Core KPI Families
- Mobility Efficiency: We track passenger throughput density to ensure it remains between 3–5 users/m², preventing congestion in the primary arteries.
- Spatial Performance: The Column-Free Area Ratio (CFAR) measures how effectively the structure allows for unobstructed transit flows.
- Energy Metabolism: The building operates as an exchange core, with an On-site Energy Exchange Ratio that tracks how energy is stored and redistributed to the neighboring “Lungs” (HB01) and “Cells” (HB03).
5. Data Workflow Integration
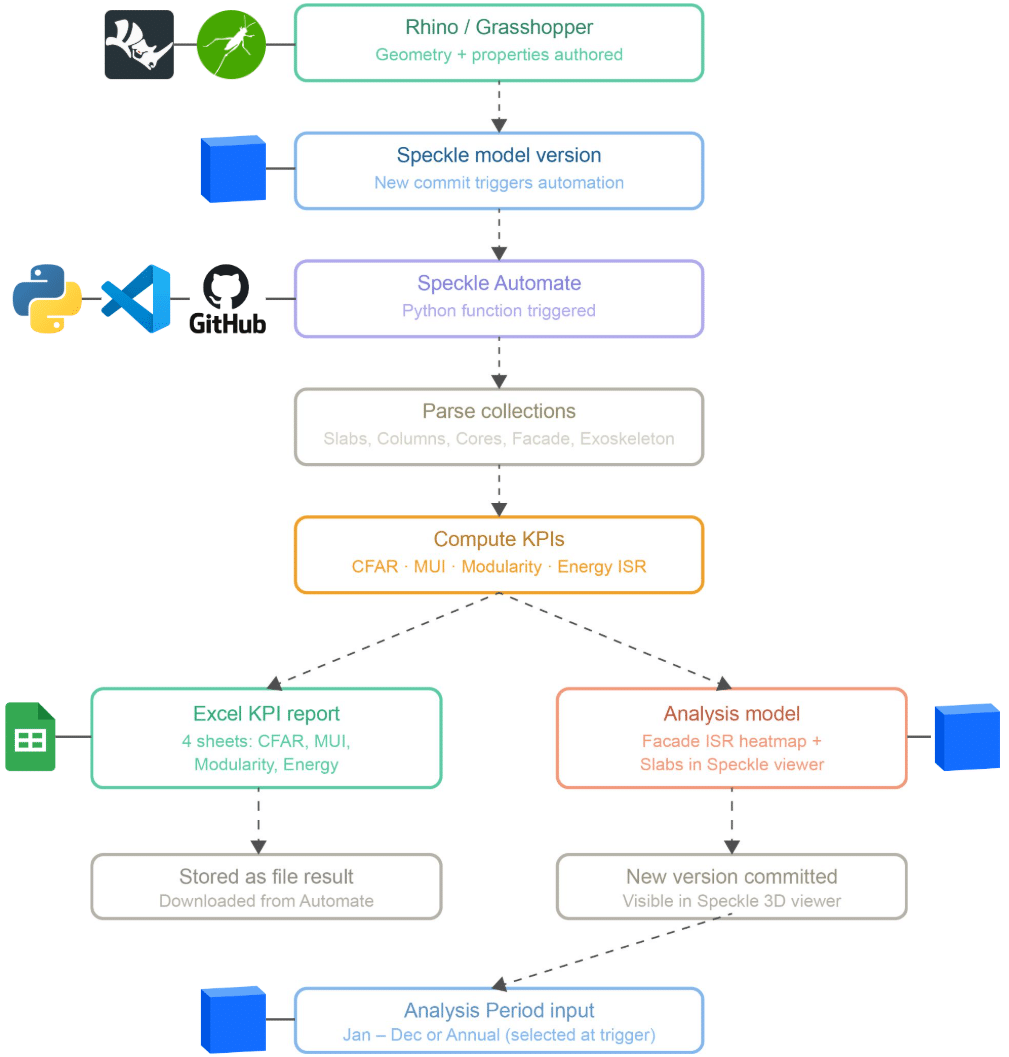
The workflow for HB02: The Heart was anchored by a custom-built, real-time data pipeline designed to bridge the gap between complex geometry and actionable performance metrics. By integrating Speckle as our central coordination engine, we transformed the traditional design process into a dynamic, feedback-driven ecosystem.
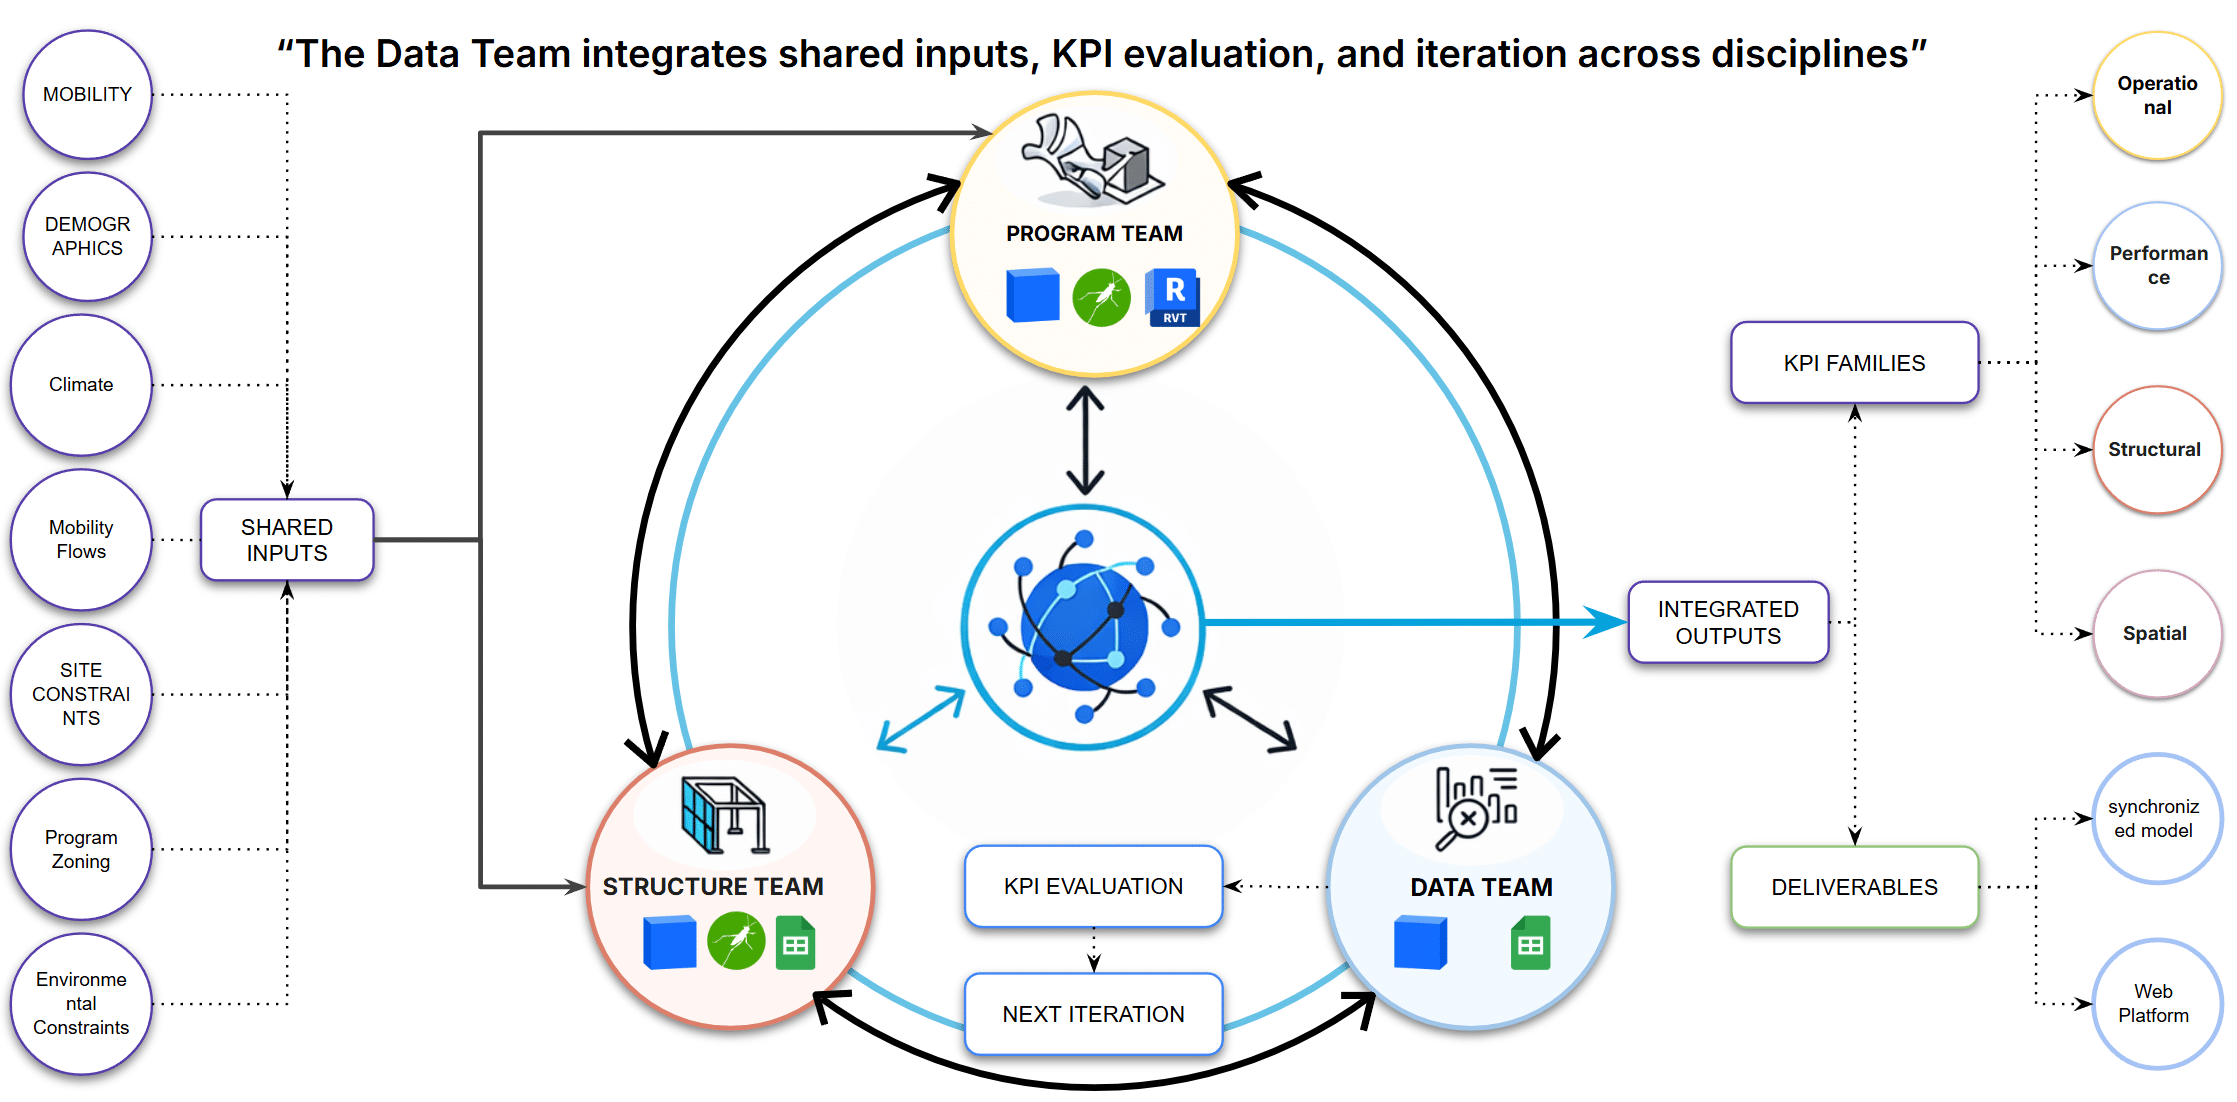
5.1 The Real-Time Data Workflow
Our group developed a “Live Data Collector” dashboard that served as the project’s central nervous system:
- Continuous Synchronization: We used Speckle to stream geometry and metadata from Rhino and Revit directly into a web-based platform.
- Automated KPI Extraction: As the Structure and Program teams updated the model, our data logic automatically parsed the changes to recalculate throughput, energy, and structural efficiency.
- The Feedback Loop: The dashboard allowed all three teams to see the immediate impact of design decisions on the building’s “vitals,” such as the Column-Free Area Ratio (CFAR) and Material Usage Intensity (MUI).
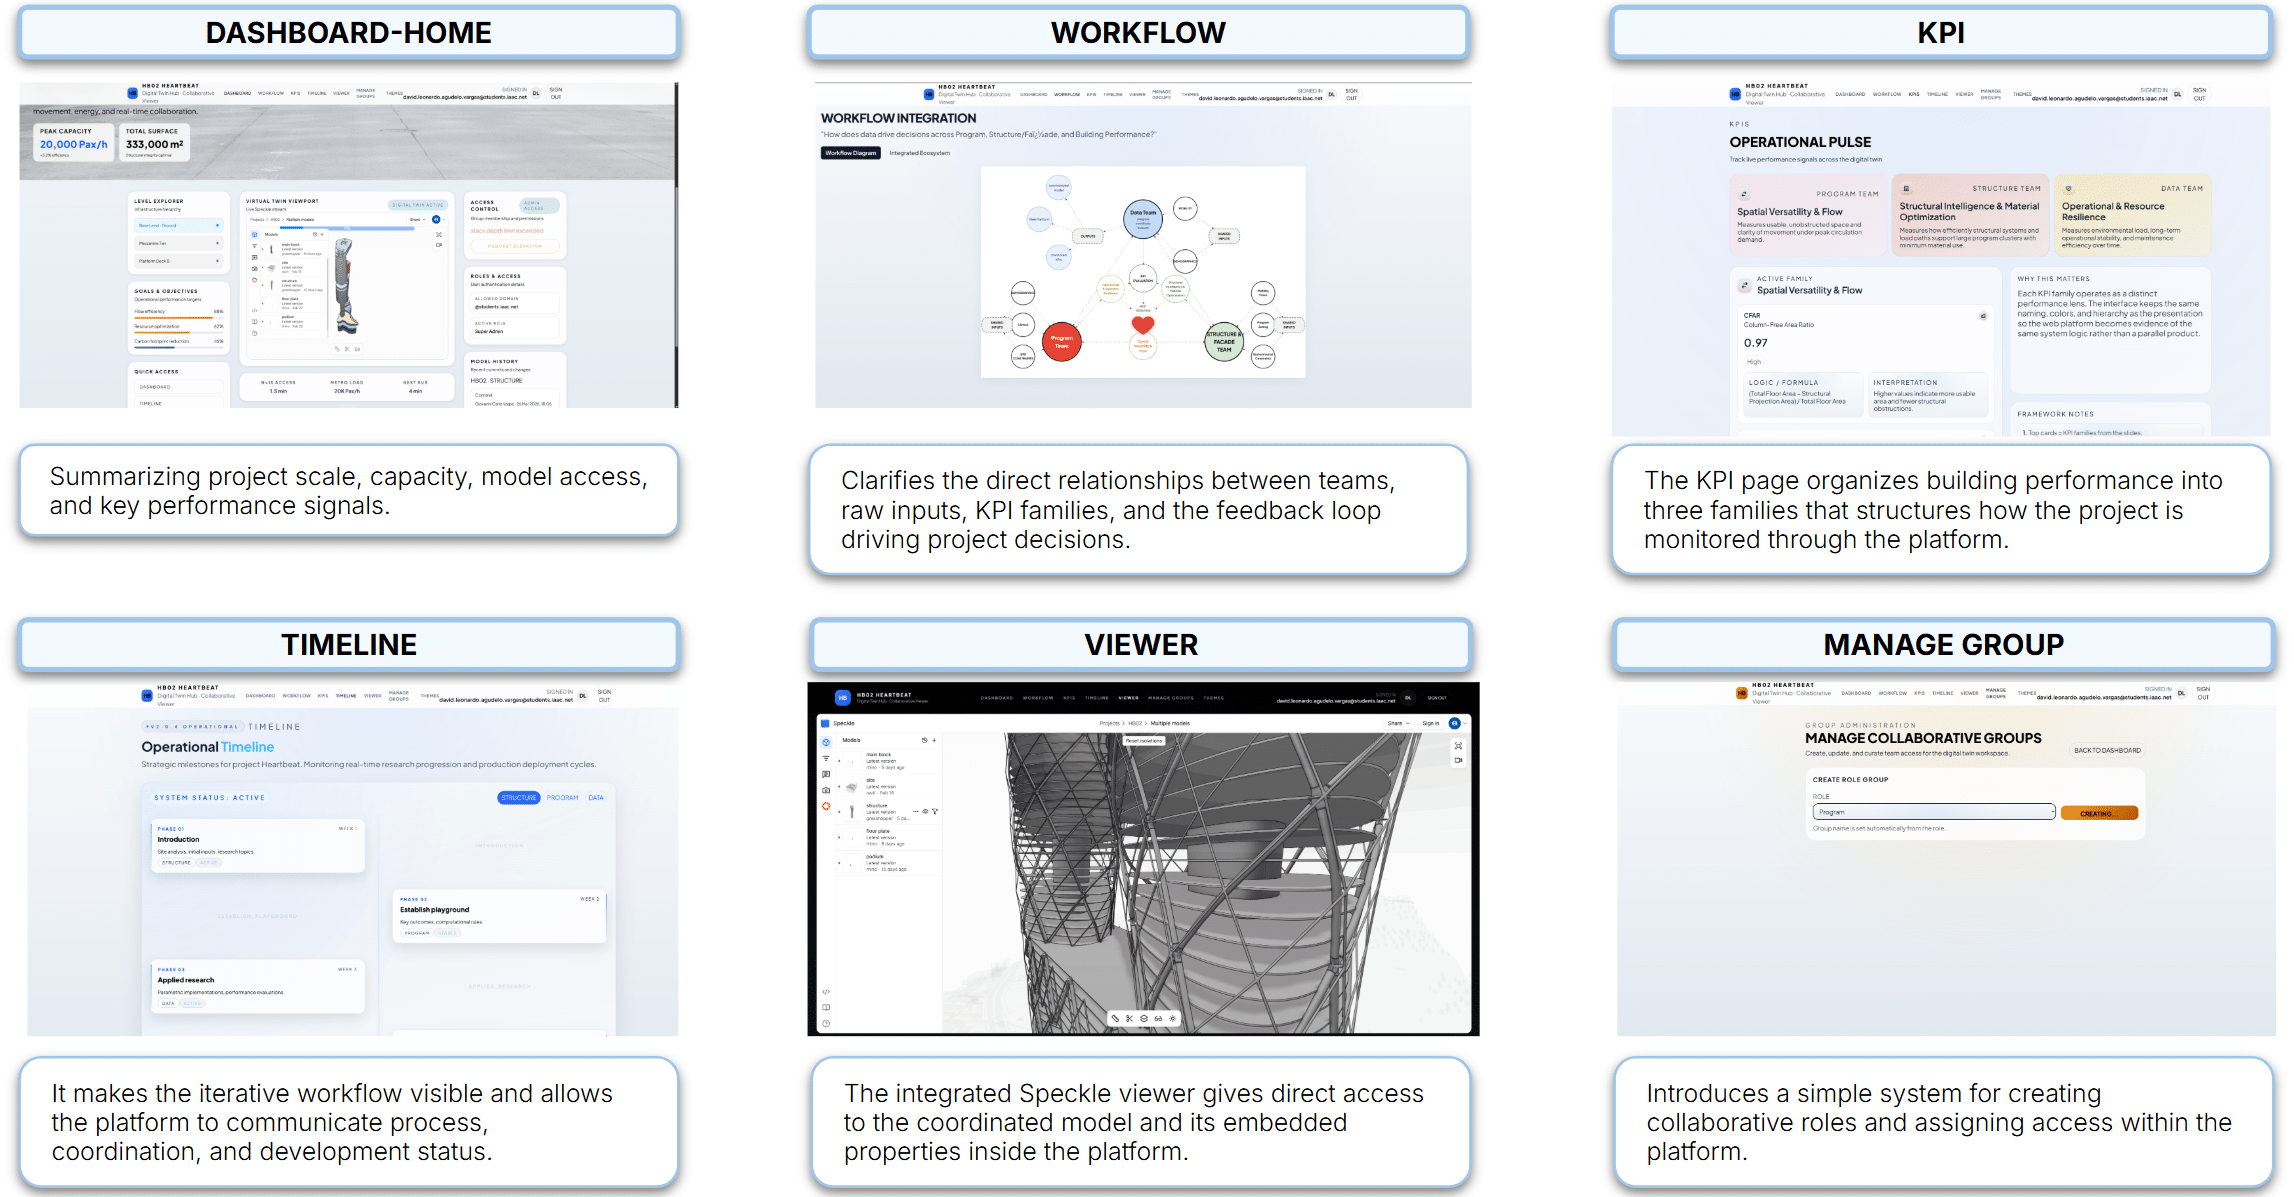
It gives the project team one shared environment to read performance, access model data, and track the evolution of HB02.
5.2 Team Coordination and Model Integration
The dashboard acted as the primary interface for interdisciplinary collaboration:
- Data Pipeline: Our team of three managed the flow of information from raw inputs (site constraints and mobility flows) to automation outputs like KPI analysis.
- Visual Coordination: The integrated Speckle viewer provided a coordinated 3D model with embedded properties, allowing the Structure/Facade team to verify load paths and the Program team to check transit adjacency.
- Process Transparency: A project timeline within the dashboard made the iterative workflow visible, documenting every stage of development from initial concept to the final performance model.
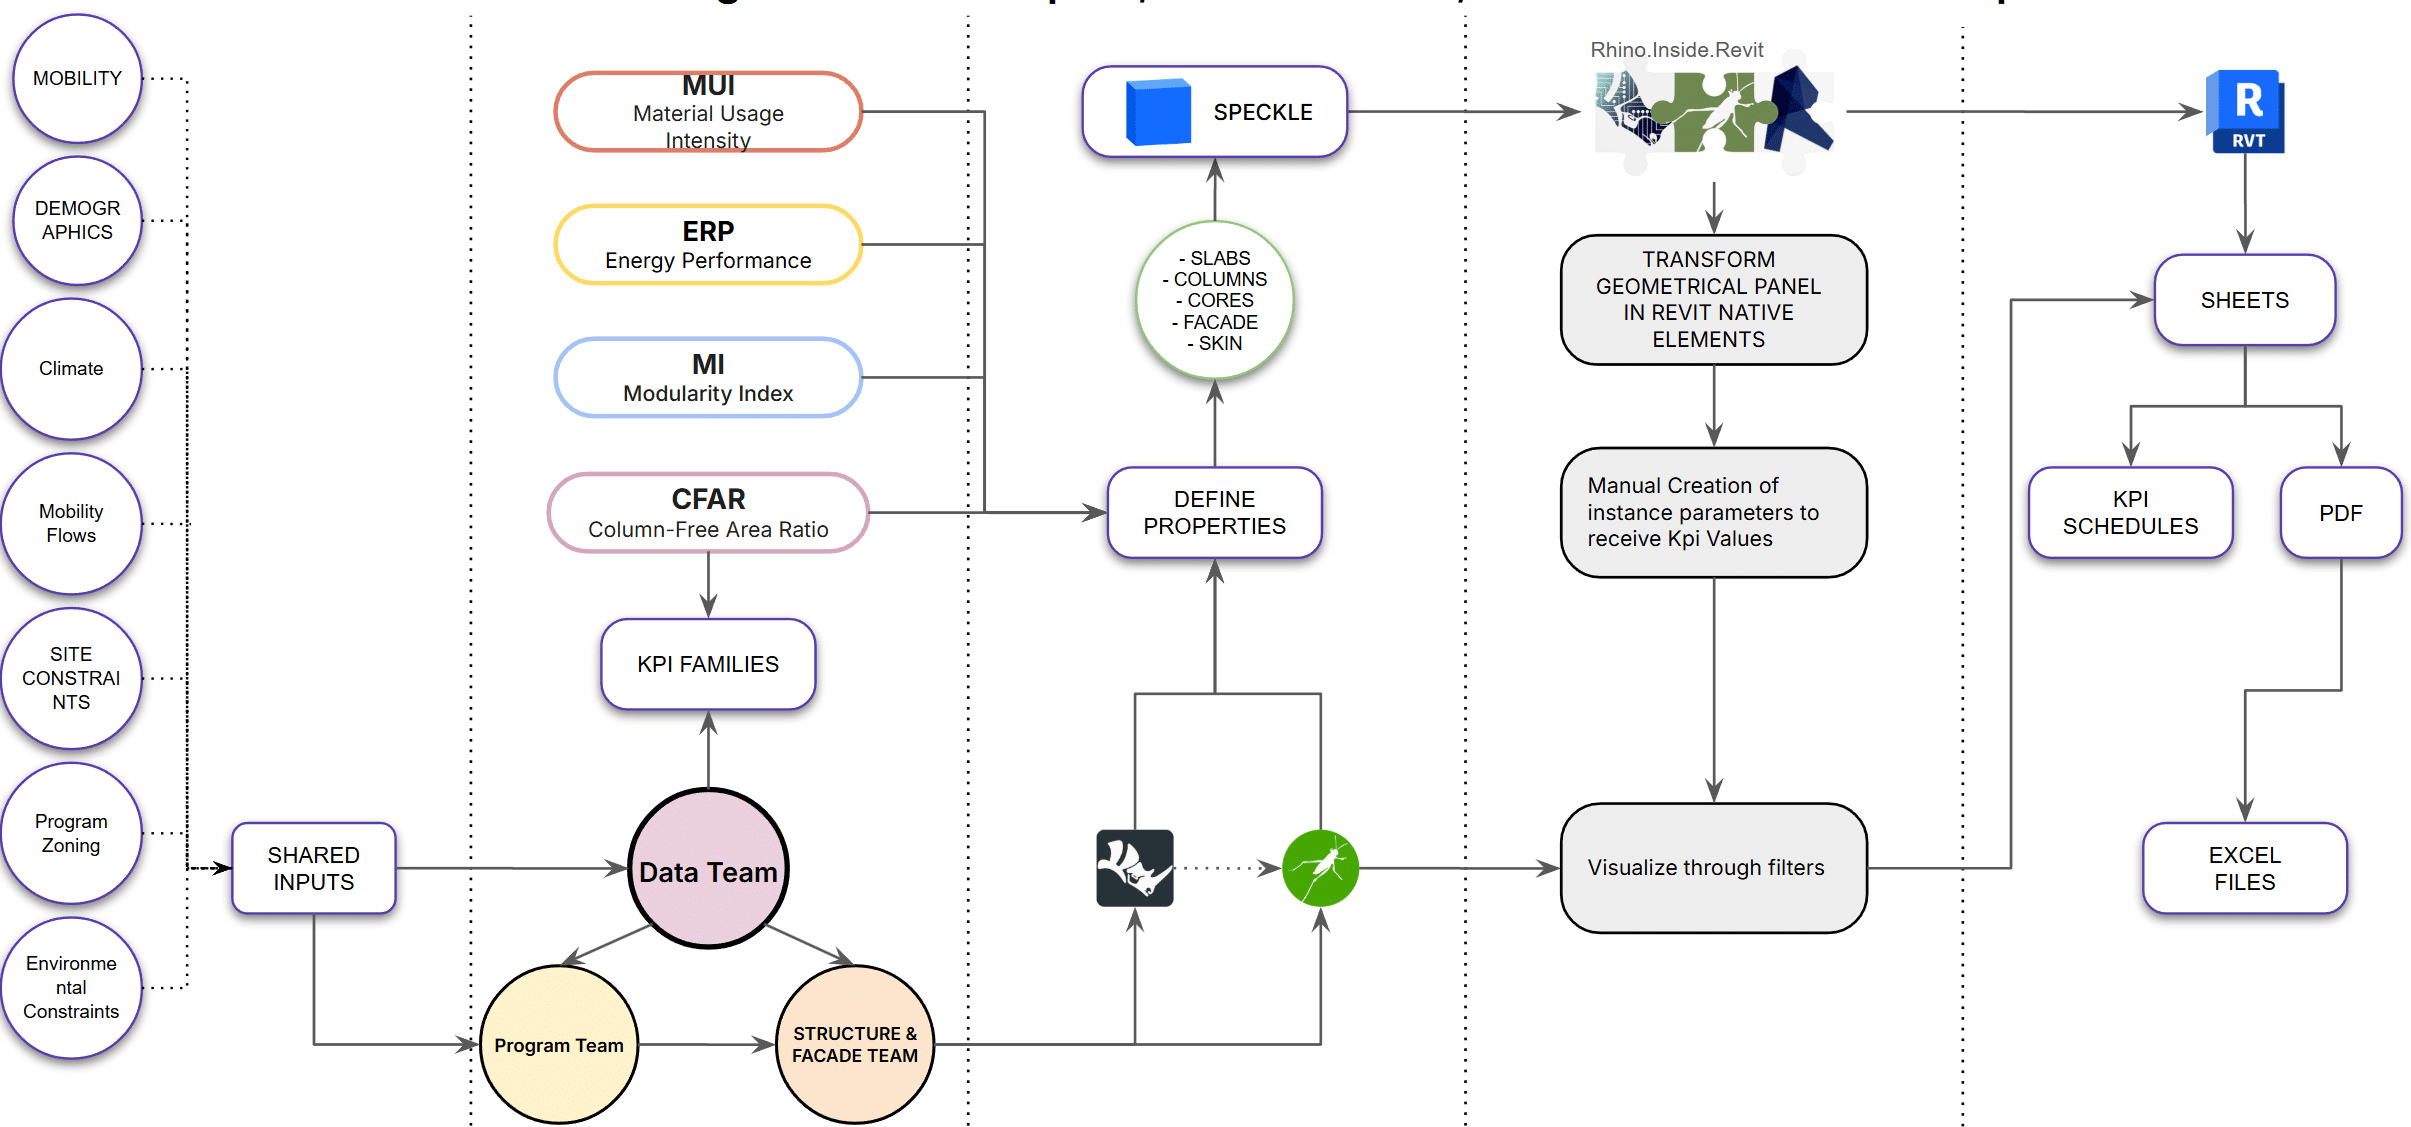
5.3 Technical Stack
To achieve this level of automation, we utilized a robust suite of tools:
- Rhino.Inside.Revit: For seamless geometry transfer between architectural platforms and KPI calculation.
- Speckle: For cloud-based data hosting and real-time version control.
- Excel & Power BI/Web Dashboards: To visualize the KPI results in a format accessible to all stakeholders.
By moving away from static reports and into this live environment, our group ensured that HB02 remained a truly optimized “Vertical Machine,” capable of adapting its form to meet the rigorous demands of 153,000 daily travelers.
6. Architectural Synthesis
6.1 Form, Structure, and Interface
What makes HB02 unique is that its form emerges from its function. The “Skeleton” does not impose a rigid order; instead, it follows the people. Where arteries converge and forces concentrate, the exoskeleton thickens; where flow disperses, it lightens.
The “Skin” provides a final layer of intelligence, opening up with transparency where public life pulses and closing to protect infrastructure like server farms and waste management systems.
Hyperbuilding 02 is more than a transit hub; it is a proof of concept for a data-integrated future. By combining computational design with biological metaphors, our team created a structure that doesn’t just exist in the city—it keeps the city alive.