
Understanding and analysing the existing Healthcare system of Barcelona with the help of open datasets available. This further helps us to understand the robustness, need and requirement to fill the gaps in the system if any with respect to their typologies and location as per districts
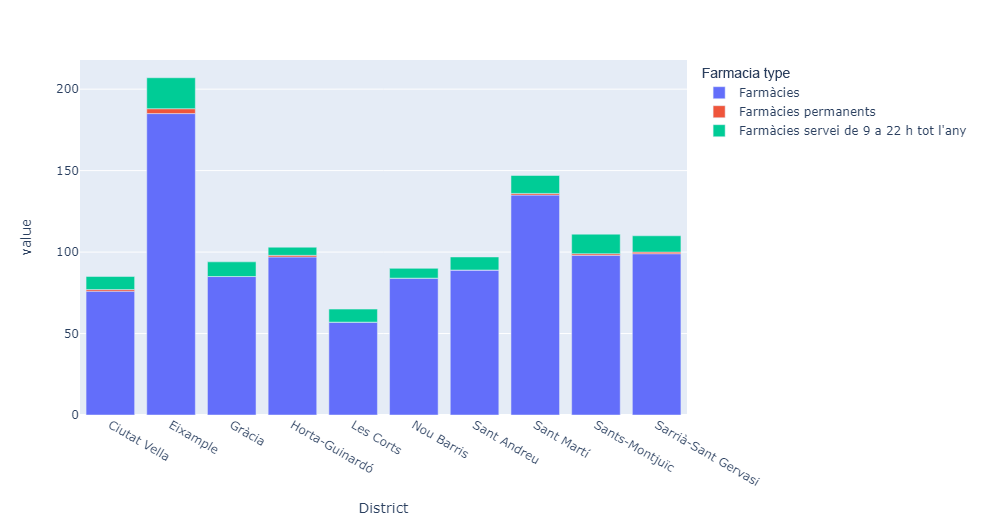
Step 1: Documenting the distribution of different types of farmacias located across various disricts of Barcelona through bar graph .
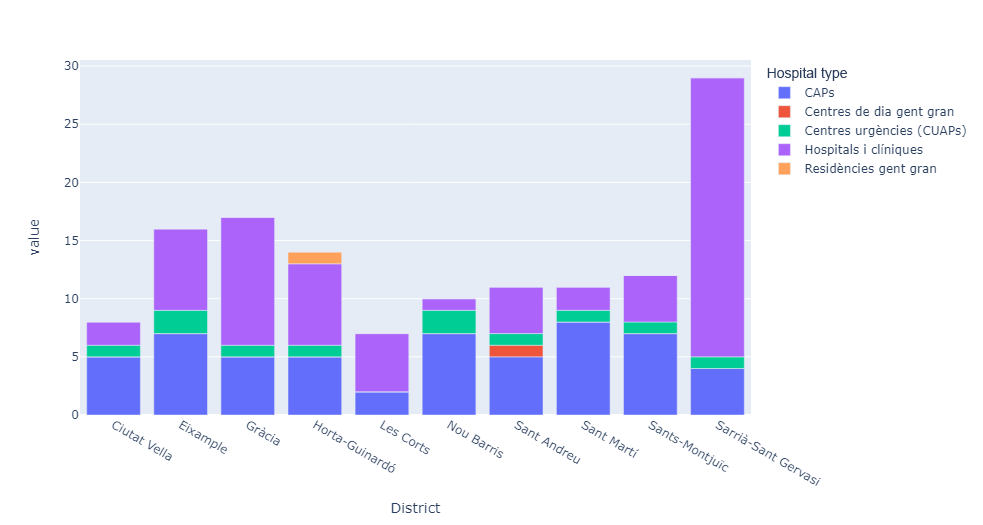
Step 2: Documenting the distribution of different types of hospitals located across various disricts of Barcelona through bar graph.
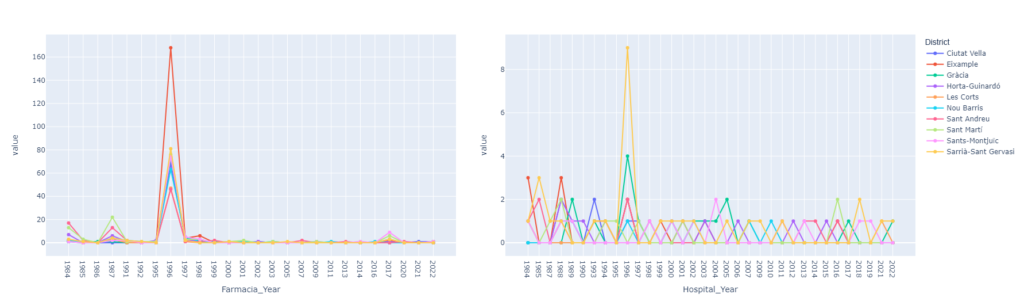
Step 3: Understanding the distribution of these hospitals and farmacias over the years from 1983 to 2022
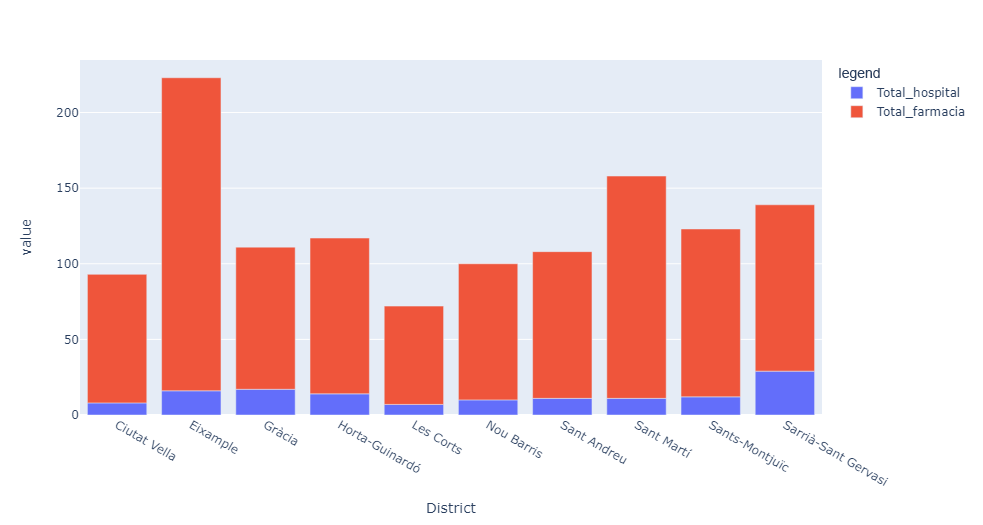
Step 4: Creating a two dedicated dashboards asper districts for Farmacias and Hospitals respectively.
Sources:
Open Data BCN
