
This research project aims to create a personal sense-making tool with an intent to facilitate data driven self reflection, analysis and understanding of our digital consumption. The tool extracts and categorizes the textual information and then uses AR visualization to establish an experiential understanding of the same. Augmented reality facilitates a deeper understanding and enhanced engagement of such complex data by contextualizing, and providing a sense of scale, depth, and perspective. Through this project, the relationship between a user, their data and their everyday physical space is explored, as the unseen digital layer of the user’s reality is made ‘tangible’ as a layer on his existing physical reality.
Video documentation of the tool demo recording, the usage of it and the research framework
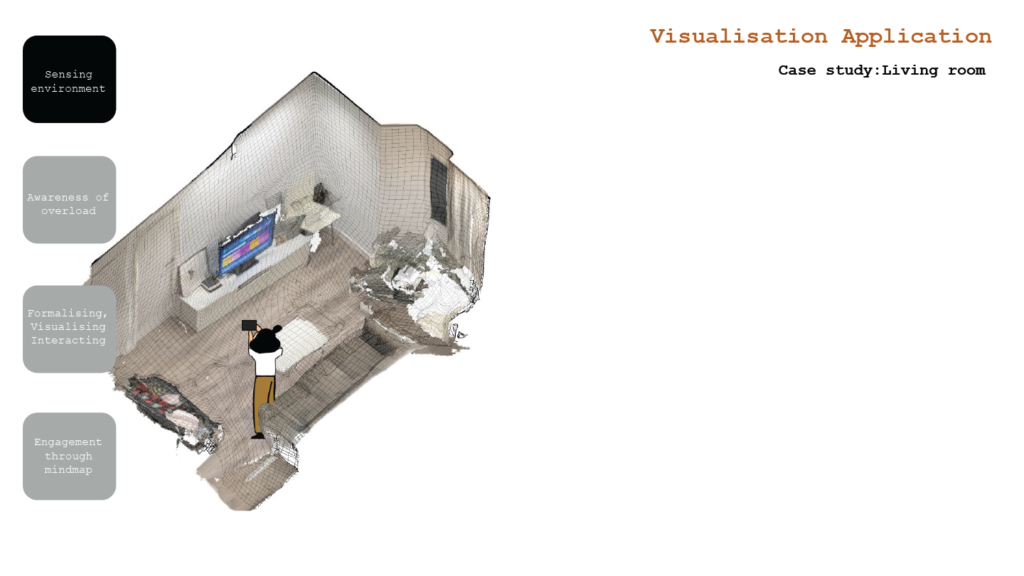
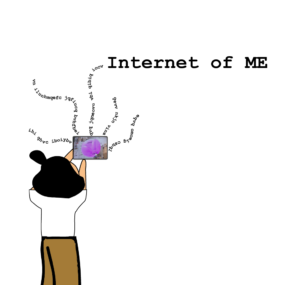
As a case study, Internet of me tool explores my relationship with my physical space and data I consumed over a week – by making it ‘tangible’, interactable, experiential and exploratory.
__________________________________________________________________________________________________________________________________________________________________
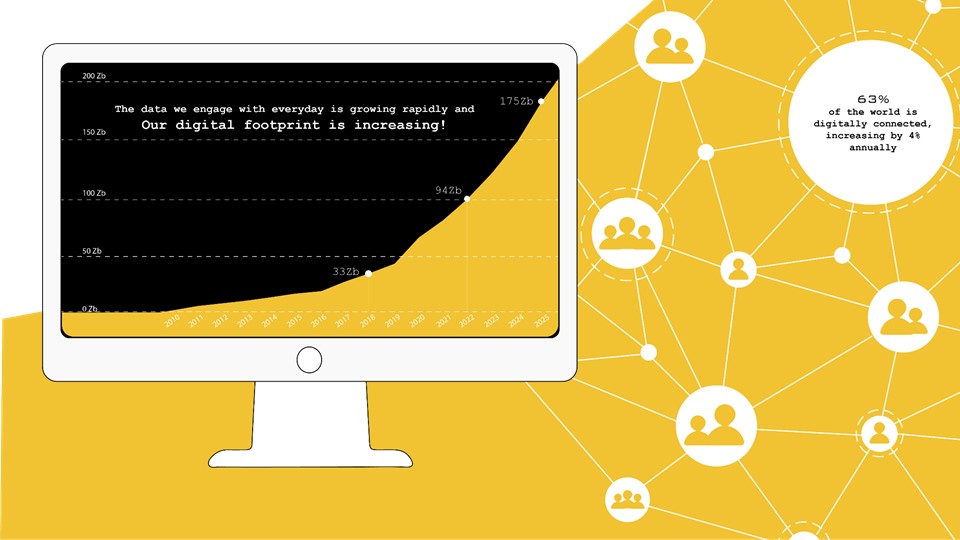
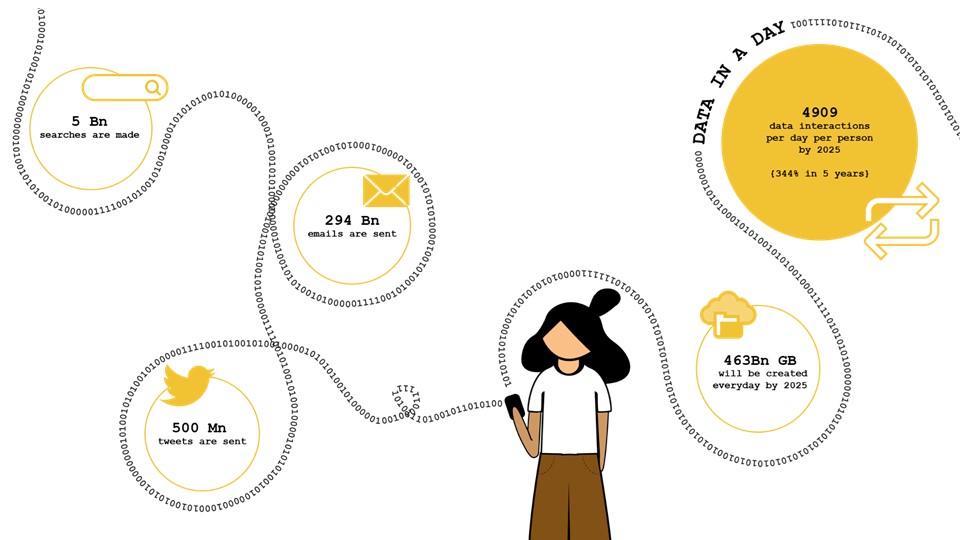
With the cyber-physical convergence, the fast expansion of the Internet, and tighter interactions between humans and their devices, The data we engage with everyday is growing rapidly, and our digital footprint is increasing at a very fast pace. Volume of information created, copied, captured, and consumed worldwide went from 33 zettabytes in 2018 to an expected 175 zettabytes in 2051. By 2025, 463Bn GB will be created everyday. We will each have nearly 5000 online data interactions per day, which is a 300% increase in just 5 years.
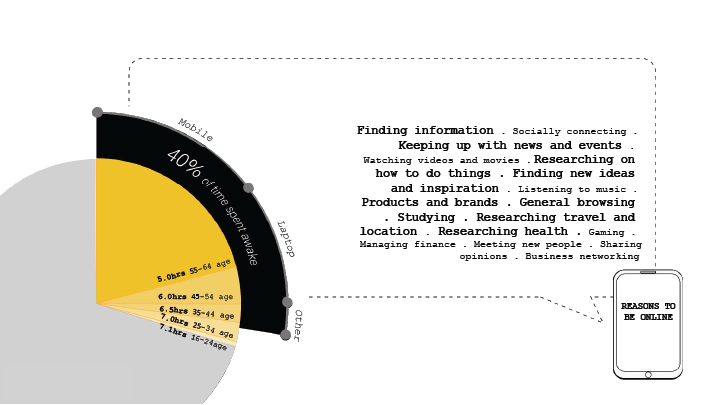
We spend 40% of our daily wake hours connected online. And out of the many things we engage with, a majority of it is new information for us that we have to understand, retain and keep up with.
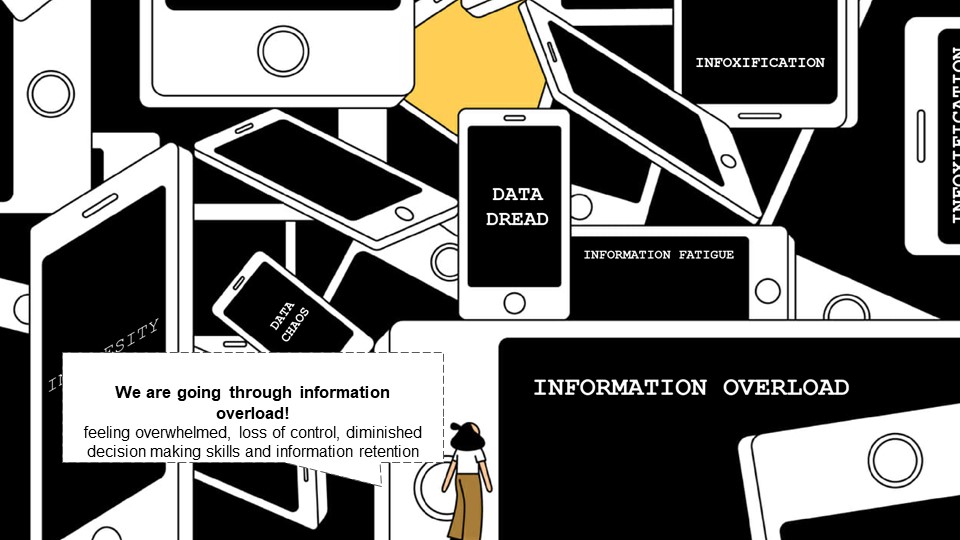
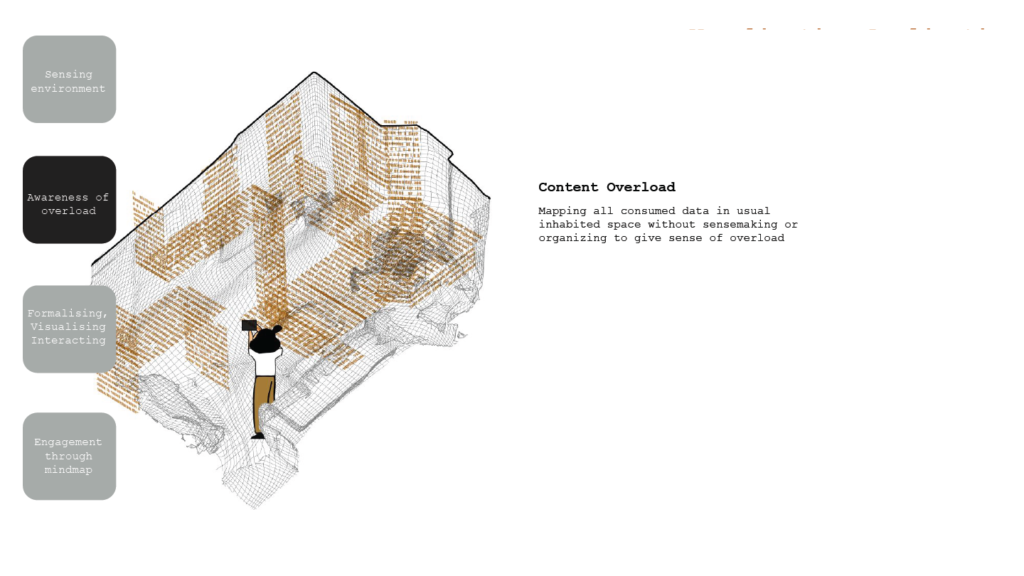
Information Overload
As a society, we are thus experiencing information overload. This contributes to daily stress and impacts our everyday cognitive processes. It is affecting our mental health.
Our digital footprint is not only linked to social media but also to our browsing patterns and other interactions. There are 4 pressure points when people and online systems interact which cause the overload : the attention economy – due to which we are bombarded withy new information in short spans. ; choice architectures – which decides and manipulates the choices we make for consumption; online algorithmic curation – which taps into our behaviour to curate content that we cant control and therefore may be accessed to irrelevant information; And us being prone to misinformation. The limitations of attention resources and need/demand for algorithmic curation of information has created a relationship between platforms and users that is asymmetric. There is an Imbalanced relationship between platforms and users! while they understand our behaviour and choices, we don’t have access or understanding of it.
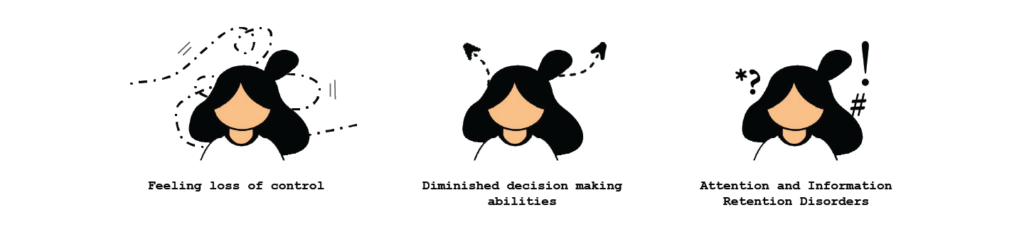
We are feeling a loss of control of this digital identity. Our retention and decision making abilities have diminished because of this overabundance of information and the choices we have to make.
Digital Wellness
‘Our common agenda’ – global digital compact by UN has declared greater focus on working towards greater internet accessibility, inclusivity, literacy and privacy. 1 in 4 People have made changes to their technology use to gain a greater sense of digital wellness. As digital wellbeing gains traction, people will increasingly examine their digital activities. We are becoming more curious about the information we consume.
Information Sense-making
The idea that many things we consume that we are interested in knowing, retaining and searching back to when we want – not directly straightforward/easy. One way to address some of the imbalance is with interventions that empower users to gain some control over their digital environments – by boosting their information literacy and their cognitive sense- making .Our current relationship with information is measured in quantity and time.
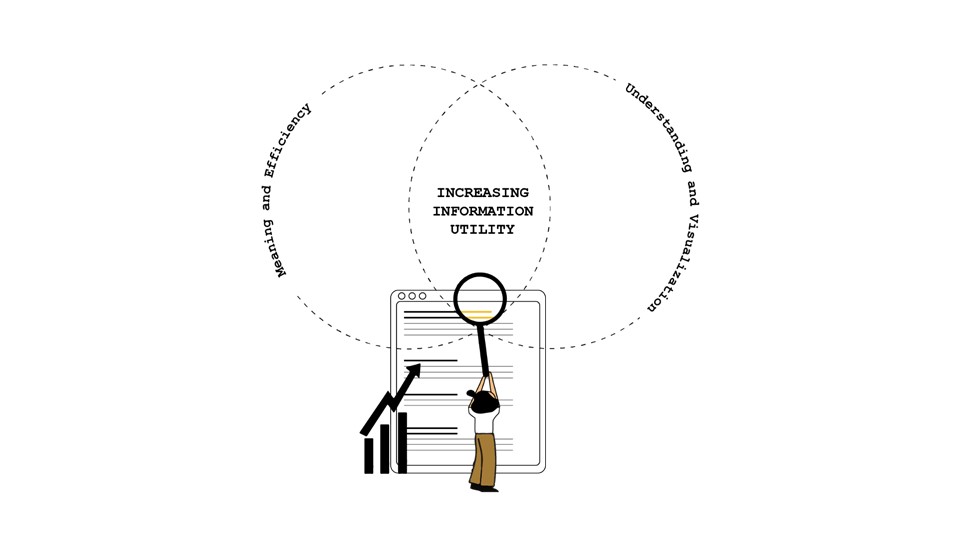
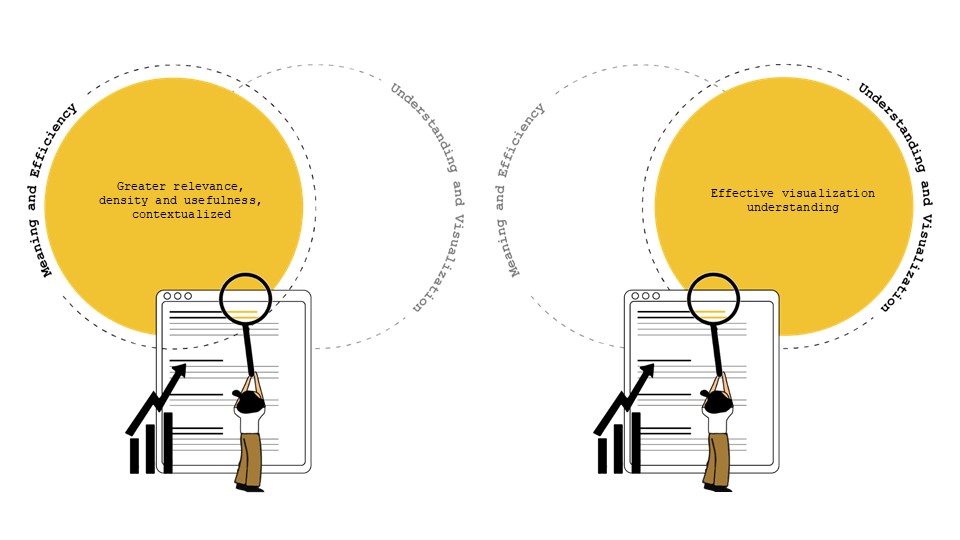
There is a need for better comprehension and understanding the information we consume because the inability to apply it effectively is knowledge simply lost. How do we improve information utility?
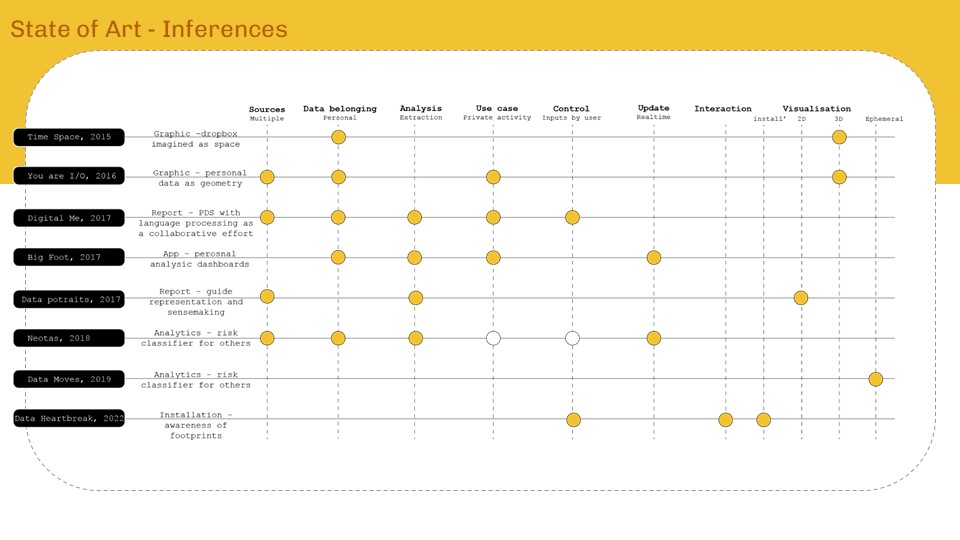
State of Art
Projects as state of art were referenced and compared based on some parameters to draw out conclusions and take aways for the project.
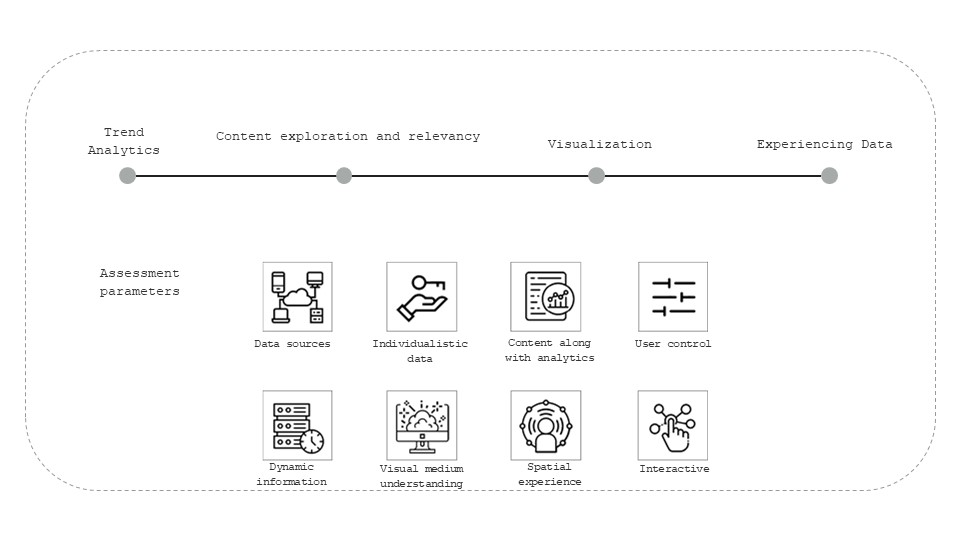
Proposed workflows of collection + Analysis are usually limited to a dashboards, Data visualization wrt to spatial context is less explored and Potential of AR as an experience tool for personal data visualization is not common. Looking at the Issues regarding Information overload, current relationship scenario between society and platforms, its crucial to have better relationships with technology, user-centric systems of data organizing and sensemaking incorporated into our daily lives. Augmented Reality was chosen as a medium to develop the tool as it enables dynamic data visualizations which can be personalized and customized for the user. As everyone has a specific way of comprehension which varies in terms of visual. textual or audio, AR is a medium that makes this possible. Augmented reality facilitates a deeper understanding and enhanced engagement of such complex data by contextualizing, and providing a sense of scale, depth, and perspective by making creating a phygital landscape.

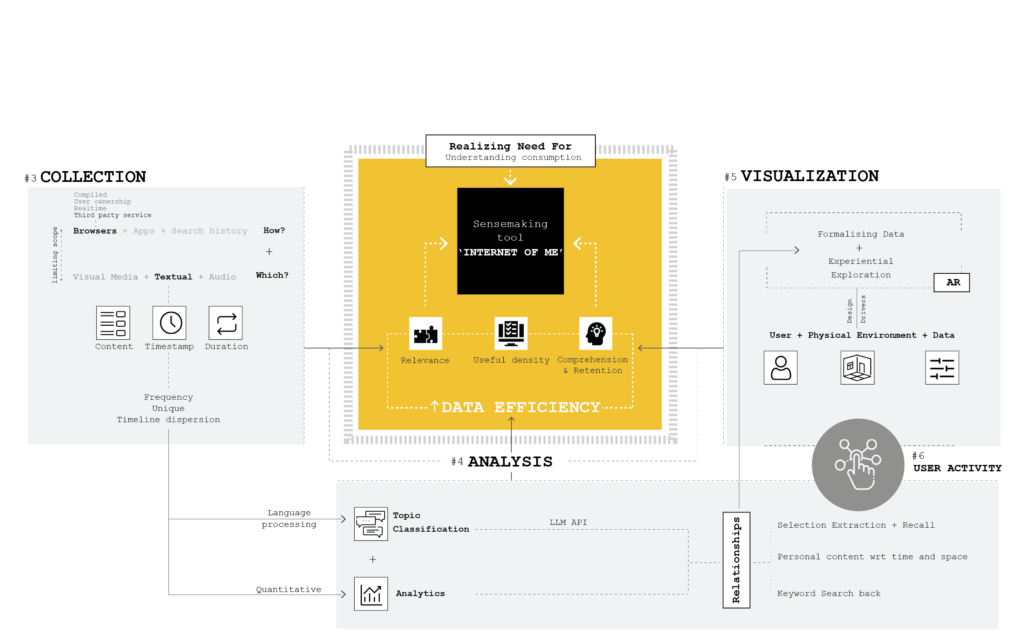
Methodology
The project methodology is considering the research project in 3 parts and focuses on the workflow of user data collection, analysis, and visualization. Working within ‘The European Data Strategy’, 2020 to comply with privacy and accessibility terms, The tool uses browser extensions to extract the geotagged and timestamped history. Natural language processing models are used to categorize content consumed into meaningful clusters, while graph networks understand relationships and analytics. Experiential interaction through gestures, navigation, and selection facilitate keyword search back, interconnectivity and identification of useful information for extraction.
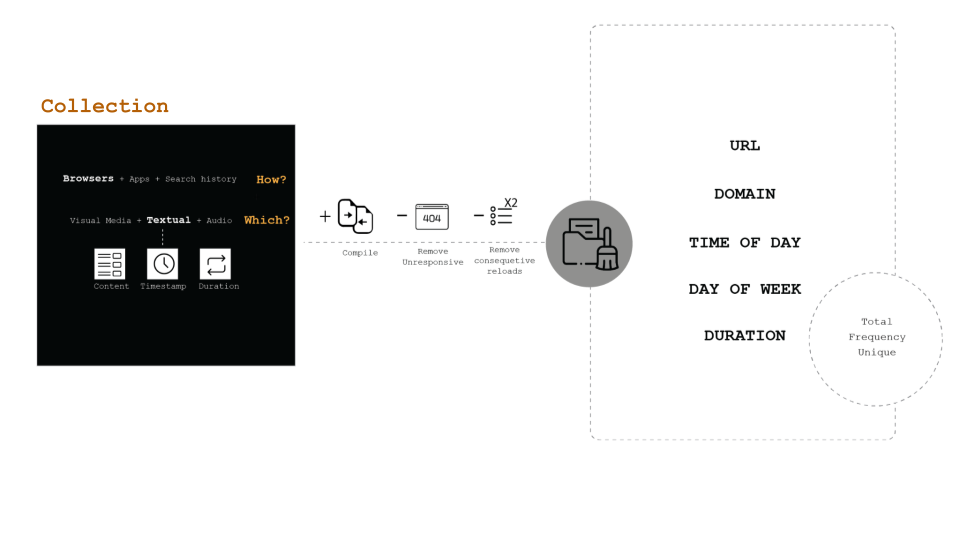
Data Collection
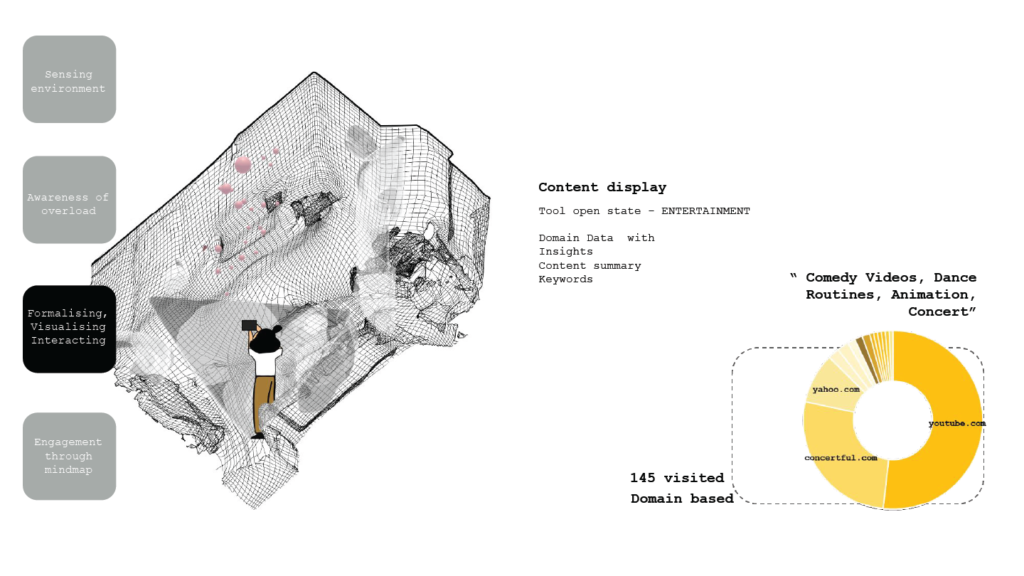
For the scope of the project, The extracted user information was limited to textual content through browser history over a period of a week. The extraction of visited URLs were done through third party extensions across all user devices and then combined and cleaned to extract count, frequency and values of URL, Domains, Time of Day, Day of Week and the duration relating to the consumed text
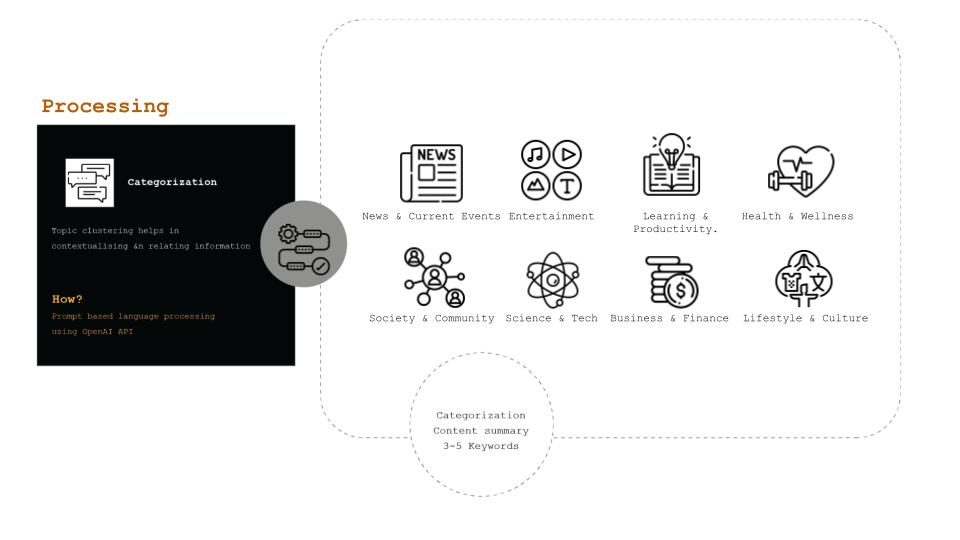
Data Processing
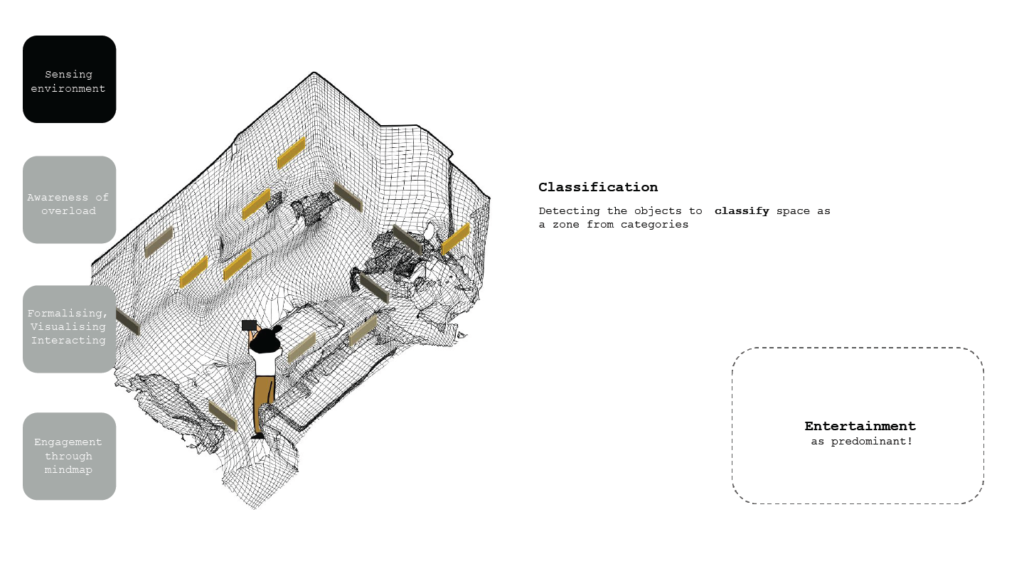
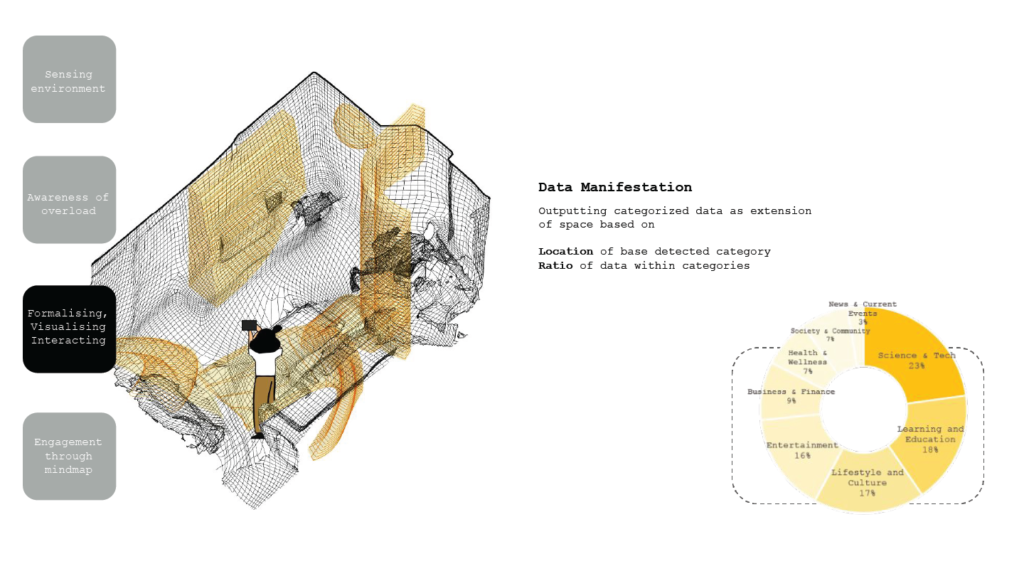
Humans understand better when the information is classified into categories that are familiar and based on our everyday activities. In this case-study 8 categories are defined. Using an LLM API, All the visited URL’s contents were categorized into the defined clusters and keywords.
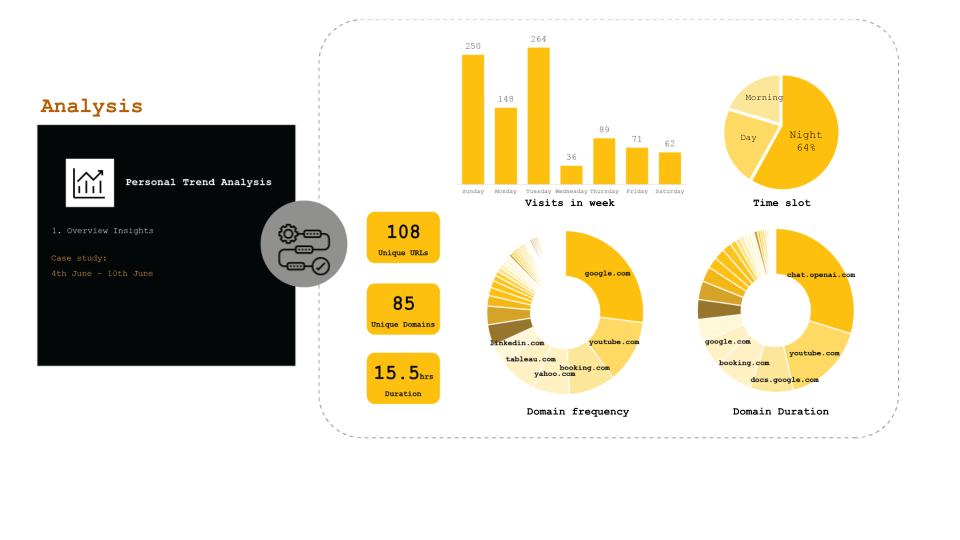
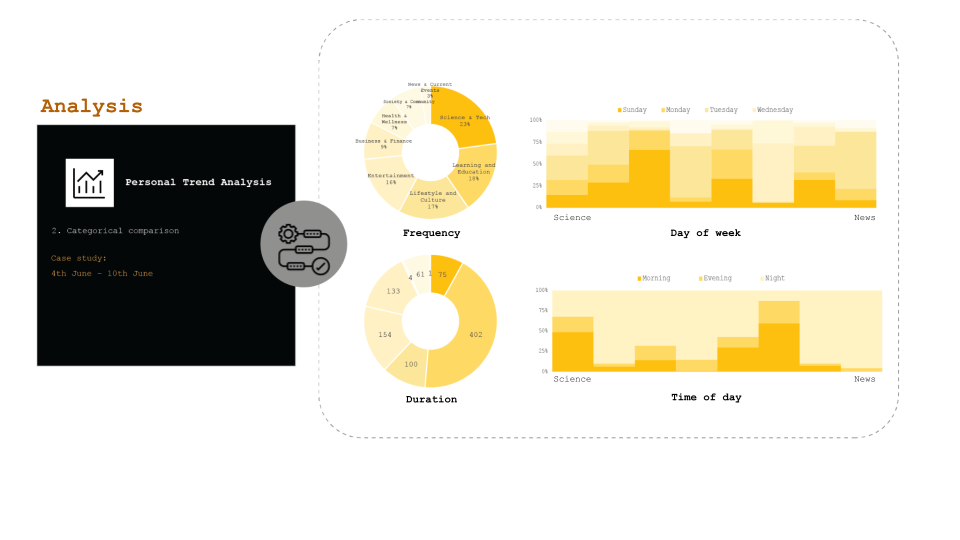
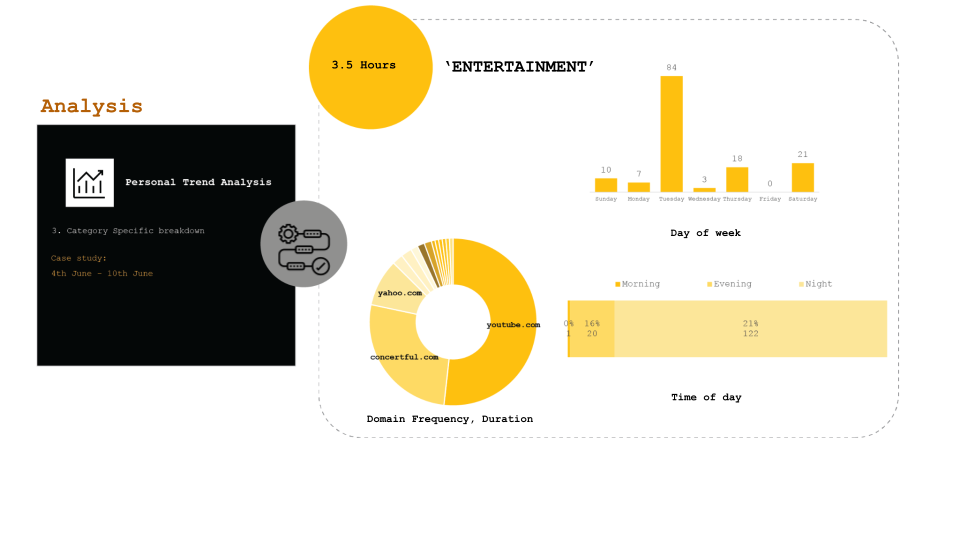
Data Analysis
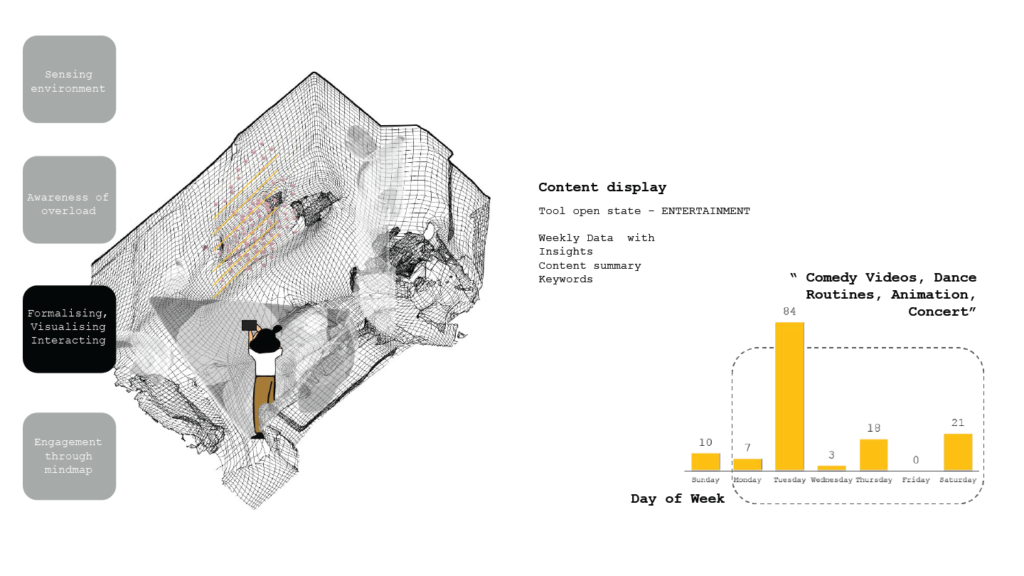
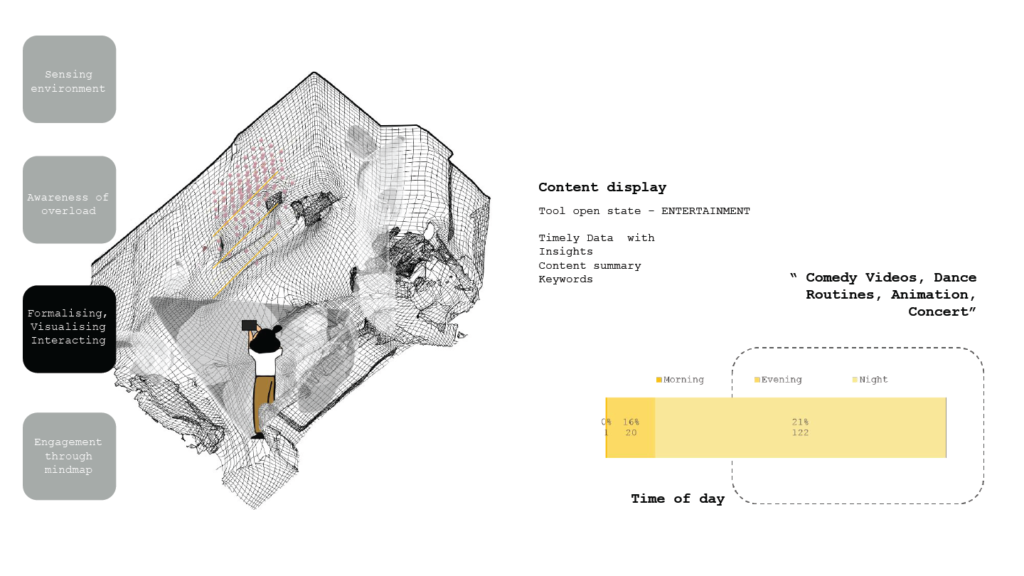
The content was analyzed in 3 layers- Overview insights and statistics of overall consumption, Comparison across the categories and Category specific breakdown. All the information was analyzed with respect to time of day, day of week, time spent, number of visits as well the source domains.
Visualization
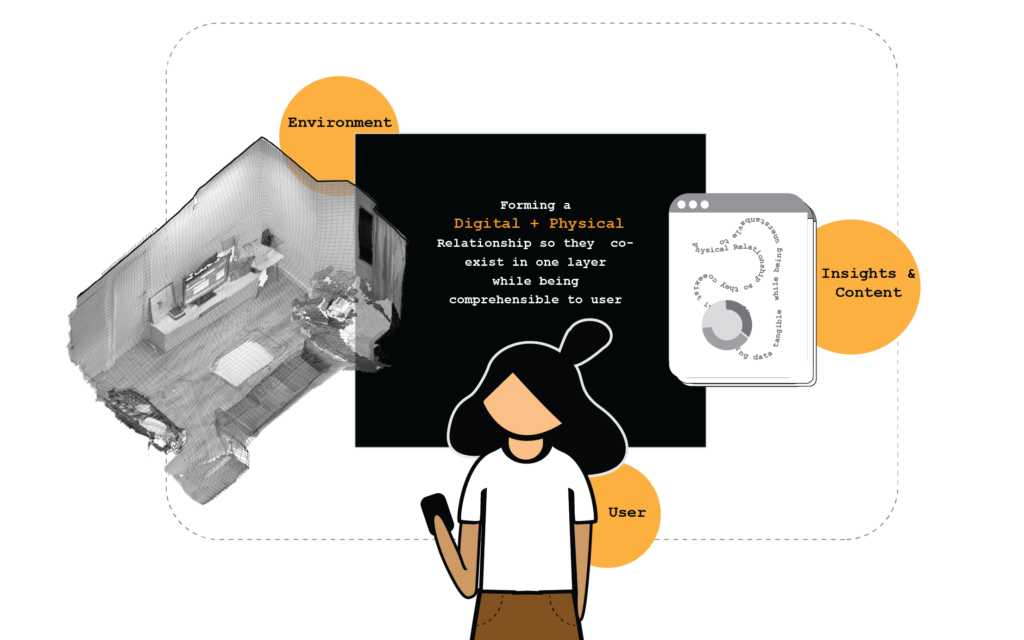
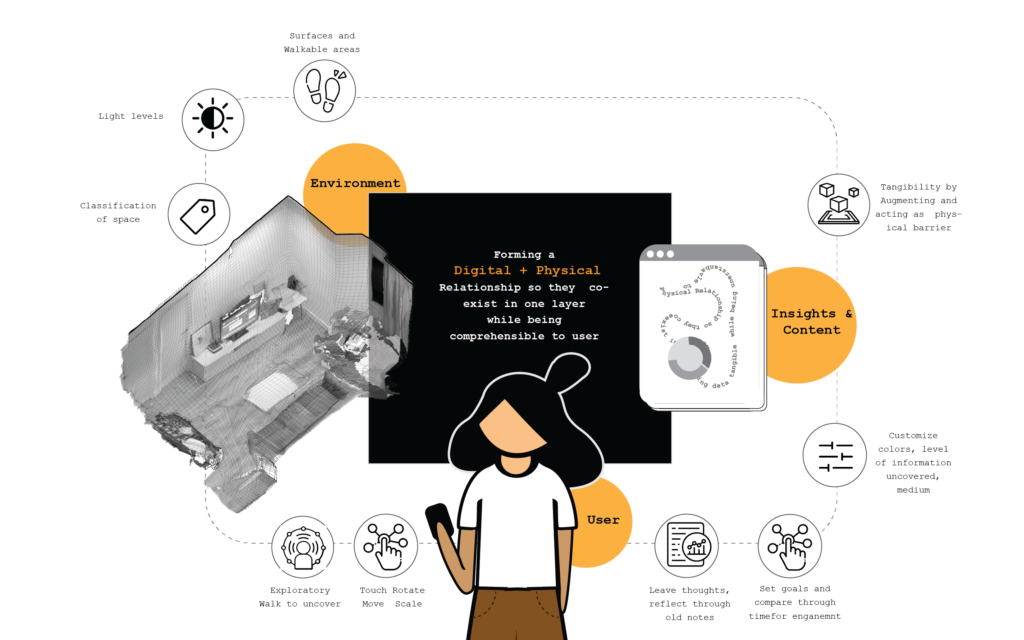
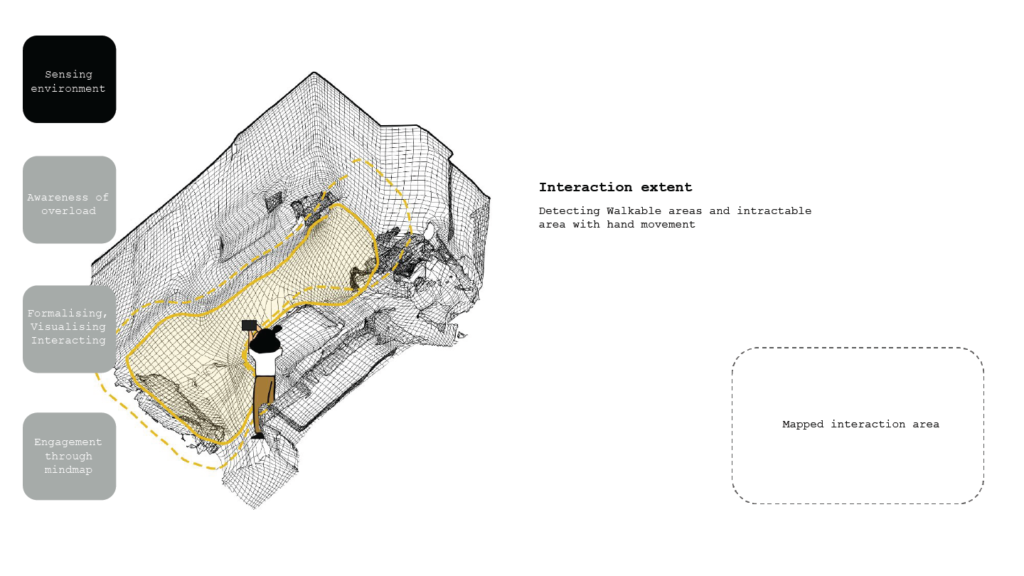
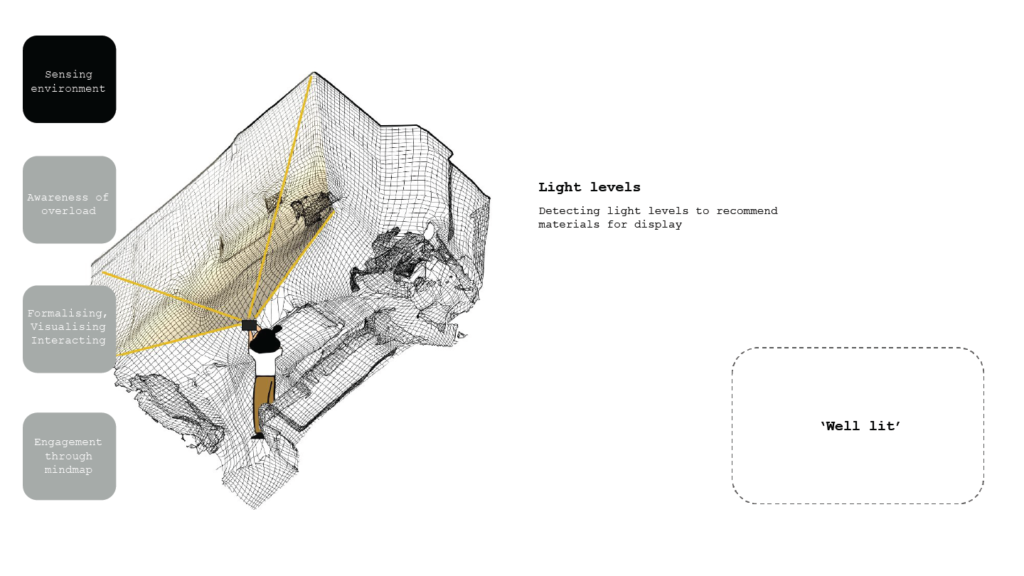
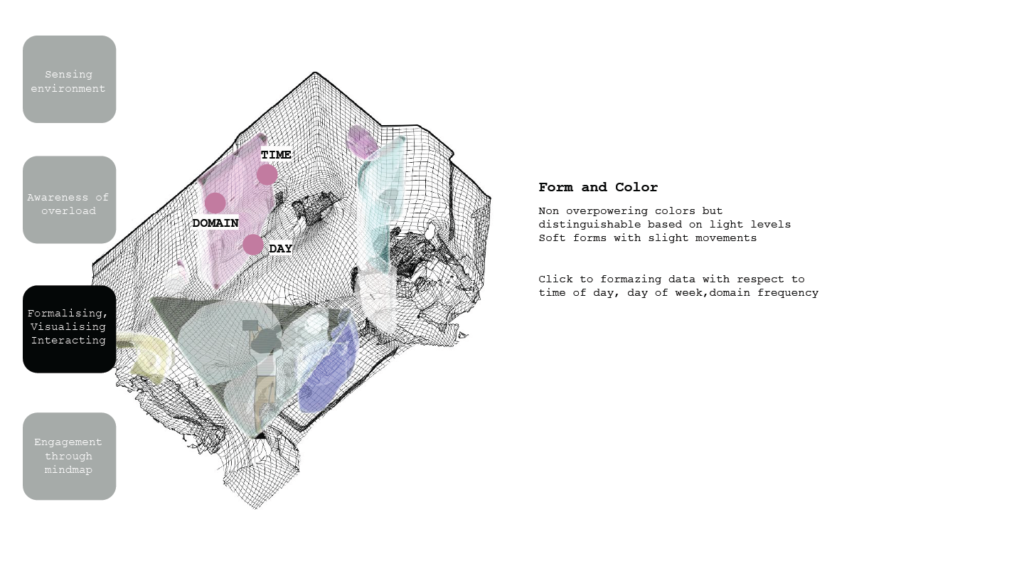
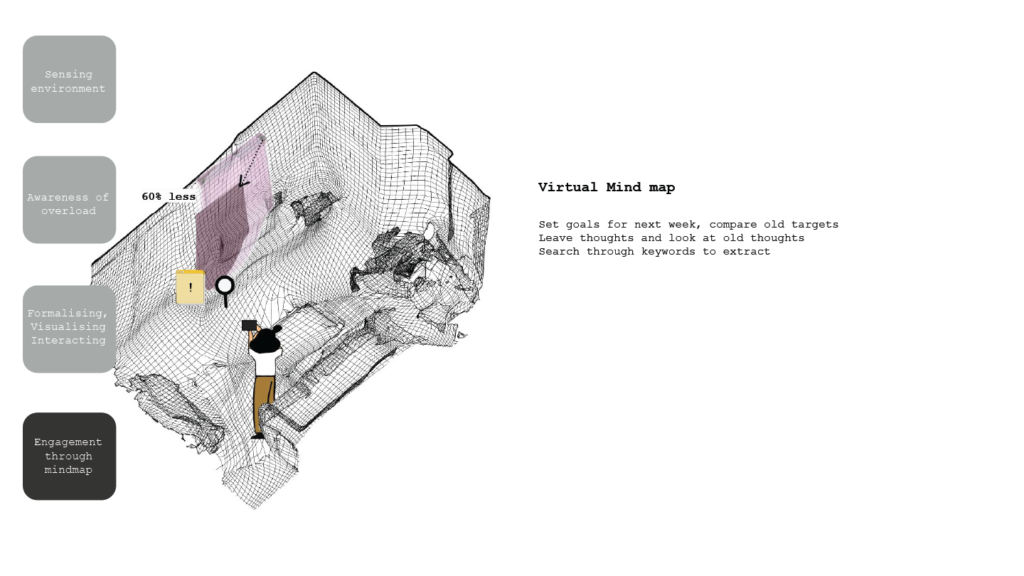
The relationship between the environment, the content and user is mapped out in a way that all the content is evident and comprehensible to the user in an exploratory manner while the physical and digital layers co-exist. Interactions between user-space-visualizations are based on below set parameters and the user is allowed to customize his experience in terms of visuals as well as the amount of information uncovered at a particular moment. Features like light levels, activity typology of the space sets the base for the output. The visualization is mapped around the relevant artifacts in that space with respect to the time of the day, day of the week or the source of information. This can be viewed as a cumulative cluster or as individual categories as you zoom out. You can leave notes and insights in a space and revisit them for reference. By experiencing the relationship between content and related patterns, you can set perimeters and goals for the next time you spend time on the internet.
Application Development
The video inserted at top of the blog includes the demo application recording.
Sources:
- Potentially negative effects of internet use report by Panel for the Future of Science | European Parliamentary Research Service, 2020
- Eu Data strategy, 2020
- Global Connectivity report 2022, International Telecommunication Union under UN
- OpenText report, March 2022- Survey of 27,000 consumers globally
- Data age 2025 by IDC
- Technology and Democracy report by UN, 2022
- Digital Footprint Awareness 2020 report compiled after the European Digital Footprint Conference 2019
- Google ‘Digital Wellbeing Survey 2019
- ‘Our common agenda – global digital compact’ report of UN secretary general, 2021
- Digital wellbeing report, 2021, Ithra
- Rose Wong, Digital Illustrations
