
Project Focus

For our Graph Machine Learning project, wanted to look at the city of Kyoto and Tourism Behavior around Cherry blossom patterns. Specifically, we set out to find out how cherry blossom patterns might affect the behavior and walking paths of tourists within the city.
Data Sets
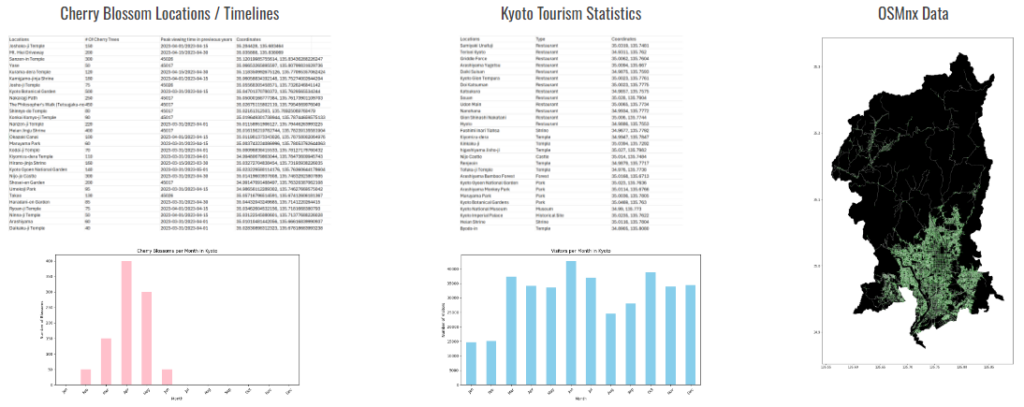
We started by collecting our data sets to be used for evaluation and model training. We first collected information on Cherry blossoms within Kyoto – Where they bloom, when and how many trees in specific locations. Next, tourism activity – how many tourists into Kyoto per month, popular locations, and types of frequent tourism activities. Finally, we used OSMnx data, to collect the Nodes and Edges within Kyoto.
Kyoto Plots
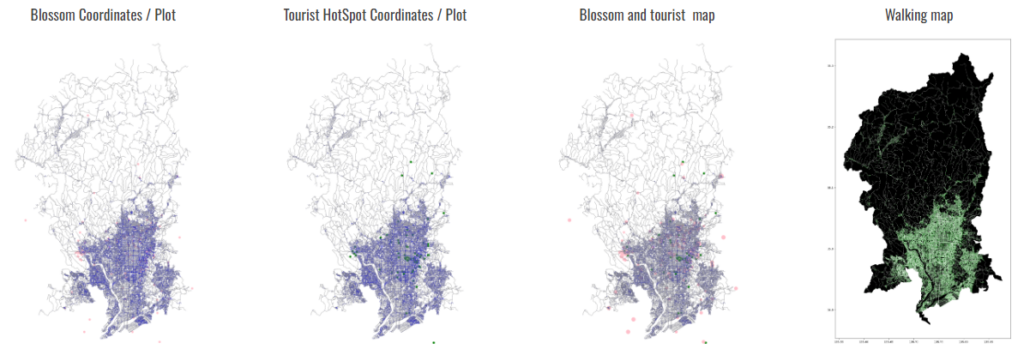
With our Data Sets, we started with simple plots. Identifying node locations around our features as well as walking paths throughout the city.
Cherry Blossom Attributes
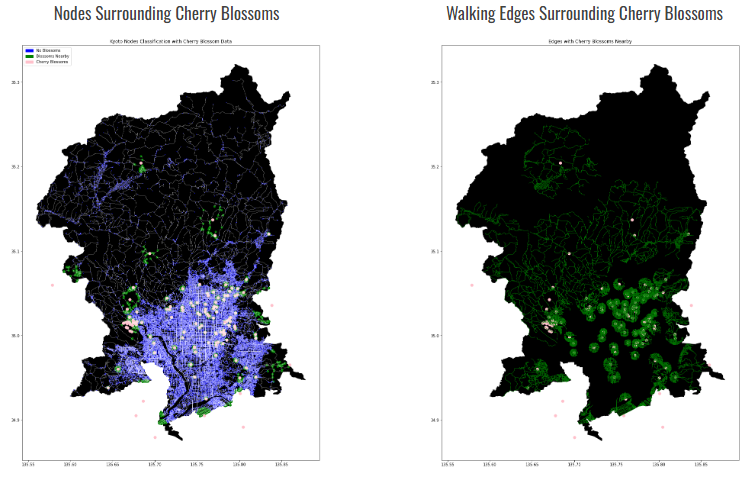
Next, we were able to begin assigning attributes to both nodes and edges within our Kyoto map. First, we identify nodes within the city that are located close to our cherry blossom locations, as well as edges that surround those locations.
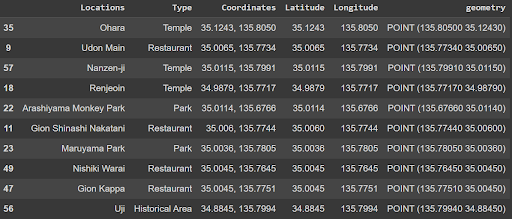
Tourist Attraction Attributes
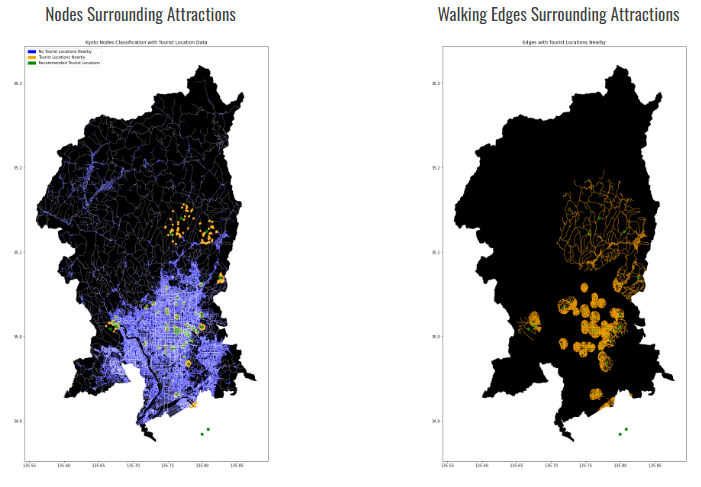
We could then repeat this process for popular tourist locations we had collected as well.
Kyoto OSMnX Features
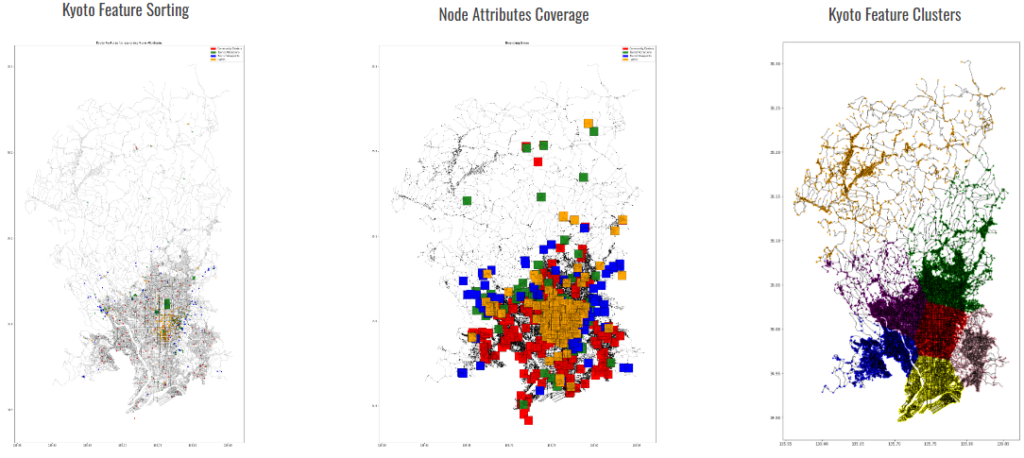
Also, using our OSMnx data, we can apply feature sorting attributes to our nodes. Using specific tourist location classes like hotels, viewpoints, and parks, we are able to set up feature cluster plots for different chosen Kyoto features.
DGL Creation
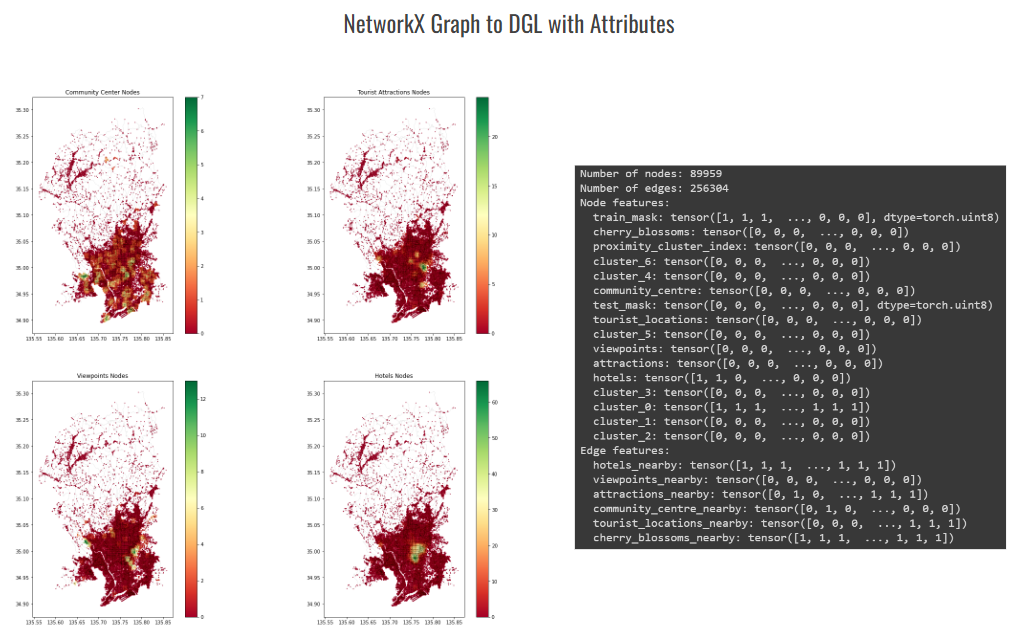
Once we have our attributes applied to our nodes and edges, we moved on to plotting these features as well as creating a DGL Bin file to use this information for our walking path prediction.
Walking Path Predictions
To create our path predictions, we first start by selecting 10 tourist hot spots around the city of Kyoto that we know are also located by Cherry blossom locations. We can then plot the optimal walking paths for tourists visiting the city. We can repeat this process for random locations or specific destinations to provide specific paths.
Challenges & Learnings
During the course of the class project we did run into several consistent challenges that provided interesting learning opportunities; First, we would often experience inconsistencies in the way Google Colab and Python would process our notebook. sometimes blocks of code would work as intended and the next day they would need to be built in a different manner. This along with having the challenge of adapting class provided notebooks to our specific needs presented the opportunity to learn how to accomplish similar goals in different approaches. This also fed into the last two points of finding the correct ways to not only read and display our data and findings, but produce something that could actually prove useful for predicting optimal walking paths.
