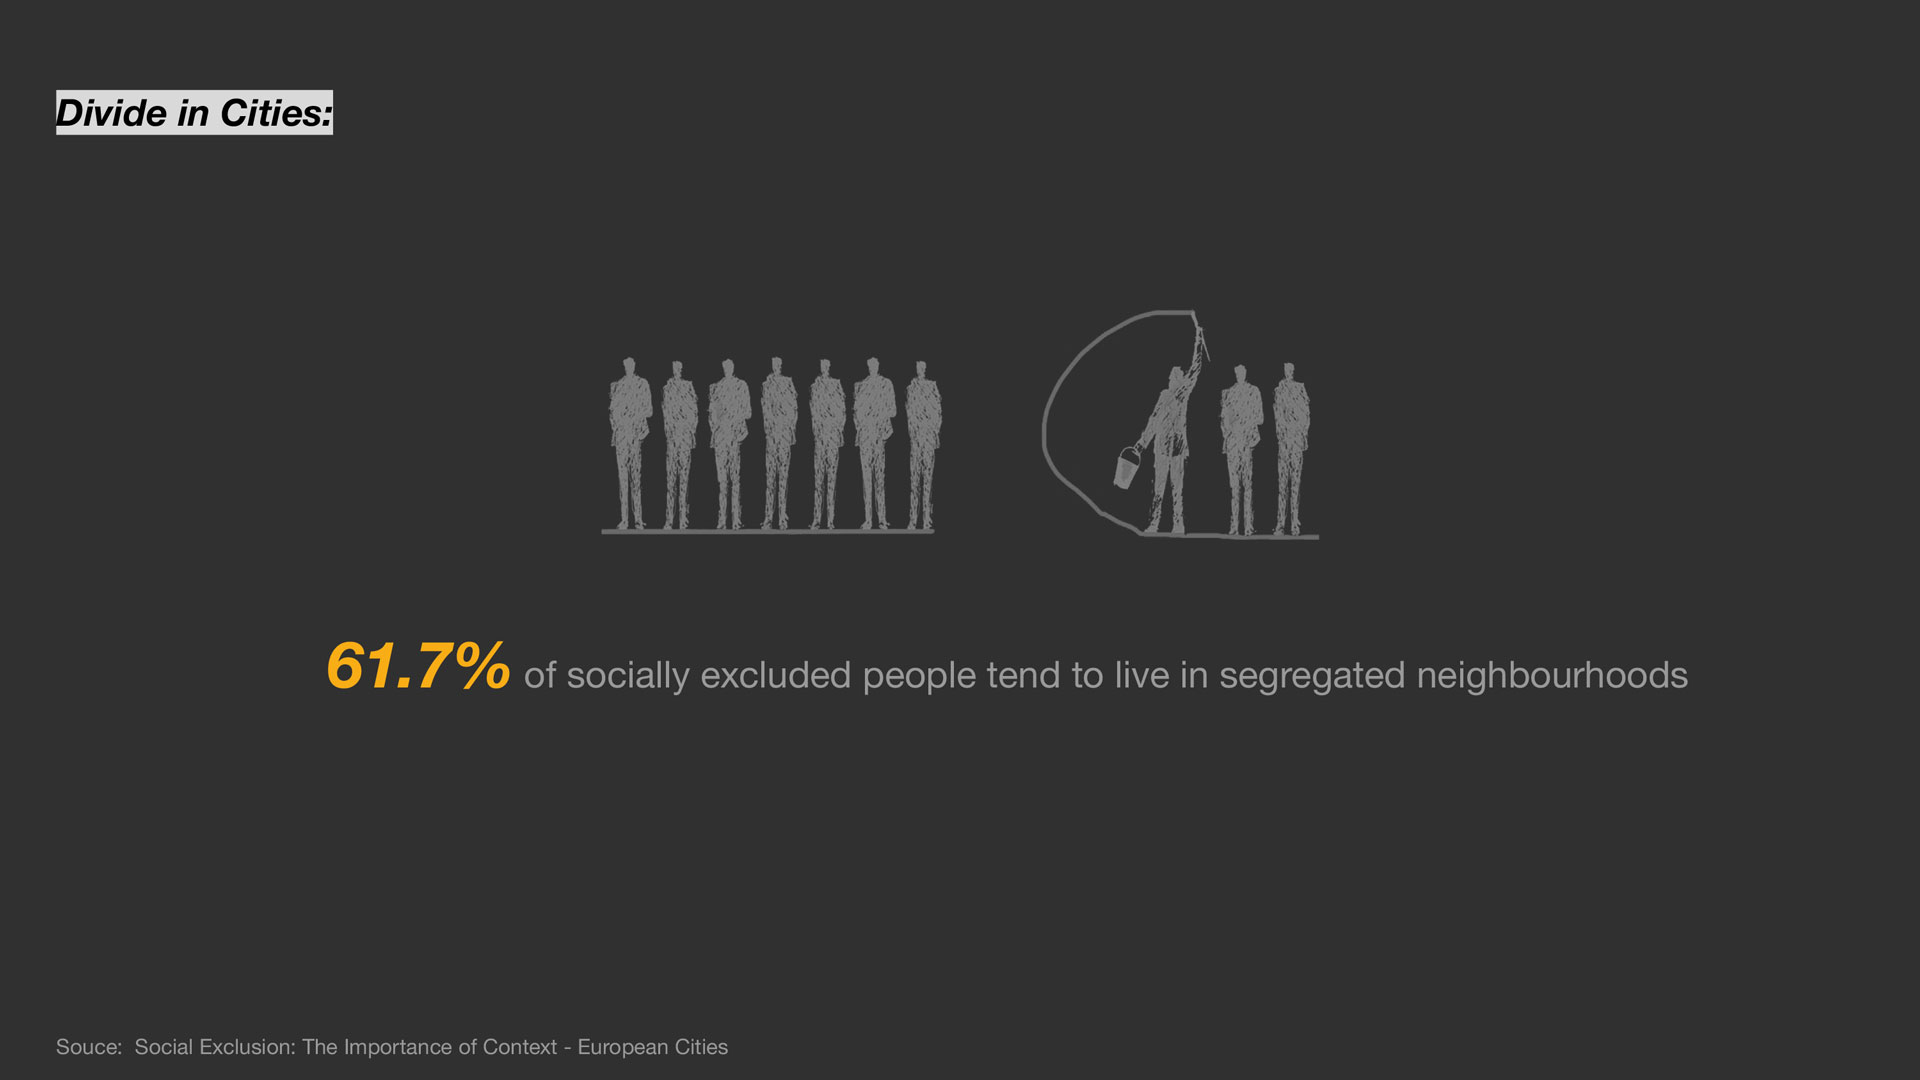
Introduction
Wealth disparity leads to social and economic challenges resulting in social exclusion. 21.6% of population in the EU are at risk of social exclusion. A study confirmed that 61.7% of socially excluded people tend to be segregated. Understanding the origin of the word Segregation – initially used to set sheep apart from the flock, the term gained importance in 1880, but understanding how segregation evolved is crucial.
History & Timeline
Social & class based segregation hold roots in ancient civilizations which then proceeded to religious and social segregation in medieval Europe, which took a turn towards racial segregation during colonial times, light was shed on gender-based segregation in 1903, and the present-day segregation encompasses various aspects of society like income, housing, and mobility, while still retaining remnants of past categories.
Existing Research
With the evolution of segregation, it is essential to know the research developed to understand it. Upon plotting a few major types of research studies spanning from 1880 to 2022 on segregation, most of them predominantly focused on racial/ethnic segregation with housing, although a few exceptions explore other forms of segregation as well.
Need for new Metrics
There is a need for a new metric that can provide a dynamic and multidimensional perspective on understanding segregation in urban areas. This metric should go beyond traditional measures, incorporating factors like economic disparity, cultural diversity, and access to amenities, offering a more nuanced understanding of spatial patterns in contemporary urban environments. Such an approach ensures a comprehensive assessment, facilitating targeted interventions for fostering inclusive and equitable cities.
Divide in the city
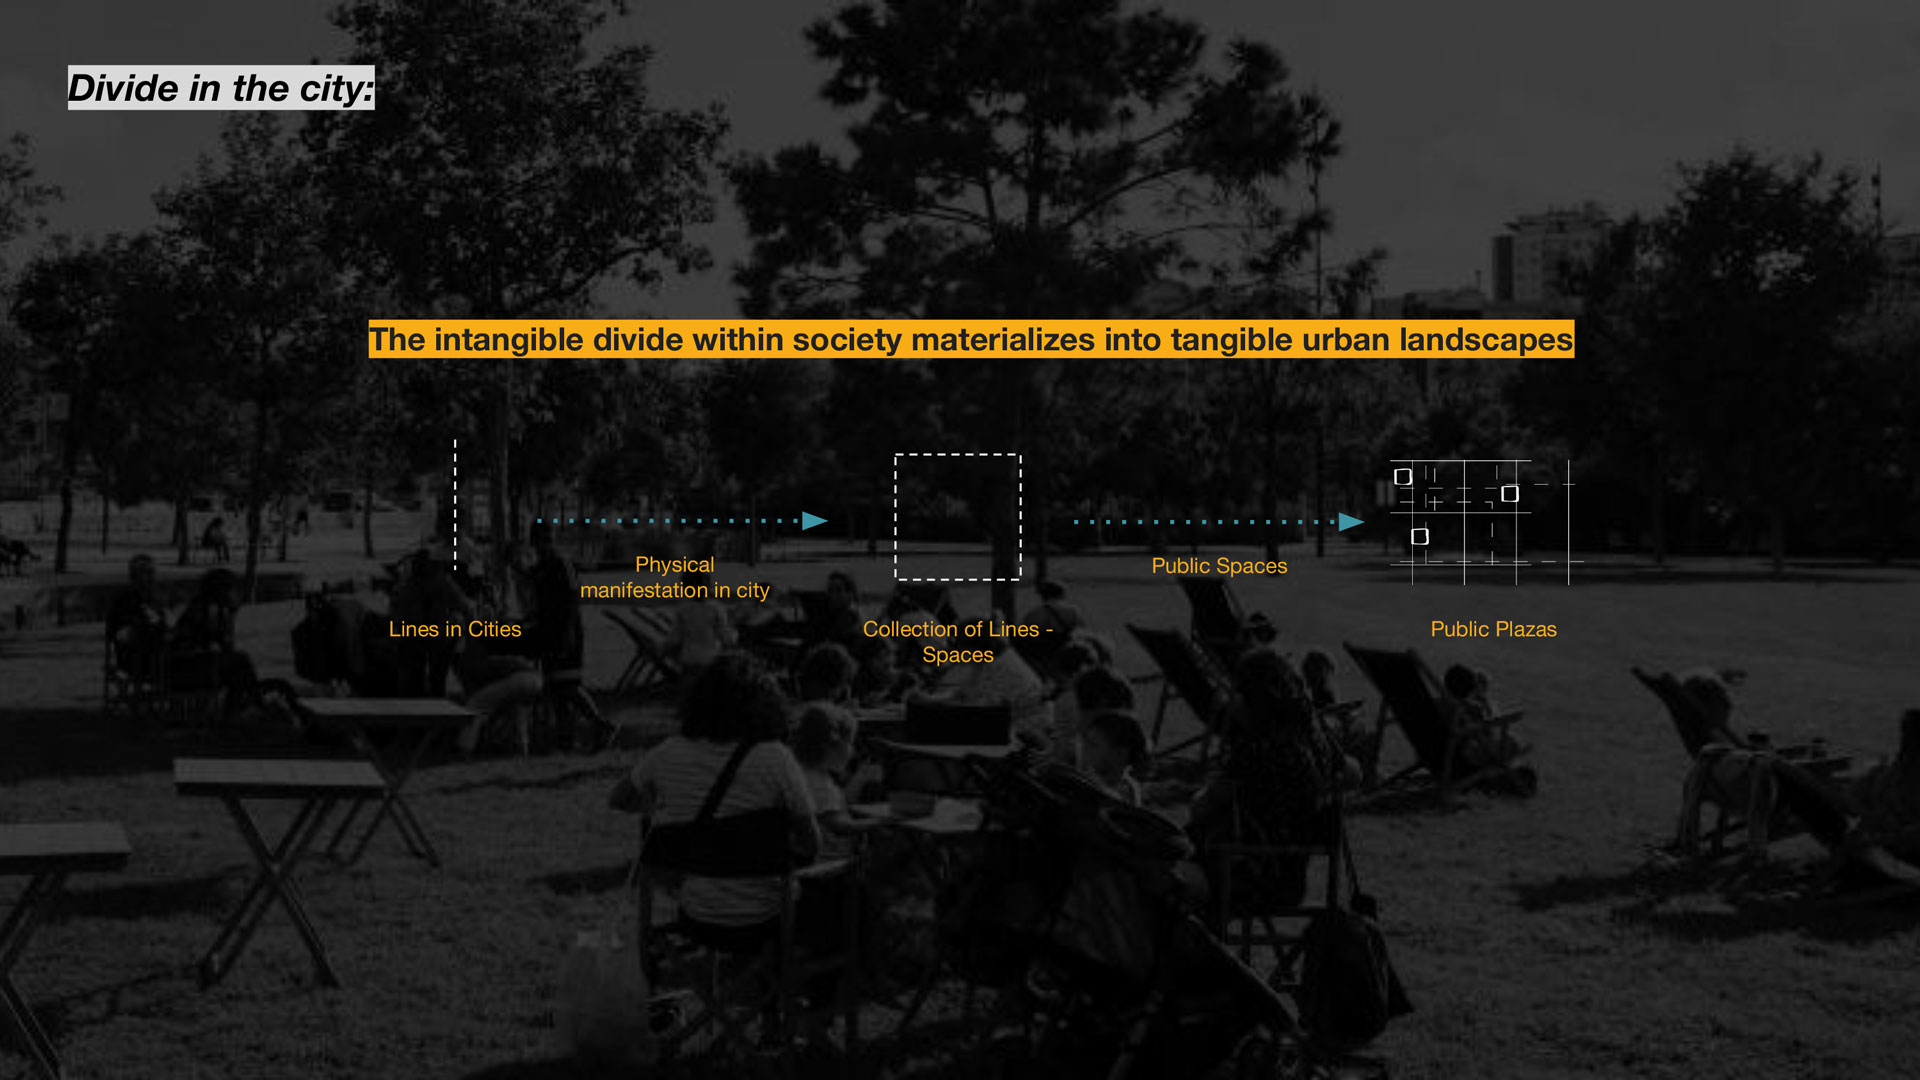
There are various lines that exist in a city right from income, infrastructure, and accessibility to the environment. These lines take a tangible form where they come together to form spaces, This study examines the tangible manifestation of these divisions in public spaces, particularly in public plazas, which have historically played a significant role in shaping cities. Identifying divisions enables us to build community, foster development, maintain societal balance, and support vulnerable communities & spaces by building resilience.
5-Step Methodology
Devising a comprehensive 5-step methodology, it begins with identifying the divisions within the city, followed by assessing the quality of public plazas. We then proceed to evaluate and classify these plazas into distinct typologies. Finally, we test our framework to ensure its effectiveness and applicability. To comprehend the levels of segregation, we shift from identifying divisions at the city level to the plaza level, by selecting a specific area for in-depth analysis of plaza quality based on detailed isochrone assessment. By formulating a vibrancy index score and conducting temporal analysis, we determine typologies. These typologies are then clustered at the city level to categorize all plazas. Finally, we validate our framework through citizen opinion testing.
Identifying lines in the city
In our analysis, we consider affordability and diversity as key indicators for economic and social factors, while evaluating the quality of public spaces to assess spatial factors. Using Shannon’s diversity index and the Gini index, we identify disparities in the city, where neighbourhoods with lower income coefficients exhibit higher ethnic diversity, and vice versa. Some neighbourhoods achieve a balanced combination of the two factors. Due to its significant disparities and abundance of plazas, we select the historic city centre as our focal area of interest.
Quality of Public Plazas
Accessing the quality of public spaces by understanding the spatial boundaries and then proceed to understand accessibility – connectivity, multifunctionality which is functional diversity, we then look into interactivity for economic activities and ecolocality for environmental factors through the lens of time.
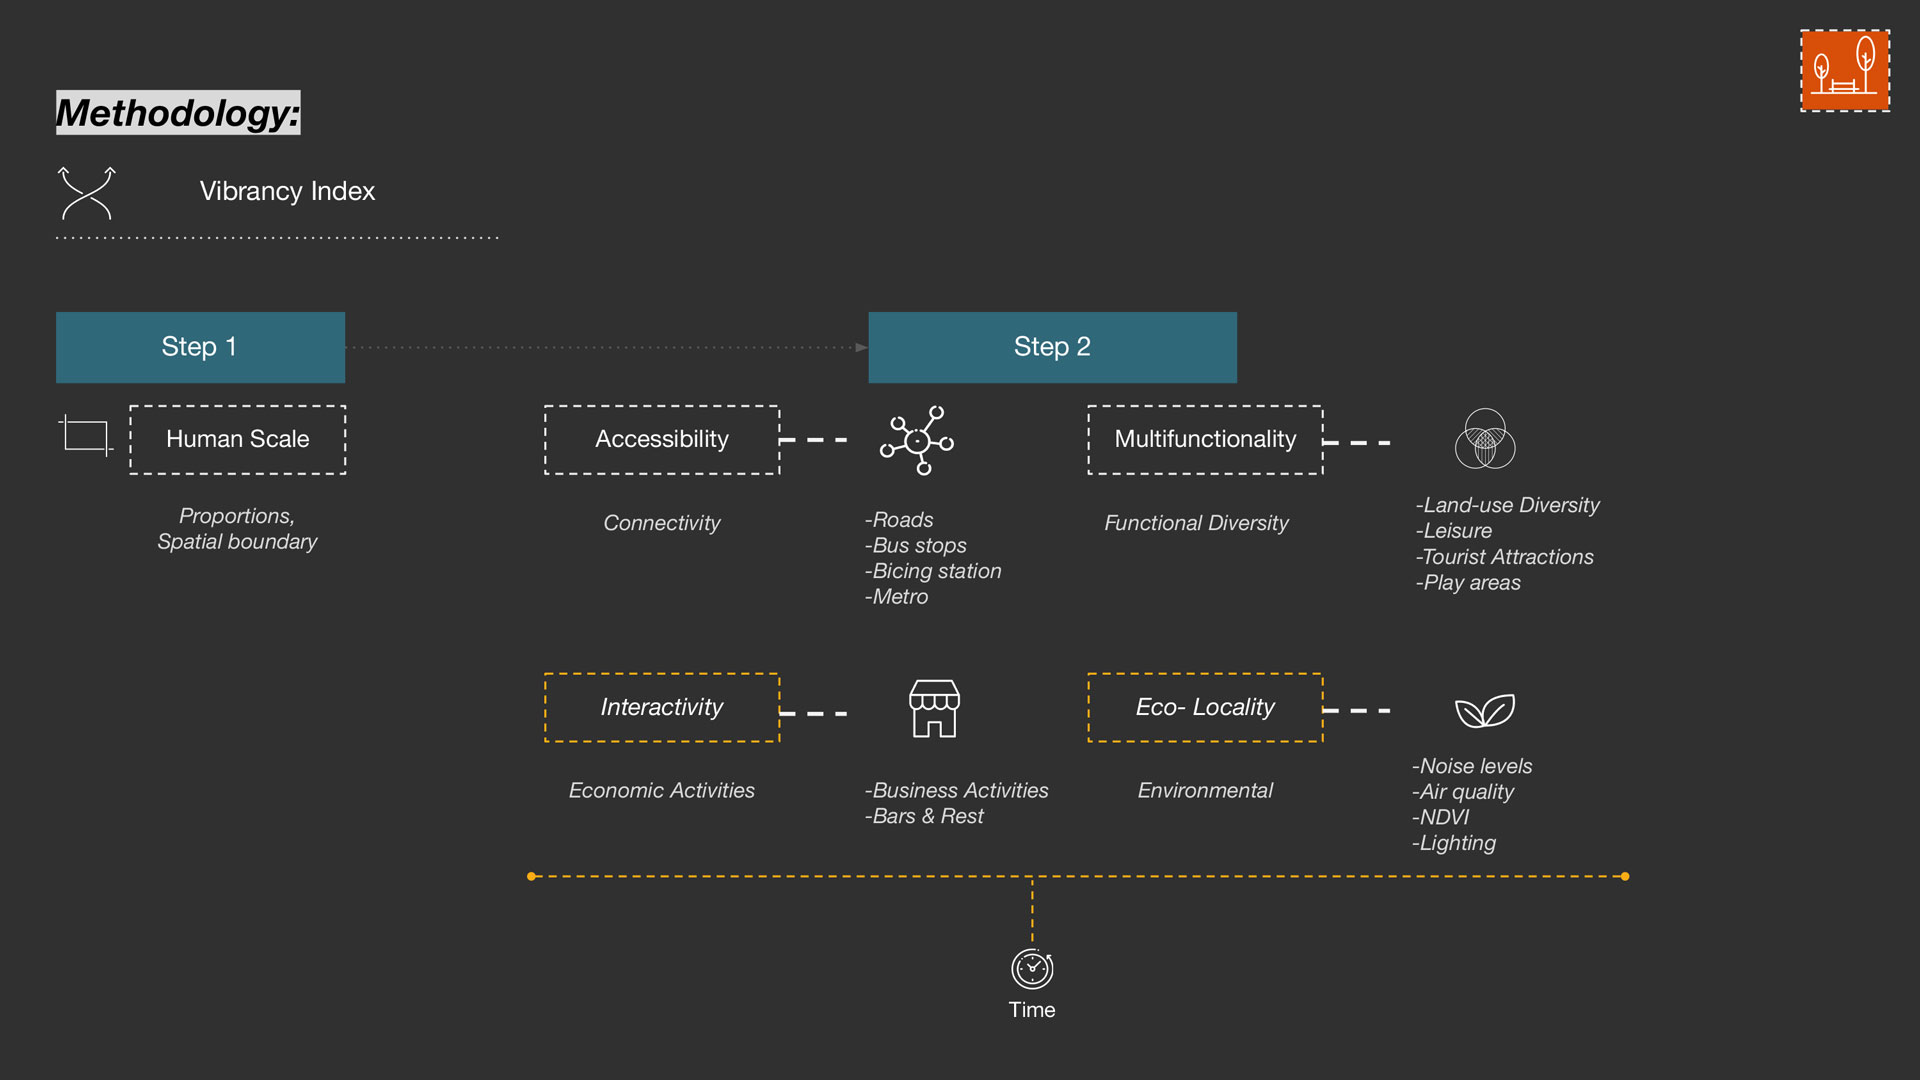
Isochrones with a walkability of 5 mins distance are used as a polygonal analysis area for each of the plaza, all the values for each data layers are remapped to get an Vibrancy Index score for each isochrone.
Each of the plaza isochrones has a vibrancy index score which is a combination of all of the 4 categories which can be seen in the radial chart. We plot the scores in a a graph, our focus are scores from 1-4 and we further investigate the qualitative and temporal factors.
Evaluation of Scores
Four plazas are intuitively picked, one of each scores for further evaluation. Plazas have score from 1-4 each showing which of the factors have which levels in all 4 previous categories respectively. We understand the users of the space by paying the squares a visit. Using anonymous cellular footfall data collected through location-based mapping by google maps, we analyze the most active hours and average footfall. Additionally, we calculate the average time spent by users based on the activities in and around the plaza. Next, we identify and highlight the specific activities available for users to engage in within the plaza. Additionally, we map out the surrounding significant buildings and activities in the vicinity. Based on the comprehensive analysis conducted, it becomes evident that the plazas exhibit significant variations and distinct characteristics. A notable finding from this study is that these plazas perform differently when considering dynamic factors, highlighting that segregation is not static.
Typologies
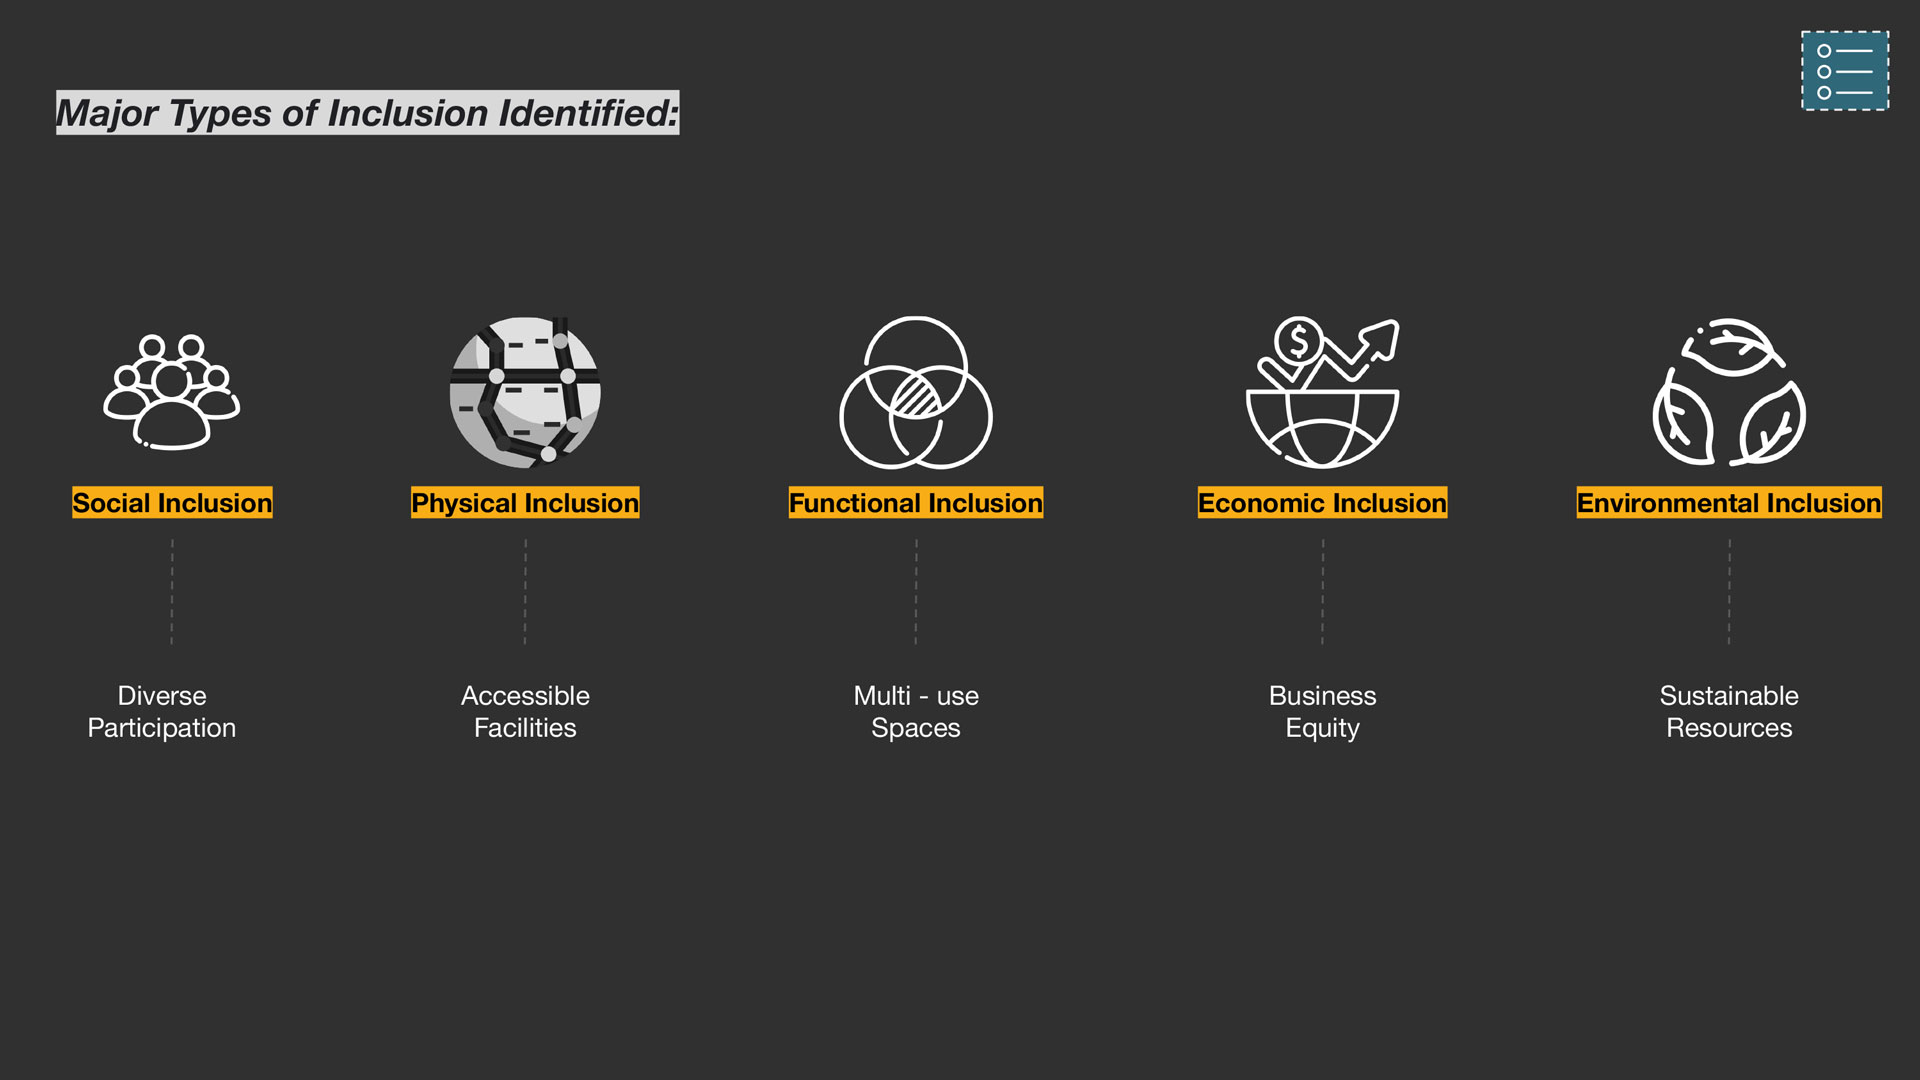
Through this rigorous process of comparisons, we gain insights into the distinctiveness of each plaza and identify various typologies that exist among them, they are:
- Social Inclusion: The process of ensuring that all individuals and groups have equal access to opportunities, resources, and participation in society, regardless of their social status or identity.
- Economic Inclusion: The process of ensuring that all individuals and groups have equal access to economic resources and business opportunities
- Physical Inclusion: The process of ensuring that all individuals and groups have equal access to physical spaces and services, including public transportation, buildings, and public areas.
- Environmental Inclusion: The process of ensuring that all individuals and groups have equal access to and benefit from natural resources and the environment, and that environmental policies and practices are designed to promote equity and sustainability.
- Functional Inclusion: The process of ensuring that space offers opportunities to accommodate different activities for all individuals and groups at once.
Evaluation of Scores for City
We perform clustering where we take the datasets, put them in to isochrones, we get a value per isochrone and then cluster it using a machine learning model. The K-Means clusters on the city level helps us understand the plazas at a detail.
We bring the old plazas and compare them with the ones we picked from the clusters. We conclude that though these plazas fall in the same category of inclusion, the dynamic levels for each of them are unique and different.
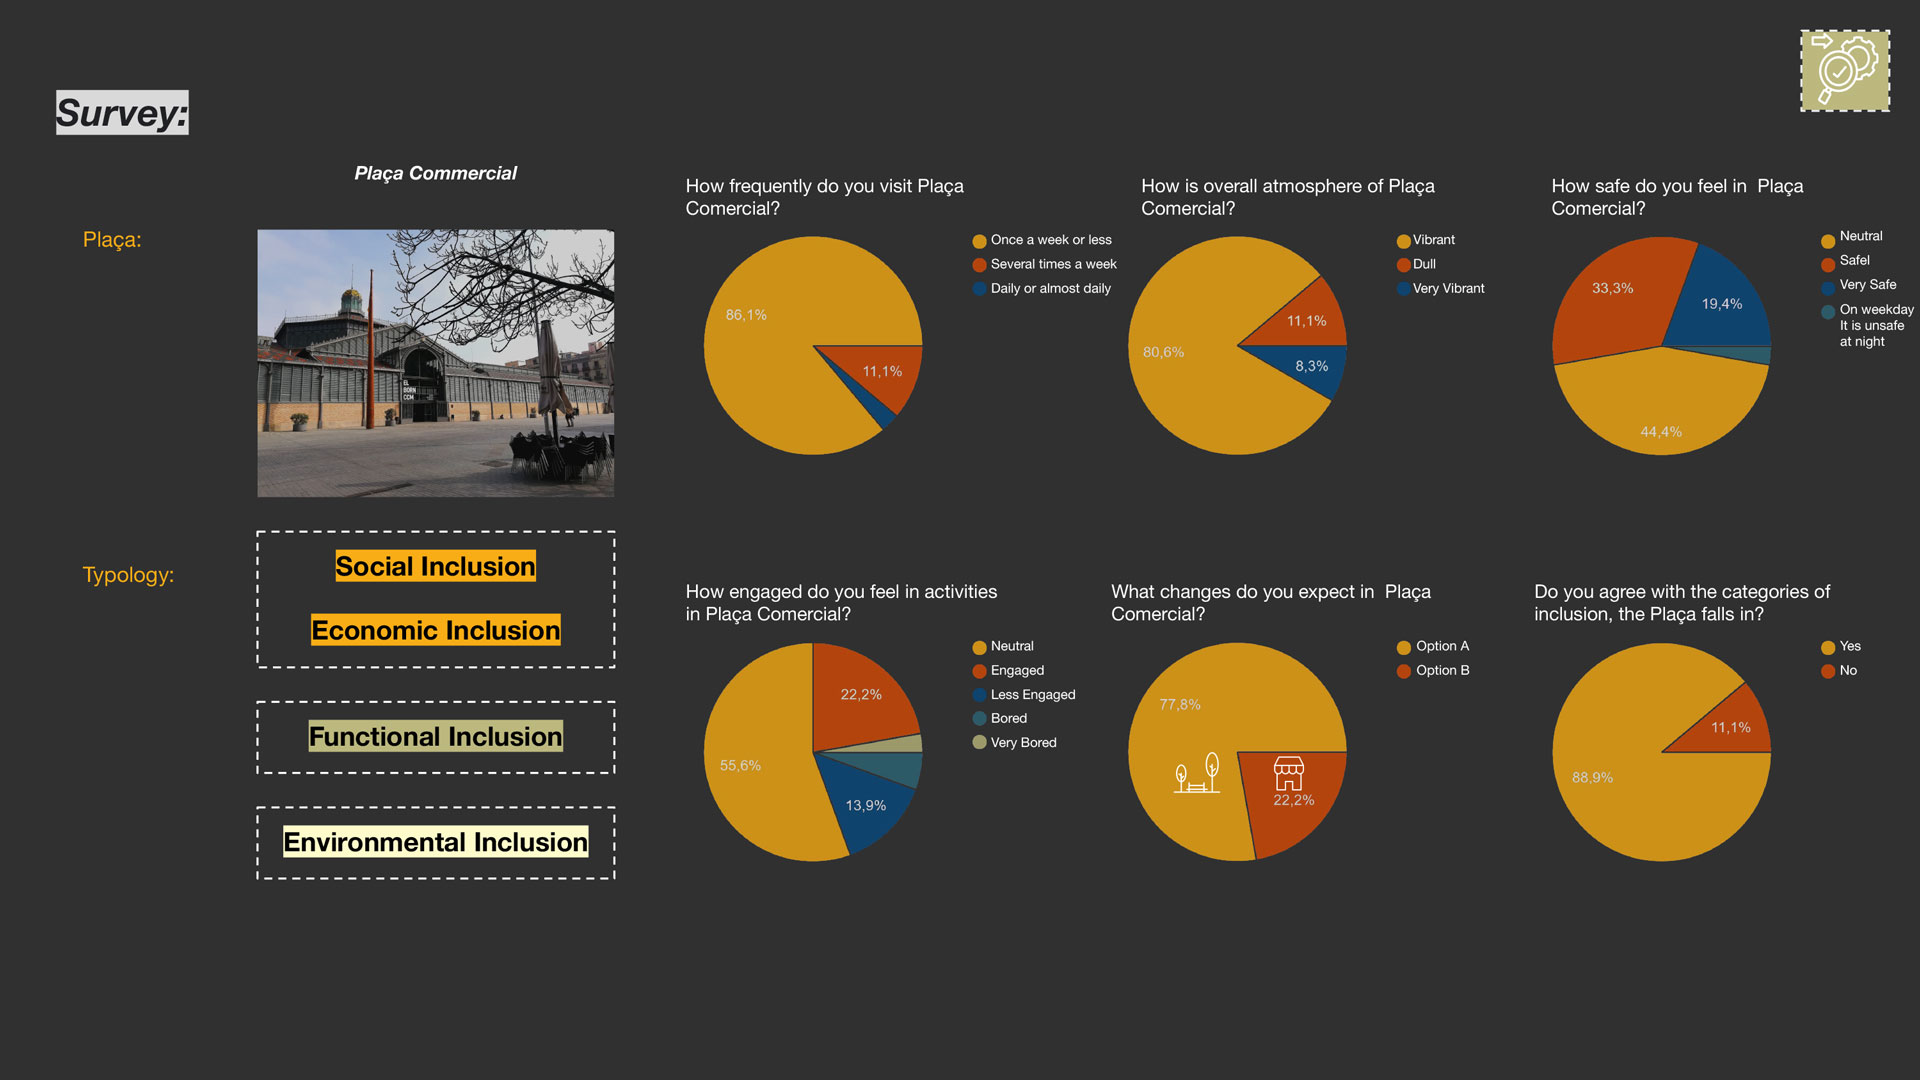
To explore the dynamic inclusion category further, we focused on one of the previously analyzed plazas and examined the festivals, concerts, and programs it periodically hosts. This particular plaza involves community groups dedicated to organizing and ensuring the successful execution of these events. We surveyed 43 individuals of different age groups to gauge their feelings about the space. Questions regarding safety, happiness, and vibrancy were asked. Interestingly, when given the choice between shaded benches and trees or flea markets as an intervention, the majority preferred benches and trees, highlighting the demand for environmental inclusion.