
Climate change is increasing the frequency and severity of extreme weather events, and cities like Mumbai with a population of over 12 million people, is particularly vulnerable to the impacts of climate change. In fact, studies have shown that Mumbai is one of the cities most at risk from rising sea levels more intense floods, heatwaves, and other climate-related hazards in the coming years. The lack of comprehensive and easily accessible data on climatic vulnerabilities in Mumbai hinders the ability of citizens to understand and prepare for the impacts of climate change. This project aims to utilize Open Data to provide citizens with a clear and concise understanding of the most pressing climatic vulnerabilities in the city, and to empower them to take action to address them.

To truly understand the complexities of Mumbai’s vulnerability to the impacts of climate change, the project is analysing the city at multiple scales, including the scale of railway lines. At the scale of the Mumbai Metropolitan Area, we can see the overall vulnerability of one of the largest urban agglomerations in the world. By examining the city we can gain a more nuanced understanding of the specific vulnerabilities that exist in different suburbs. Railway lines play a crucial role in Mumbai’s transportation infrastructure, and they also serve as a critical lifeline for the city during extreme weather events. By analysing Mumbai’s climatic vulnerabilities at the scale of new, upcoming Metro lines, we can identify specific vulnerabilities along critical infrastructure and develop targeted strategies to address them.
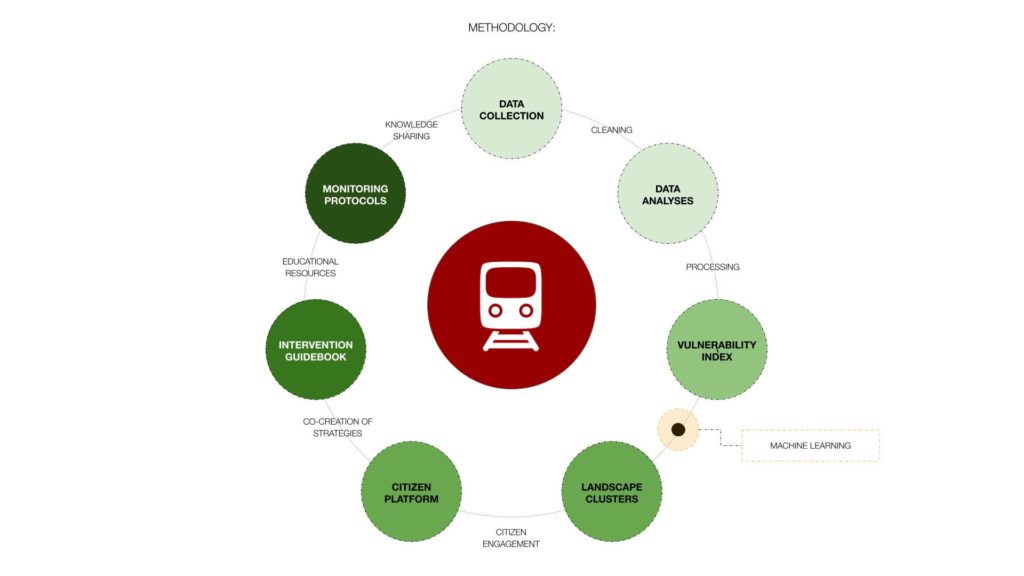
To achieve our goal of providing citizens with a clear and concise understanding of Mumbai’s climate vulnerabilities, we have developed a comprehensive methodology that takes a multi-scale and data-driven approach to analysing the city’s vulnerabilities. Our methodology consists of seven steps, each building upon the previous one, with the Mumbai Metro serving as a critical anchor in the analysis. The machine learning knowledge acquired in the ongoing seminar has been applied to develop landscape clusters from the vulnerability index by using clustering algorithms to group areas with similar vulnerability profiles, which facilitates the development of targeted interventions for each cluster. Through this comprehensive and data-driven approach, we aim to empower citizens to better understand and prepare for the impacts of climate change in their communities, and to build a more resilient and sustainable Mumbai for all.

The project uses machine learning techniques to analyze vulnerability data and develop landscape clusters that group areas with similar vulnerability profiles. To achieve this, we begin by taking raster images of vulnerability data and converting them into normalized indexes. Next, we apply K-means clustering to identify clusters of vulnerabilities that are similar. We then use iterations to refine the clusters and ensure their accuracy. Finally, we plot the refined clusters on T-SNE graphs to gain a visual representation of the clustering of vulnerabilities. These T-SNE graphs provide a powerful tool for understanding the relationships between vulnerabilities and identifying patterns that may not be apparent in the raw data. By using this methodology, we can develop targeted interventions for each cluster of vulnerabilities, helping citizens to better understand and prepare for the impacts of climate change in their communities, and ultimately build a more resilient and sustainable Mumbai for all.

High-resolution satellite imagery from Google Earth Engine, which allowed me to select the data with the best resolution for our analysis. The raster images were converted into categorized data cells of 1000 by 1000 meters, which provided a more manageable and interpretable data set. This categorization process involved using an unsupervised classification technique, which allowed us to group the data cells into distinct categories based on their spectral properties. Overall, by utilizing Google Earth Engine and applying these processing techniques, we were able to obtain a high-quality data set that was suitable for our analysis and enabled us to better understand the vulnerability profile of Mumbai.
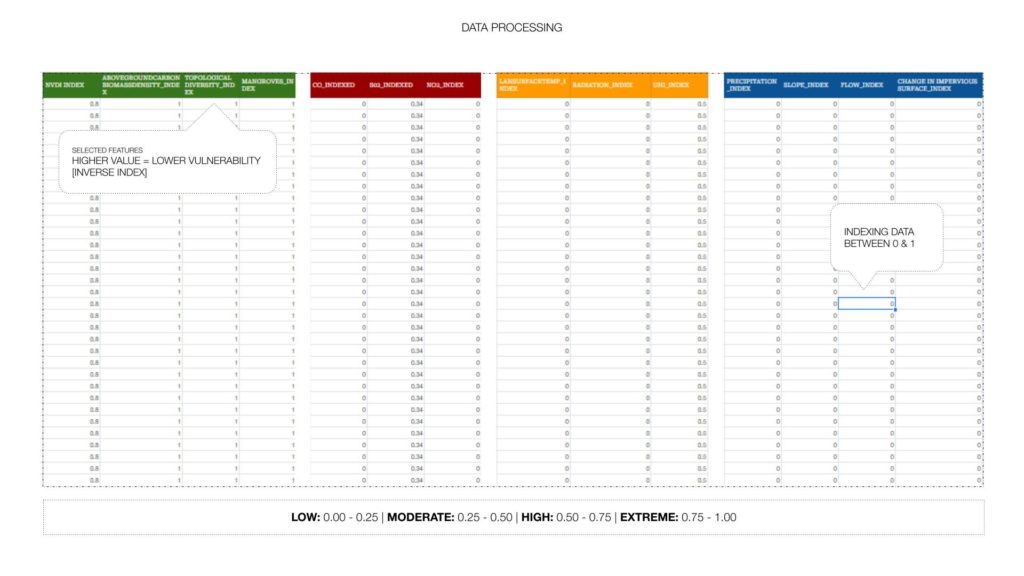
To ensure consistency in our analysis, we normalized all data used in the vulnerability assessment to an index between 0 and 1. We also selected certain features, such as elevation and distance to water bodies, that had an inverse relationship with vulnerability. This means that a higher value of these features indicated a lower vulnerability. By applying this normalization and feature selection, we were able to effectively compare and analyse different data sets and identify the most pressing vulnerabilities in Mumbai.
What this matrix specifically identifies is how certain criteria have a more interdependent correlation with each other, which tells us that it is something that we should explore further at a smaller scale. To identify clusters of vulnerabilities in Mumbai, we applied two clustering approaches: Agglomerative Clustering and K-Means Clustering. We ran each algorithm with 10 clusters and compared the results.

Agglomerative Clustering produced clusters with more relative similar vulnerability profiles. We observed that the diversity of clusters was amplified at natural thresholds, highlighting the different characteristics of each area. K-Means Clustering, on the other hand, produced clusters with more slightly diverse vulnerability profiles. Here too we also noticed that exposure to natural thresholds resulted in a greater diversity of clusters, indicating that this approach can also lead to more nuanced and diverse results.
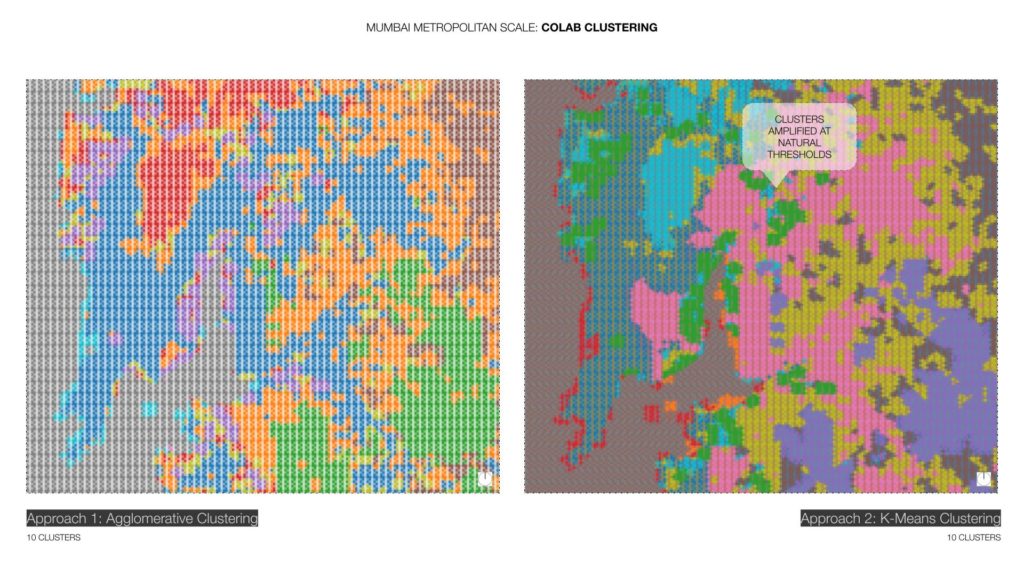
Our analysis indicates that larger natural thresholds amplify cluster diversity, regardless of the clustering algorithm employed. This highlights the critical role of selecting an appropriate natural threshold that aligns with the specific context of the analysis to ensure that the resulting clusters accurately capture the diverse vulnerability profiles of Mumbai. Ultimately, this finding underscores the importance of careful consideration and refinement of the clustering methodology to obtain meaningful and effective results.
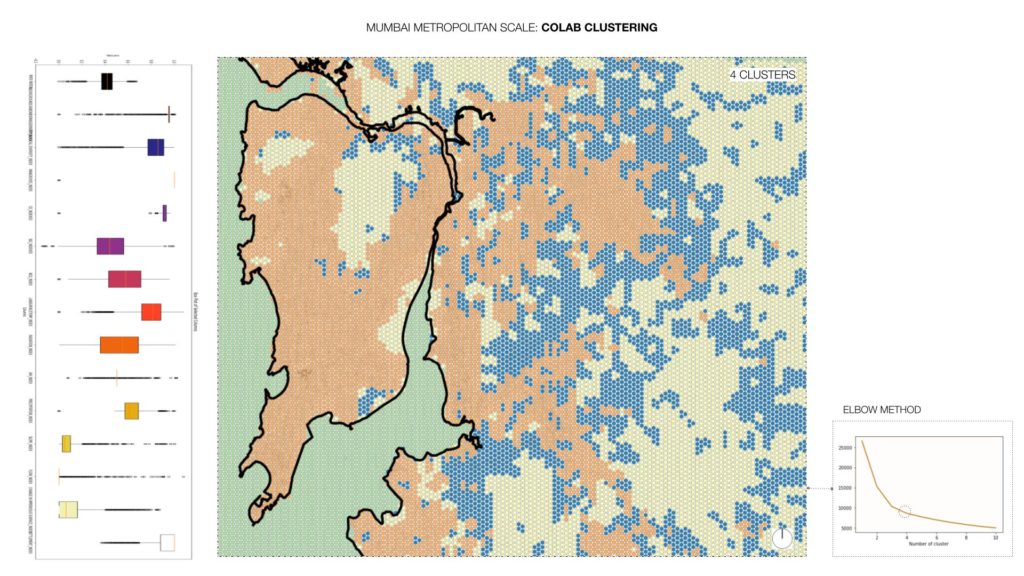
Using the elbow method on the K-means clustering algorithm, we determined that four clusters were the optimal number for analysing the vulnerability profile of the Mumbai Metropolitan Region. These clusters represent distinct areas with different vulnerability profiles, and the insights gained from analysing them can help inform targeted interventions to address climate-related risks in these areas.

The K-Means clustering analysis identified four clusters over the metropolitan region of Mumbai. Each cluster represents a unique vulnerability profile, and the color-coded squares represent the particular vulnerabilities within the clusters that are high or extreme. In Cluster 3 we focus on the extreme vulnerabilities of Mumbai at Metropolitan Scale.
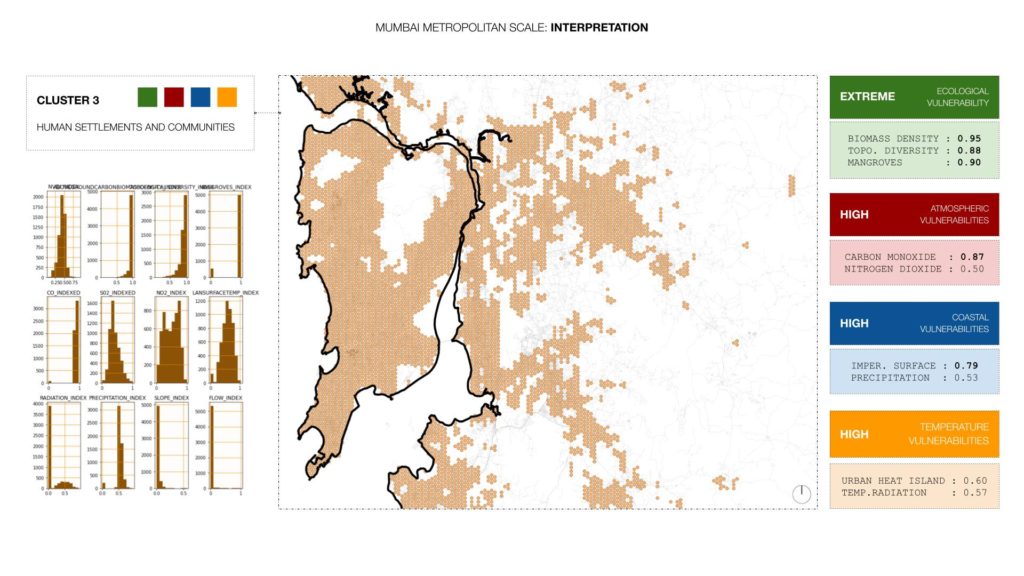
The Cluster indicates that the ecological habitats in this area are extremely vulnerable. This vulnerability is primarily due to the city’s rapid urbanization and resulting encroachment on the natural ecosystems, as reflected by the hollowed national park boundaries inside and around the city, as the border natural areas have completely different vulnerabilities. This complex interplay of human settlement and ecological vulnerabilities creates a unique set of challenges for the city of Mumbai. Therefore, understanding the specific vulnerabilities in this cluster is crucial for effective urban planning and policy-making to mitigate risks and enhance resilience. Therefore, these specific variables were selected again to run a new clustering at the city scale.

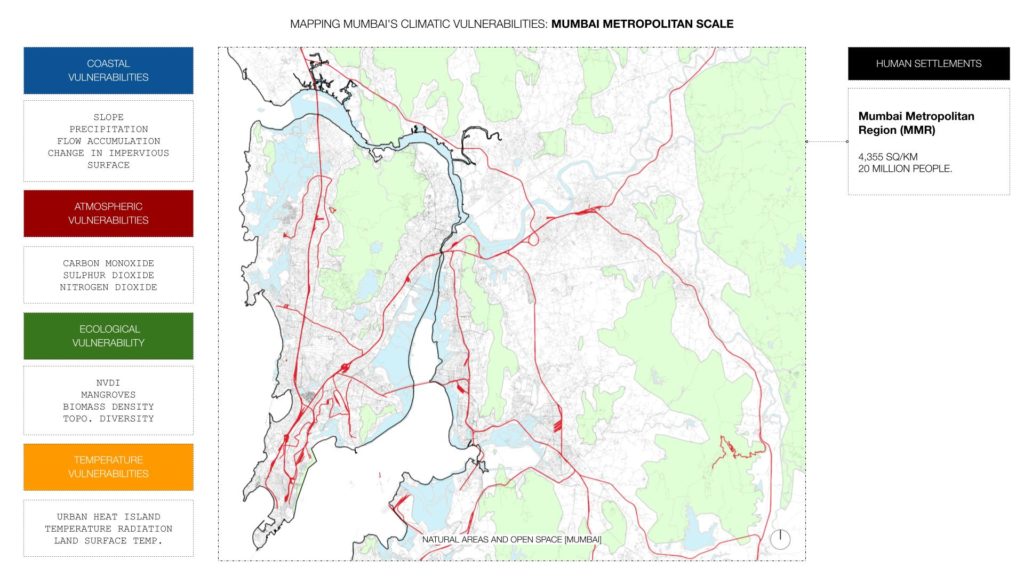
The new scale for our analysis, which is Mumbai [City + Suburbs] is an area of 603 square KM and a population of 12 million people. The focus of this analysis is on human settlements, and it tries to understand the climatic risk assessment dependencies the city develops. his scale also poses unique challenges for climate resilience, as the city is heavily dependent on coastal protection and is constrained by a single national park.
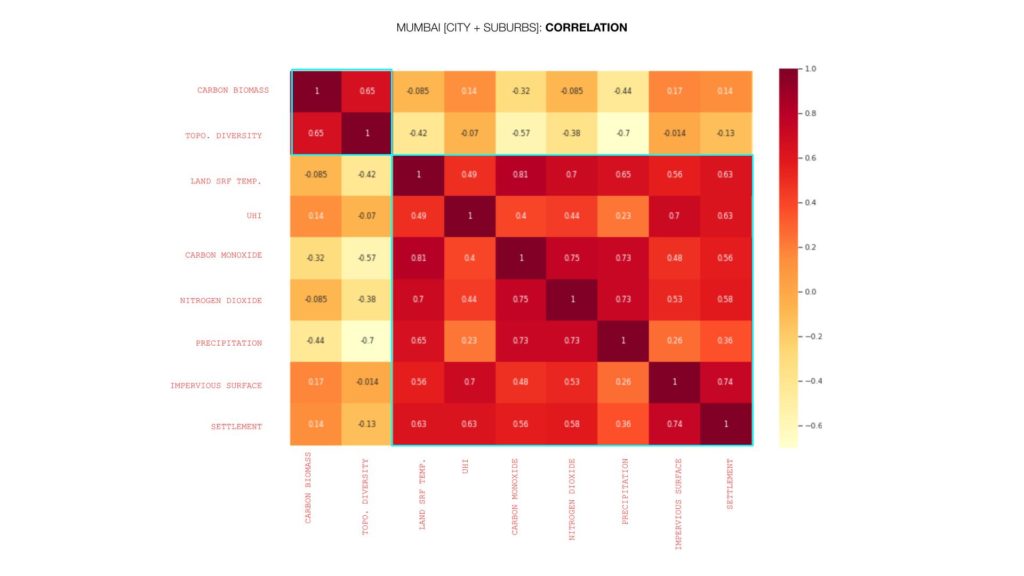
Here we see a correlation analysis for Mumbai [City + Suburbs]. The analysis reveals that the city is highly dependent and integrated, with a high correlation between variables related to ecological vulnerability, temperature vulnerability, and coastal vulnerability. This high level of dependence and integration among the variables indicates that the city is at a high risk for climatic disruptions and natural disasters.
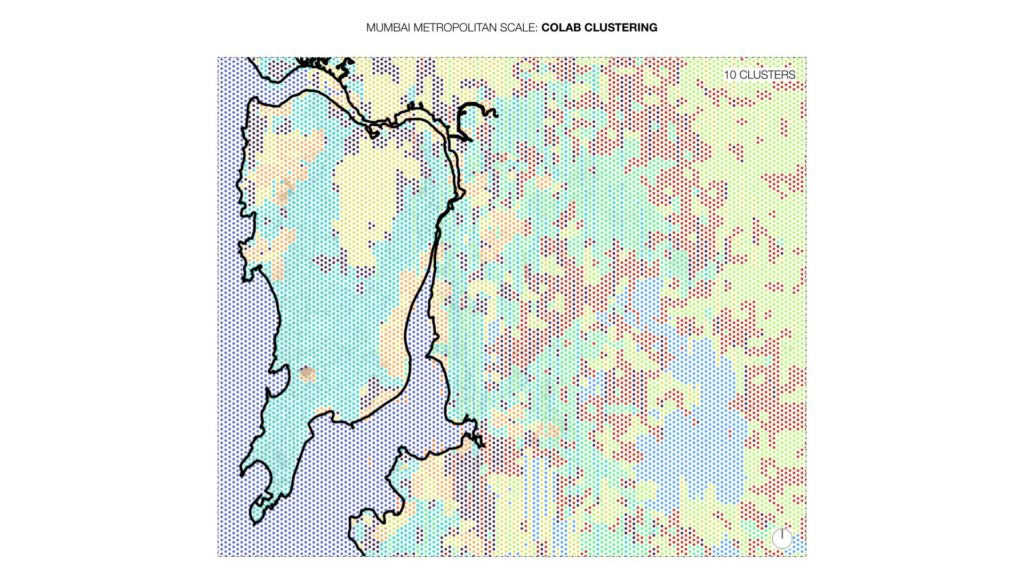
The results of the k-means clustering analysis on Mumbai’s city-scale data revealed ten unique clusters of vulnerabilities. Each of these clusters is distinguished by different combinations of the selected climatic vulnerability variables, which in turn correspond to specific areas of the city. The clusters range from extremely high vulnerability to moderate vulnerability, with each cluster being assigned a different colour code for ease of interpretation.

From our analyses we know that Mumbai’s vulnerabilities are highly dependent and integrated. Many of the clusters that were identified overlap along thresholds, indicating that specific areas of the city are exposed to specific vulnerabilities. The color-coded squares used in our analysis represent an identification technique that provides each cluster with a unique combination of at-risk vulnerabilities. By using this technique, we can quickly and easily identify which vulnerabilities are most prevalent in a particular cluster, allowing us to tailor our response and mitigation efforts accordingly. For example, cluster 0 along the coast has extreme ecological vulnerabilities whereas cluster 4 that is concentrated in the national park has high atmospheric vulnerabilities.
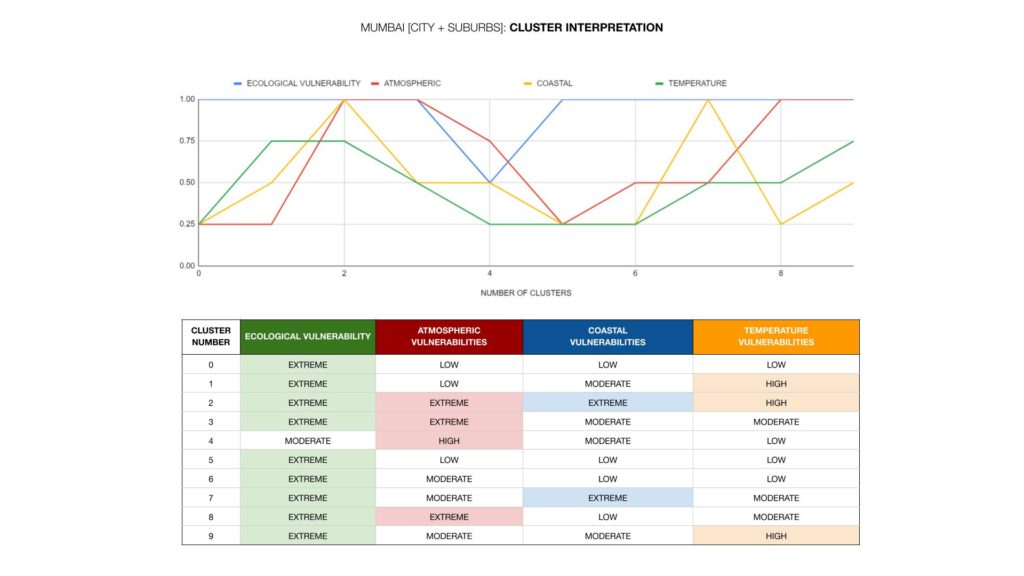
We have identified 10 unique clusters in Mumbai [City + Suburbs] based on their vulnerabilities to ecological, atmospheric, coastal, and temperature factors. The graph plot that illustrates this relationship. Cluster 0 has extreme ecological vulnerability but low atmospheric, coastal, and temperature vulnerabilities, while Cluster 3 has extreme vulnerability in all four categories. Overall, the clusters with extreme ecological vulnerability tend to have high or extreme vulnerability in other categories as well. Clusters 0, 5, and 6 have low to moderate vulnerabilities in all categories except ecological, indicating that their main risk factor is the loss of natural ecosystems. Cluster 4 has moderate vulnerabilities across the board, which may indicate a need for more balanced planning and infrastructure improvements. Clusters 1, 2, 7, 8, and 9 have at least one category with high or extreme vulnerability, with varying combinations of other vulnerabilities. These clusters may require targeted interventions to address their specific vulnerabilities.
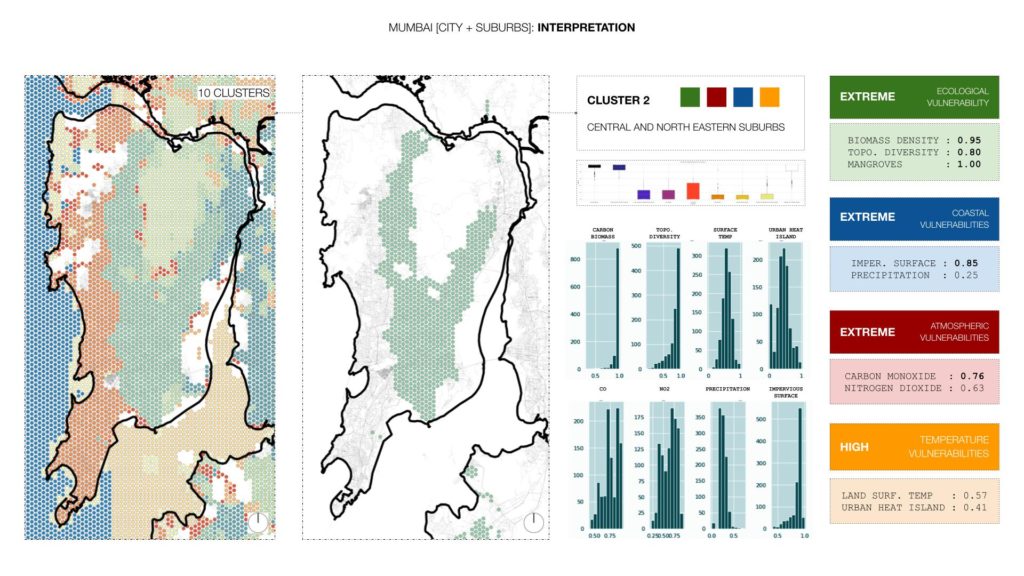
Focusing on one particular cluster from the 10 clusters we discovered at the CITY SCALE Mumbai through our analysis. CLUSTER 2 has been identified due to its extreme nature and the distribution can be labelled as Central and North-eastern Suburbs based on its spatial spread. This cluster has high vulnerabilities, specifically with respect to above ground carbon biomass density and change in impervious surfaces. Interestingly, this cluster borders the natural park on the north and mangroves on the east, making it a unique area that requires special attention. Our analysis shows that the vulnerability of this cluster is primarily due to the changes in land use patterns, especially the increase in impervious surfaces, which leads to reduced carbon biomass density. This cluster’s vulnerability, combined with its spatial distribution, highlights the need for appropriate policies and interventions to mitigate the impact of climate change.

The box plots illustrate the distribution of vulnerability data across the 10 clusters identified through k-means clustering. The large graph in the centre combines all data points across all clusters, while the individual graphs on the sides represent single datasets and their distribution across the 10 clusters, THE distribution of data points within each cluster, the minimum and maximum and the median values. By analysing the box plots, we can identify clusters that exhibit particularly high or low levels of vulnerability for specific factors, which can later be used to prioritize interventions and policy measures to address these vulnerabilities. Additionally, the box plots enable us to identify outliers, or data points that fall significantly outside the typical range of values, which may require additional attention as they come from global datasets that are normalized at a local scale. .
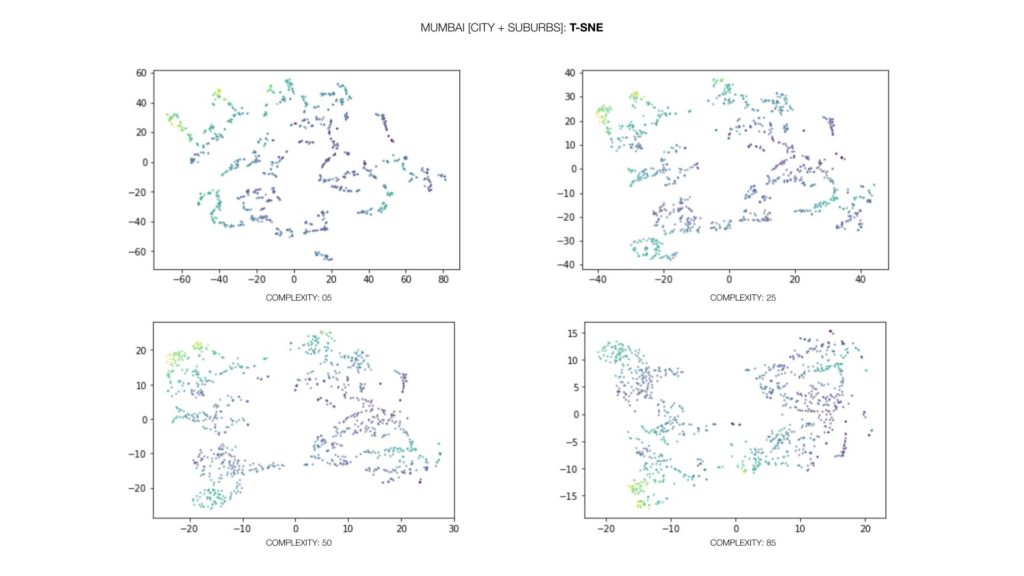

The T-SNE graph visualizes the clustering results of vulnerability across Mumbai at a city scale]. Some distinct clusters are overlapped by other clusters due to an edge condition coming into play, such as the coast, mangroves, national parks, tributaries, and other green spaces.In the case of our vulnerability analysis, the T-SNE graph helps us understand the spatial relationships between different clusters and the natural and man-made features that affect their vulnerability. By observing the overlapping clusters, we can identify areas that are particularly susceptible to the impact of climate change and prioritize interventions to mitigate these vulnerabilities.

We have already seen the various climatic vulnerabilities that Mumbai faces, and how it is impacted by extreme weather events. Now, we will be looking at a smaller scale – the upcoming Metro lines, and how understanding their vulnerabilities is important. The upcoming Metro lines are critical infrastructure for Mumbai’s transport network. These Metro lines pass through densely populated settlements and urban agglomerations, which are centred around major city networks. It is therefore essential to study and understand the vulnerabilities around this critical infrastructure. In conclusion, understanding the vulnerabilities around Mumbai’s upcoming Metro lines is crucial for the sustainable development of the city. The information gathered through this mapping exercise will help us to identify potential risks and develop strategies to mitigate them.
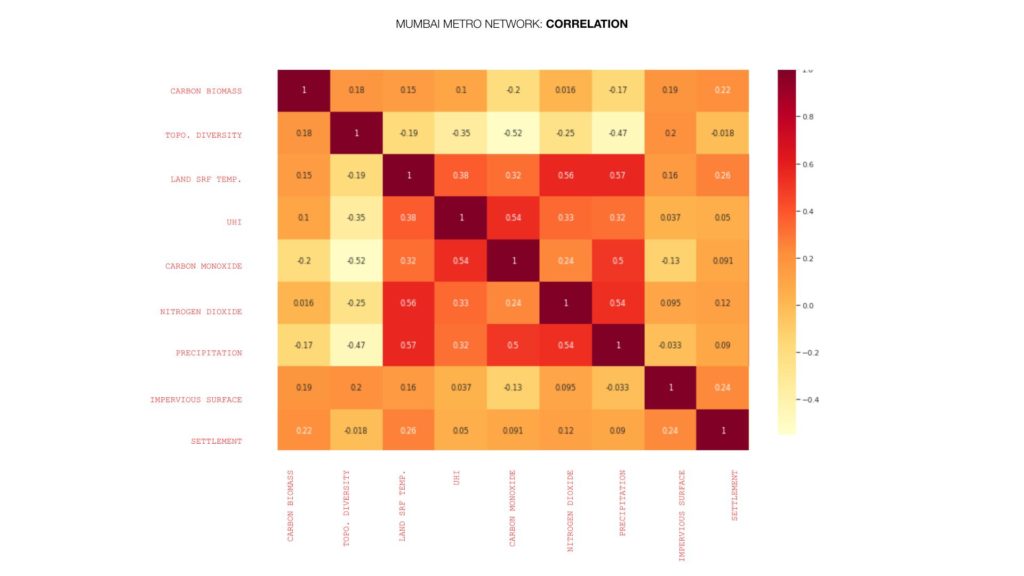
This time, the matrix gives balanced results as it highlights the interconnectedness of different vulnerabilities and how their interconnection becomes more diverse and balanced. This balance is crucial for developing effective strategies for mitigating the impact of climatic events. By taking a holistic approach that addresses multiple vulnerabilities simultaneously, we can create a more balanced and sustainable city.

At this scale, K means clustering was used to to develop 10 clusters over the Mumbai Metro network that are based on nuanced diversities. In addition to identifying clusters based on vulnerability to the four climatic events, the K means clustering analysis has also highlighted how these vulnerabilities overlap on edge conditions. Edge conditions refer to areas where two or more clusters overlap, creating complex and compounded vulnerabilities. The identification of edge conditions is critical because it highlights areas that are at high risk of experiencing the impacts of multiple climatic events simultaneously. These areas require special attention and targeted interventions to mitigate the compounded risks. Furthermore, the identification of edge conditions also provides insights into the need for an integrated and cross-cutting approach towards climate resilience. By addressing multiple vulnerabilities simultaneously, we can create a more balanced and sustainable approach towards climate resilience in Mumbai.
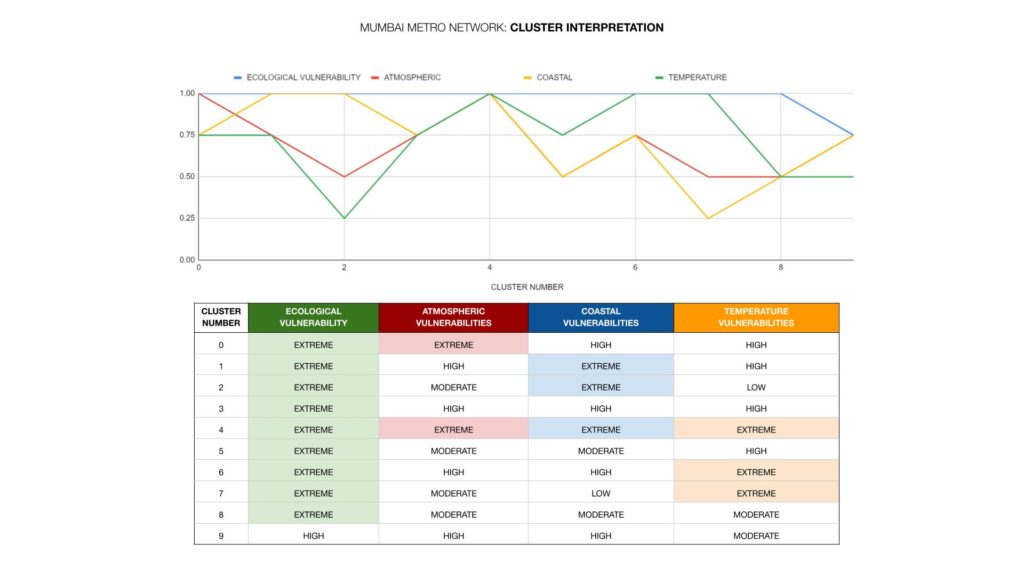
We have identified 10 clusters across the Mumbai Metro network based on nuanced diversities across four climatic vulnerabilities. Clusters 0, 1, 3, 4, 6, and 7 have extreme ecological vulnerabilities, but they differ in their atmospheric, coastal, and temperature vulnerabilities. Clusters 2, 5, 7, and 8 have moderate to low ecological and atmospheric vulnerabilities, but they have varying levels of coastal and temperature vulnerabilities. This suggests that measures to mitigate coastal and temperature vulnerabilities may need to be prioritized in these areas, even if their ecological and atmospheric vulnerabilities are relatively low. Cluster 9 stands out as having high temperature vulnerabilities but low ecological, atmospheric, and coastal vulnerabilities. This highlights the need for measures to reduce the urban heat island effect and promote thermal comfort in this area, even if other climatic vulnerabilities are not as significant. Cluster 4 is the only cluster that has extreme vulnerabilities across all four climatic categories (ecological, atmospheric, coastal, and temperature). This cluster requires urgent and comprehensive attention to mitigate the risks to the population and critical infrastructure in the area.
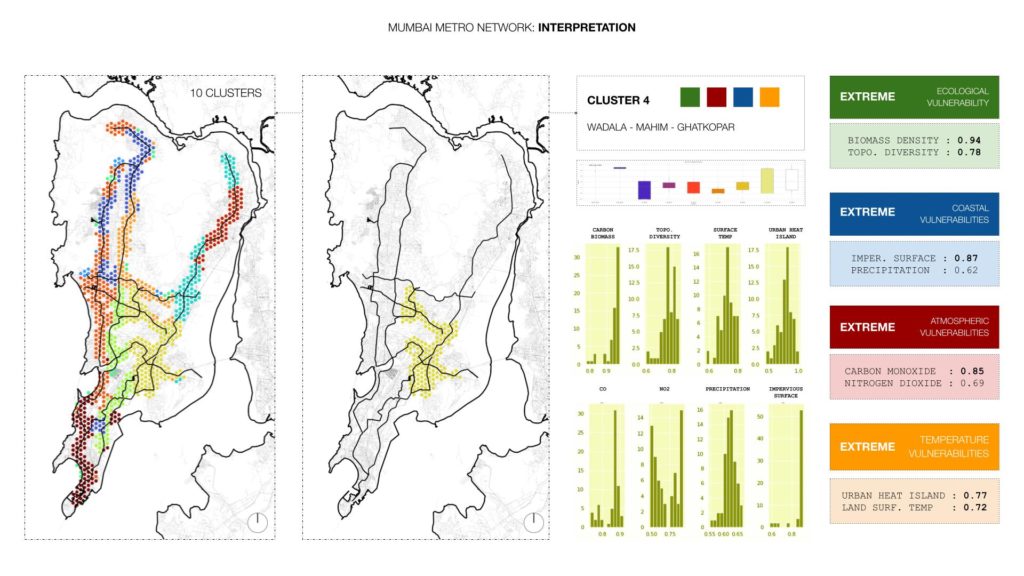
The high AGCBD index is an indicates that the area has a high degree of accessibility and diverse land uses, but also has a high potential for urban heat island (UHI) effect and low green cover, which can exacerbate climatic vulnerabilities. The high TOPO (Topography) index suggests that the area is relatively flat, which may affect air circulation and lead to increased atmospheric pollution and heat build up. The high UHI (Urban Heat Island) index reinforces the importance of implementing measures to mitigate heat build up in the area, such as increasing green cover, using reflective surfaces, and improving air circulation. The high CO (Carbon Monoxide) and NO (Nitrogen Oxide) indices indicate high levels of atmospheric pollution, which can pose significant health risks to the population and exacerbate climate-related vulnerabilities. Overall, the high degree of climatic vulnerabilities in Cluster 4 highlights the urgent need for comprehensive measures to mitigate risks to the population and critical infrastructure in the Wadala – Mahim – Ghatkopar area.
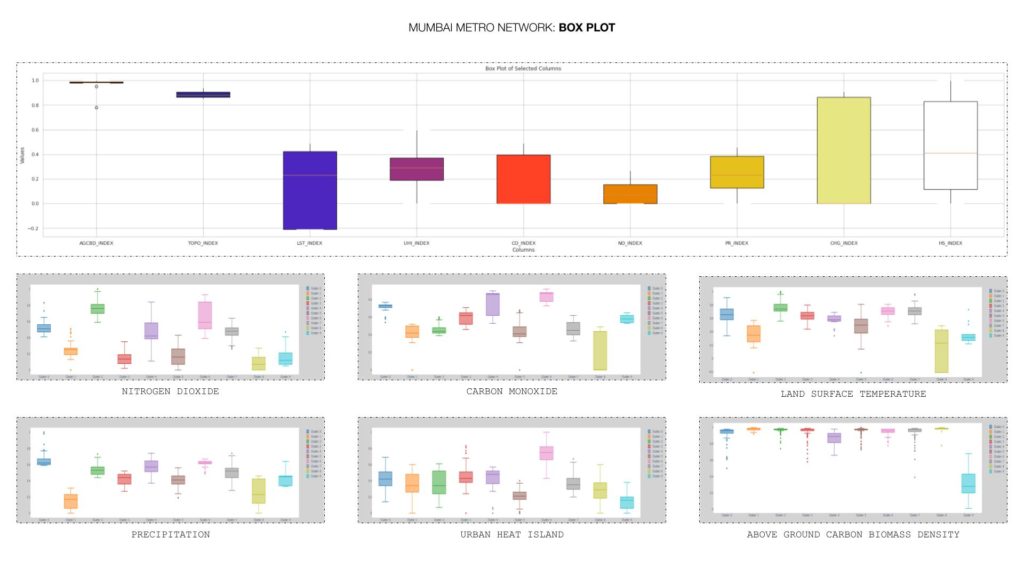
The Outliners definitely illustrate extreme conditions for the Above ground carbon biomass density index. indicating areas with very low green cover in the metro network. The box plot for the Carbon Monoxide index shows a lot of values towards the higher end, it could indicate areas with high levels of carbon monoxide pollution along the metro network. Both the the median and quartiles Land Surface Temperature index are towards the higher end, it could indicate areas with high surface temperatures along the metro network.

Mumbai is a sprawling metropolis, and its climatic vulnerabilities are diverse and multi-layered. By mapping climatic vulnerabilities at different scales we can develop a nuanced understanding of the city’s vulnerabilities and identify key areas that require our attention. At t
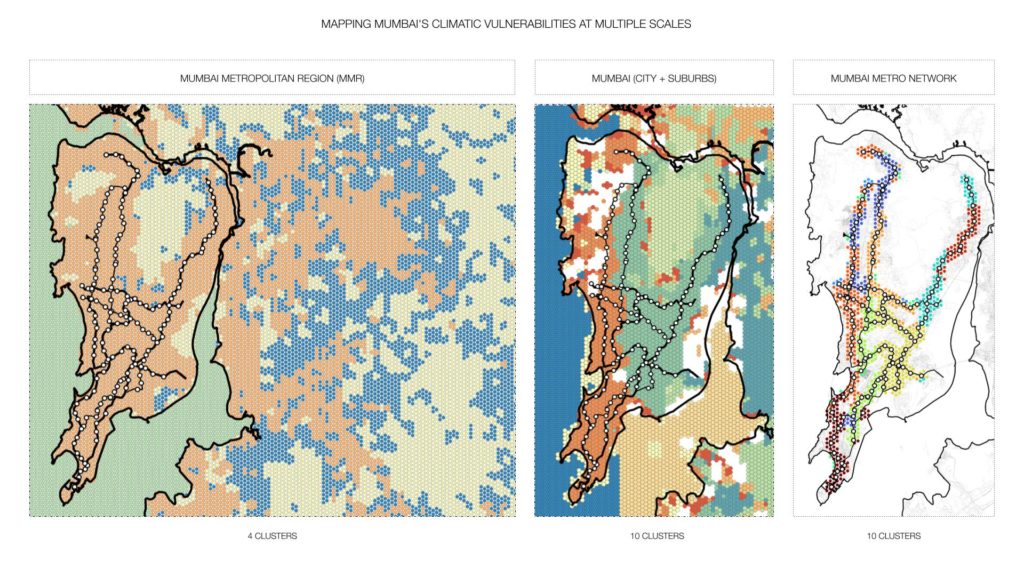
he MMR level, we identify broader trends and patterns of climatic vulnerabilities. This scale allows us to take a comprehensive view of the city’s vulnerabilities, including its coastal and riverine areas, urban heat island effects, and ecological vulnerabilities. By identifying these broader trends, we can develop targeted interventions that can help build resilience across the city. At the Mumbai city and suburbs level, we can identify specific areas that are most vulnerable to climatic events such as floods and heatwaves. This scale of mapping allows us to focus on the local context and understand the intricacies of urbanization and its impact on the environment. This can help us prioritize interventions to mitigate the climatic anomalies and impacts. At the Mumbai metro network level, we can identify specific upcoming stations that are at high risk due to their location in dense settlements and urban agglomerations, centred across major city networks. Mapping climatic vulnerabilities at this scale can help us understand the vulnerabilities around critical infrastructure such as the upcoming metro station itself and develop targeted interventions to mitigate the impact of climatic events.
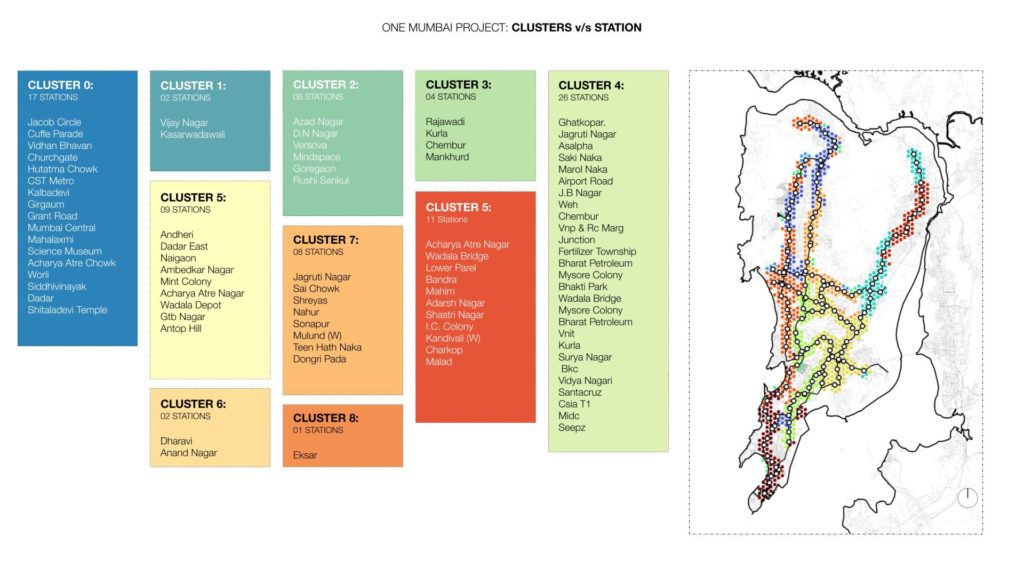
By applying unsupervised clustering techniques to map Mumbai’s climatic vulnerabilities at multiple scales, we have identified distinct clusters that group together metro stations with similar vulnerabilities. This means that we can now categorize all metro stations based on their unique cluster, which will help us understand the specific risks and vulnerabilities associated with each station. Indexing each station with a clustered vulnerability not only provides valuable insights to city planners but also empowers citizens to understand the potential climate risks associated with the growing metro network in Mumbai. This knowledge can help individuals make informed decisions regarding their transportation choices and take proactive measures to mitigate the potential impact of climate vulnerabilities. Ultimately, the power of data lies in its ability to support decision- making while also providing us with the tools to make informed decisions and take action.
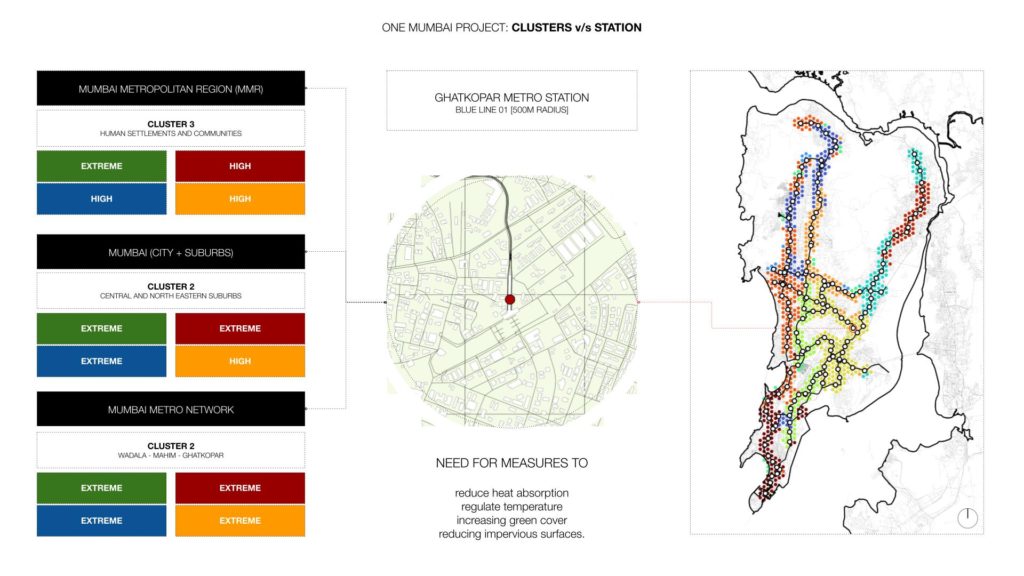
What we are essentially able to extract is an in-depth analysis of a single station in the Mumbai Metro network to demonstrate the usefulness of mapping climatic vulnerabilities at multiple scales. The slide provides a detailed view of all the vulnerabilities that the Ghatkopar station faces at each scale, including the Mumbai Metropolitan Region, Mumbai City and Suburbs, and the immediate Metro Network. The ecological vulnerability is highest in the MMR scale,. Coastal vulnerabilities are also high across all scales, with impermeable surface cover and precipitation being the key contributing factors. Atmospheric vulnerabilities are highest in the city and suburbs scale, with high levels of carbon monoxide and nitrogen dioxide. Temperature vulnerabilities are highest in the Mumbai metro network scale, with the urban heat island effect being a major factor. Additionally, land surface temperature is a concern across all scales. Holistically there is a need for measures to reduce heat absorption and regulate temperature, such as increasing green cover and reducing impervious surfaces. Overall, the data provides valuable insights into the vulnerabilities of different areas in Mumbai, highlighting the need for targeted interventions to address these issues. Indexing each station with clustered vulnerability levels can help citizens understand the situation and make informed decisions about their actions and lifestyle choices.
