
Greater Manchester, one of the largest and most vibrant urban centers in the UK, is characterized by its substantial student population and a dynamic economic landscape. With approximately 120,670 university students during the 2021/22 academic year and a significant number of these individuals studying at the University of Manchester and Manchester Metropolitan University, the region exemplifies a youthful and energetic demographic. This surge in student numbers, reflecting a net increase of around 19,795 since the 2016/17 academic year, further underscores the city’s role as a major educational hub in Europe.
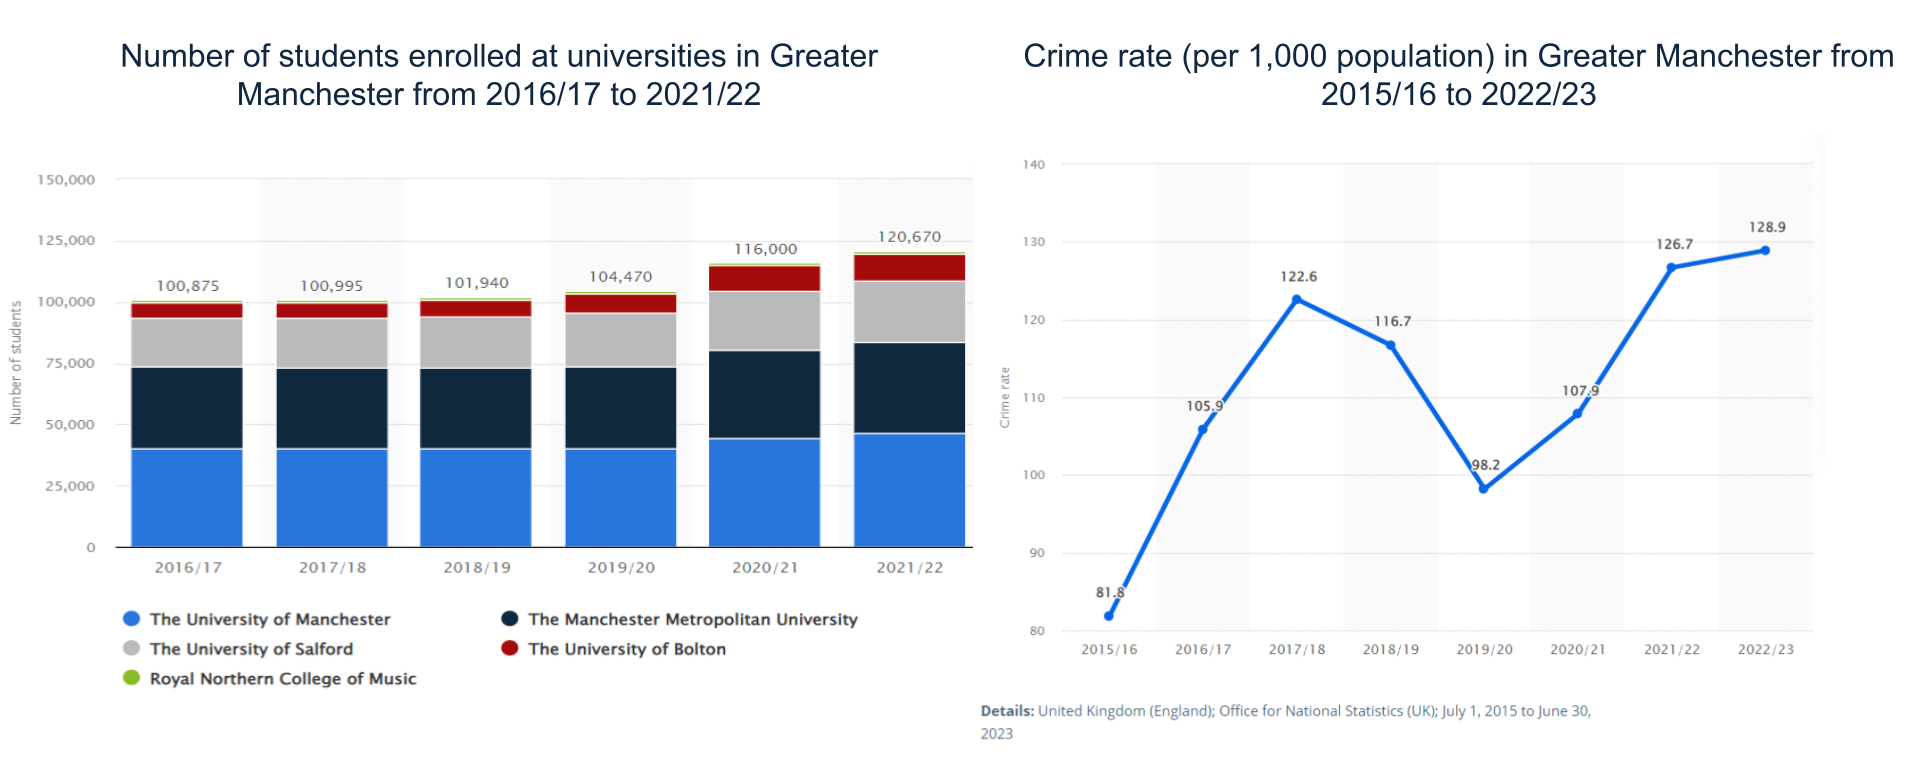
Project Sentinel embarks on a mission to examine the impact of street lighting on urban safety, particularly in relation to the large student community. This initiative is of crucial importance in Greater Manchester, where crime rates, particularly relating to violence, burglary, theft, and criminal damage, remain a significant challenge. Our project leverages crime data from 2017 onwards, capturing recent trends and the effects of enhanced crime recording practices by Greater Manchester Police.
This project gains additional relevance considering the broader economic context of Greater Manchester, which generates £56 billion in gross value added annually, reflecting a diverse and growing economy. The region is home to over 105,000 businesses, encompassing a range from micro-enterprises to large corporations, which contributes to its dynamic urban environment. As part of its infrastructure improvement, Greater Manchester has engaged Amey under a significant PFI contract to manage and maintain its street lighting. This effort supports the project’s goal of mapping and optimizing streetlight placement to enhance safety routes for students during their nocturnal commutes.
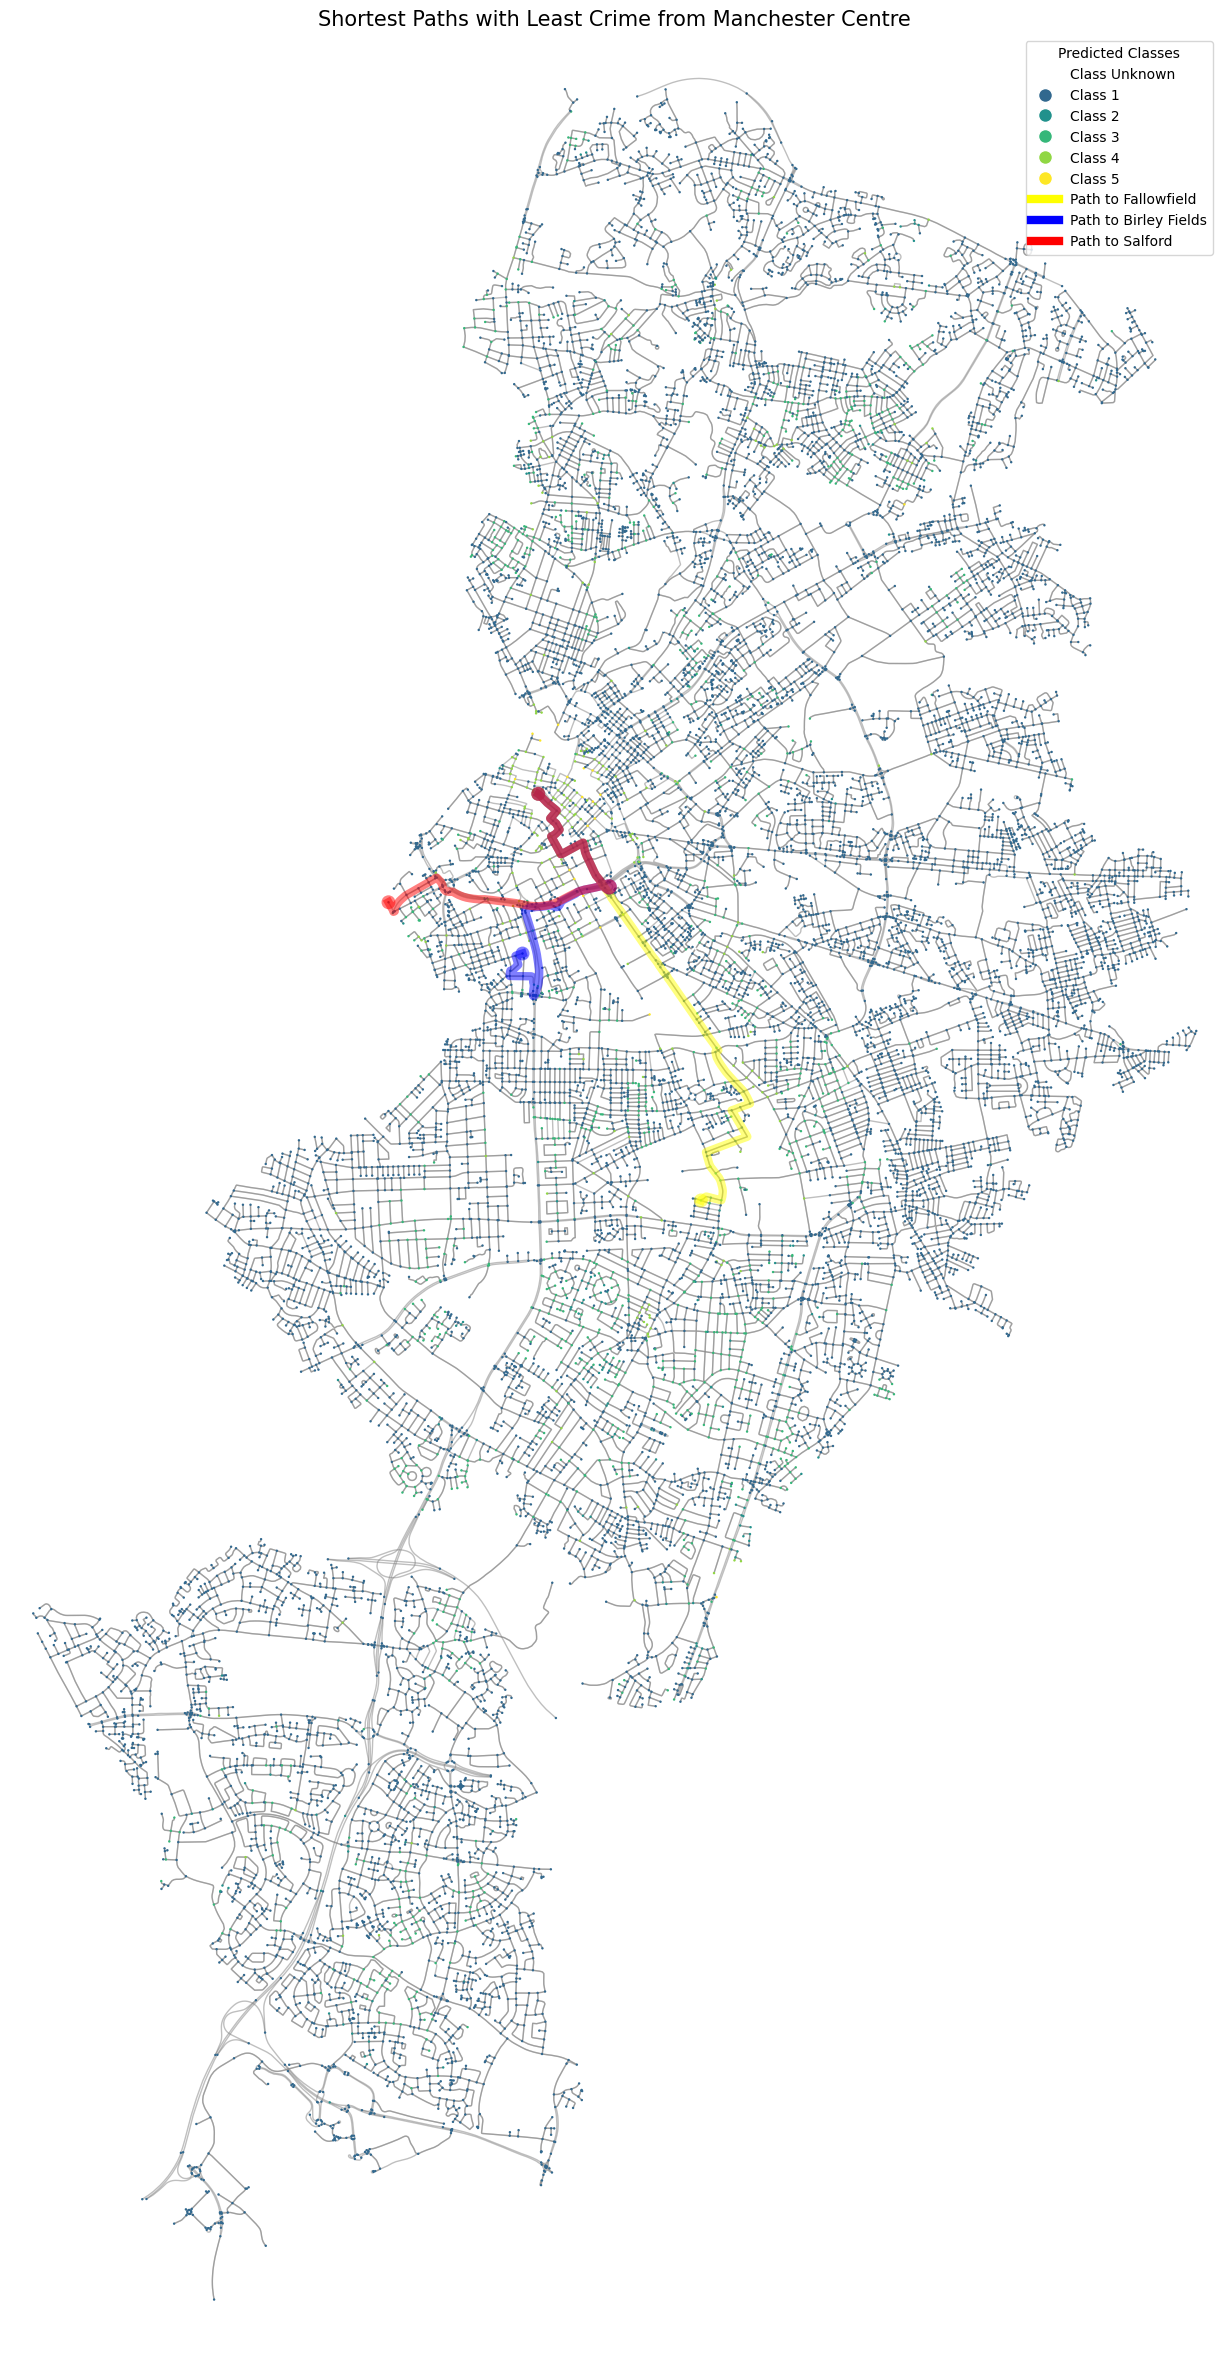
By integrating crime and lighting data with urban demographic and economic variables, Project Sentinel aims to illuminate safer paths for the city’s students, enhancing their night-time security and overall quality of life in one of the UK’s key urban centers.
Utilizing Graph Machine Learning (GML) and Graph Neural Networks (GNNs) for Crime Prediction.
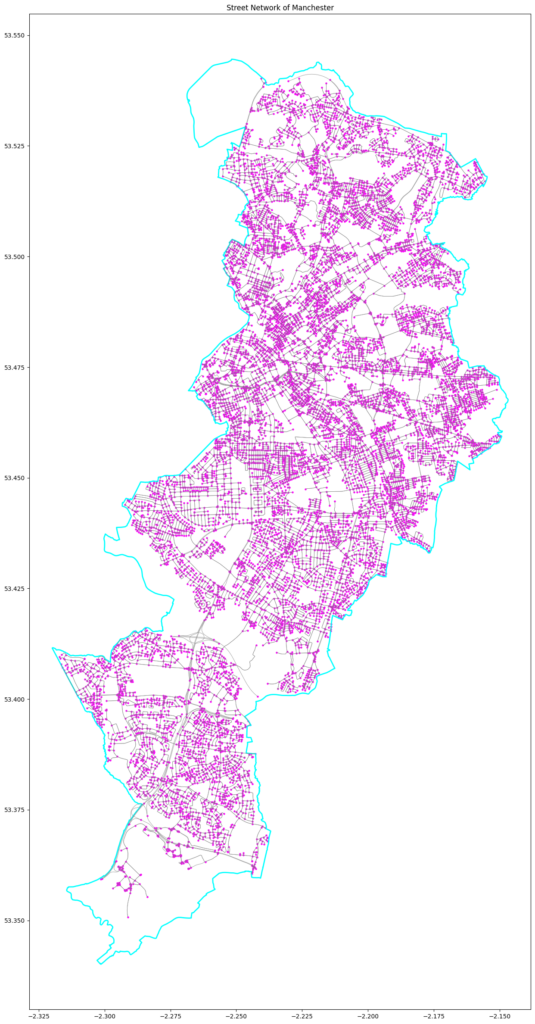
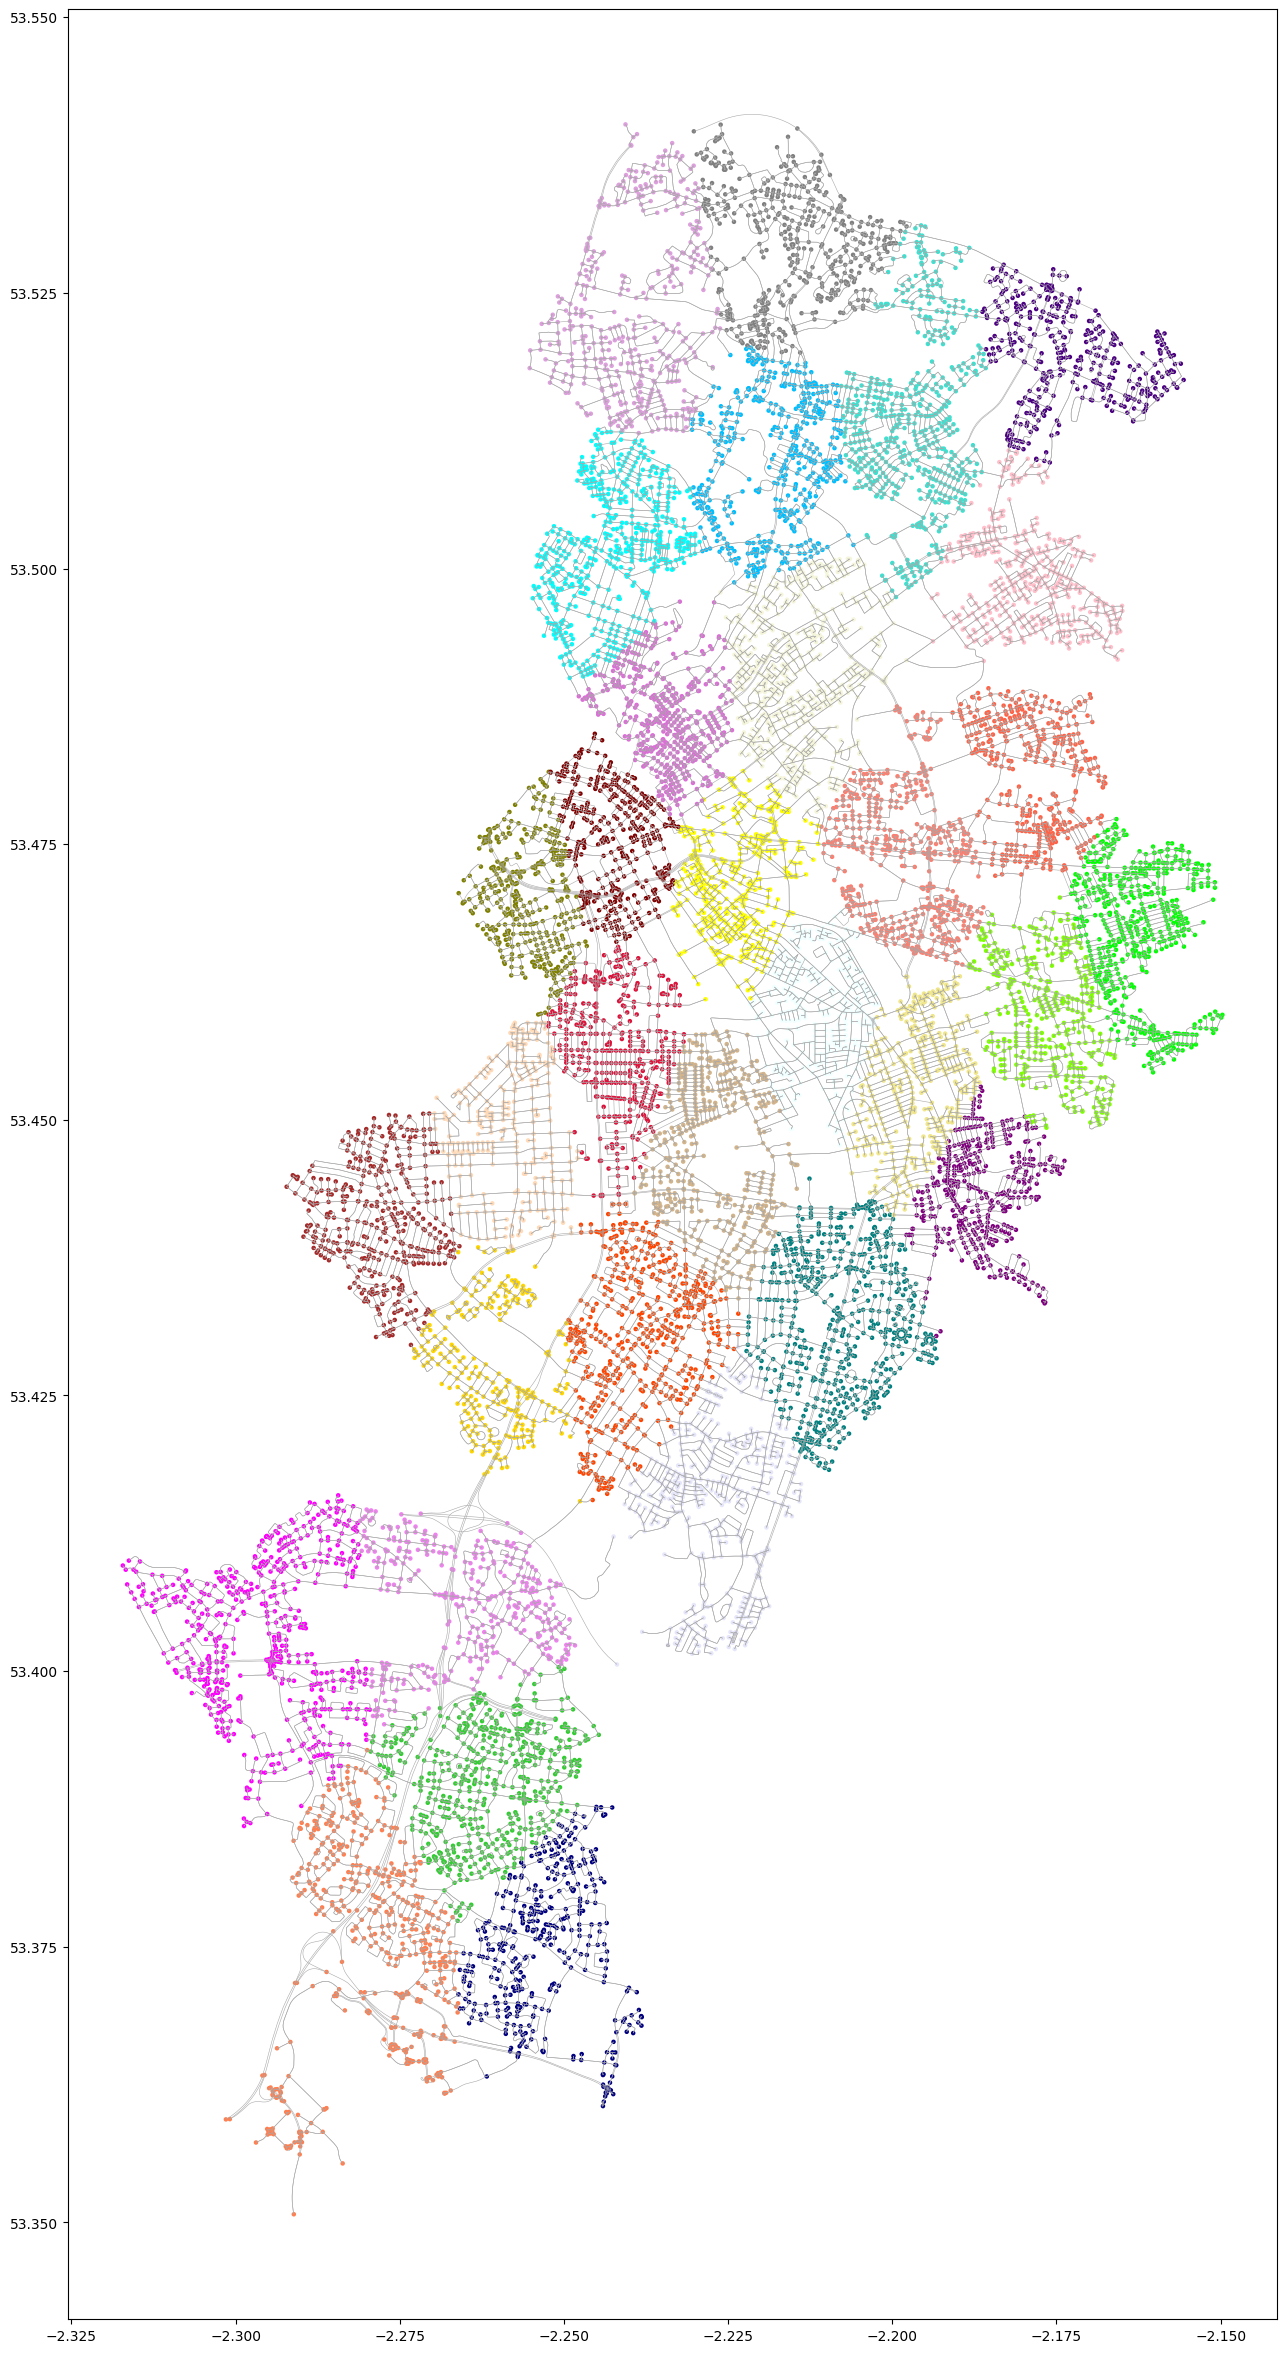
Manchester’s Graph
Graph Machine Learning (GML) and Graph Neural Networks (GNNs) are employed to interpret and predict urban crime dynamics, which are vital to our project’s success.
Suitability of GML and GNNs:
Structured Data Representation: Greater Manchester’s urban environment is ideally modelled as a graph. Nodes are used to map entities such as streetlights, CCTV cameras and city segments, while edges correspond to pathways, roads, or proximities between these nodes. This graph-based framework is well-suited to GML and GNNs, offering an intuitive approach for modelling complex urban relationships.
Relational Information Capture: GNNs are particularly adept at capturing the interactions and dependencies among interconnected nodes. This capability is crucial for crime prediction, where the security measures of one area may influence adjacent areas. GNNs allow us to model and forecast the effects of infrastructural changes, such as enhanced lighting, on local crime rates.
Dynamic Learning Capability: GNNs dynamically assimilate data, adapting to evolving urban and crime data patterns. This flexibility is essential for maintaining the accuracy of our predictions and assessments over time.
Implementation of GML and GNNs:
Data Integration and Graph Construction: We begin by amalgamating various datasets—crime statistics, street lighting, demographic information, and other relevant infrastructural data—into a comprehensive graph that represents the physical and logical connections within the city.
Feature Engineering: Features such as the IMD (index of multiple deprivation), amenity types (nightlife, commercial, educational), presence of street lighting, and historical crime rates are incorporated to educate the GNN model on factors influencing crime rates across different city parts.
Model Training: The GNN model is trained using historical data to recognise crime patterns within the urban graph, enabling it to predict future incidents under varied conditions.
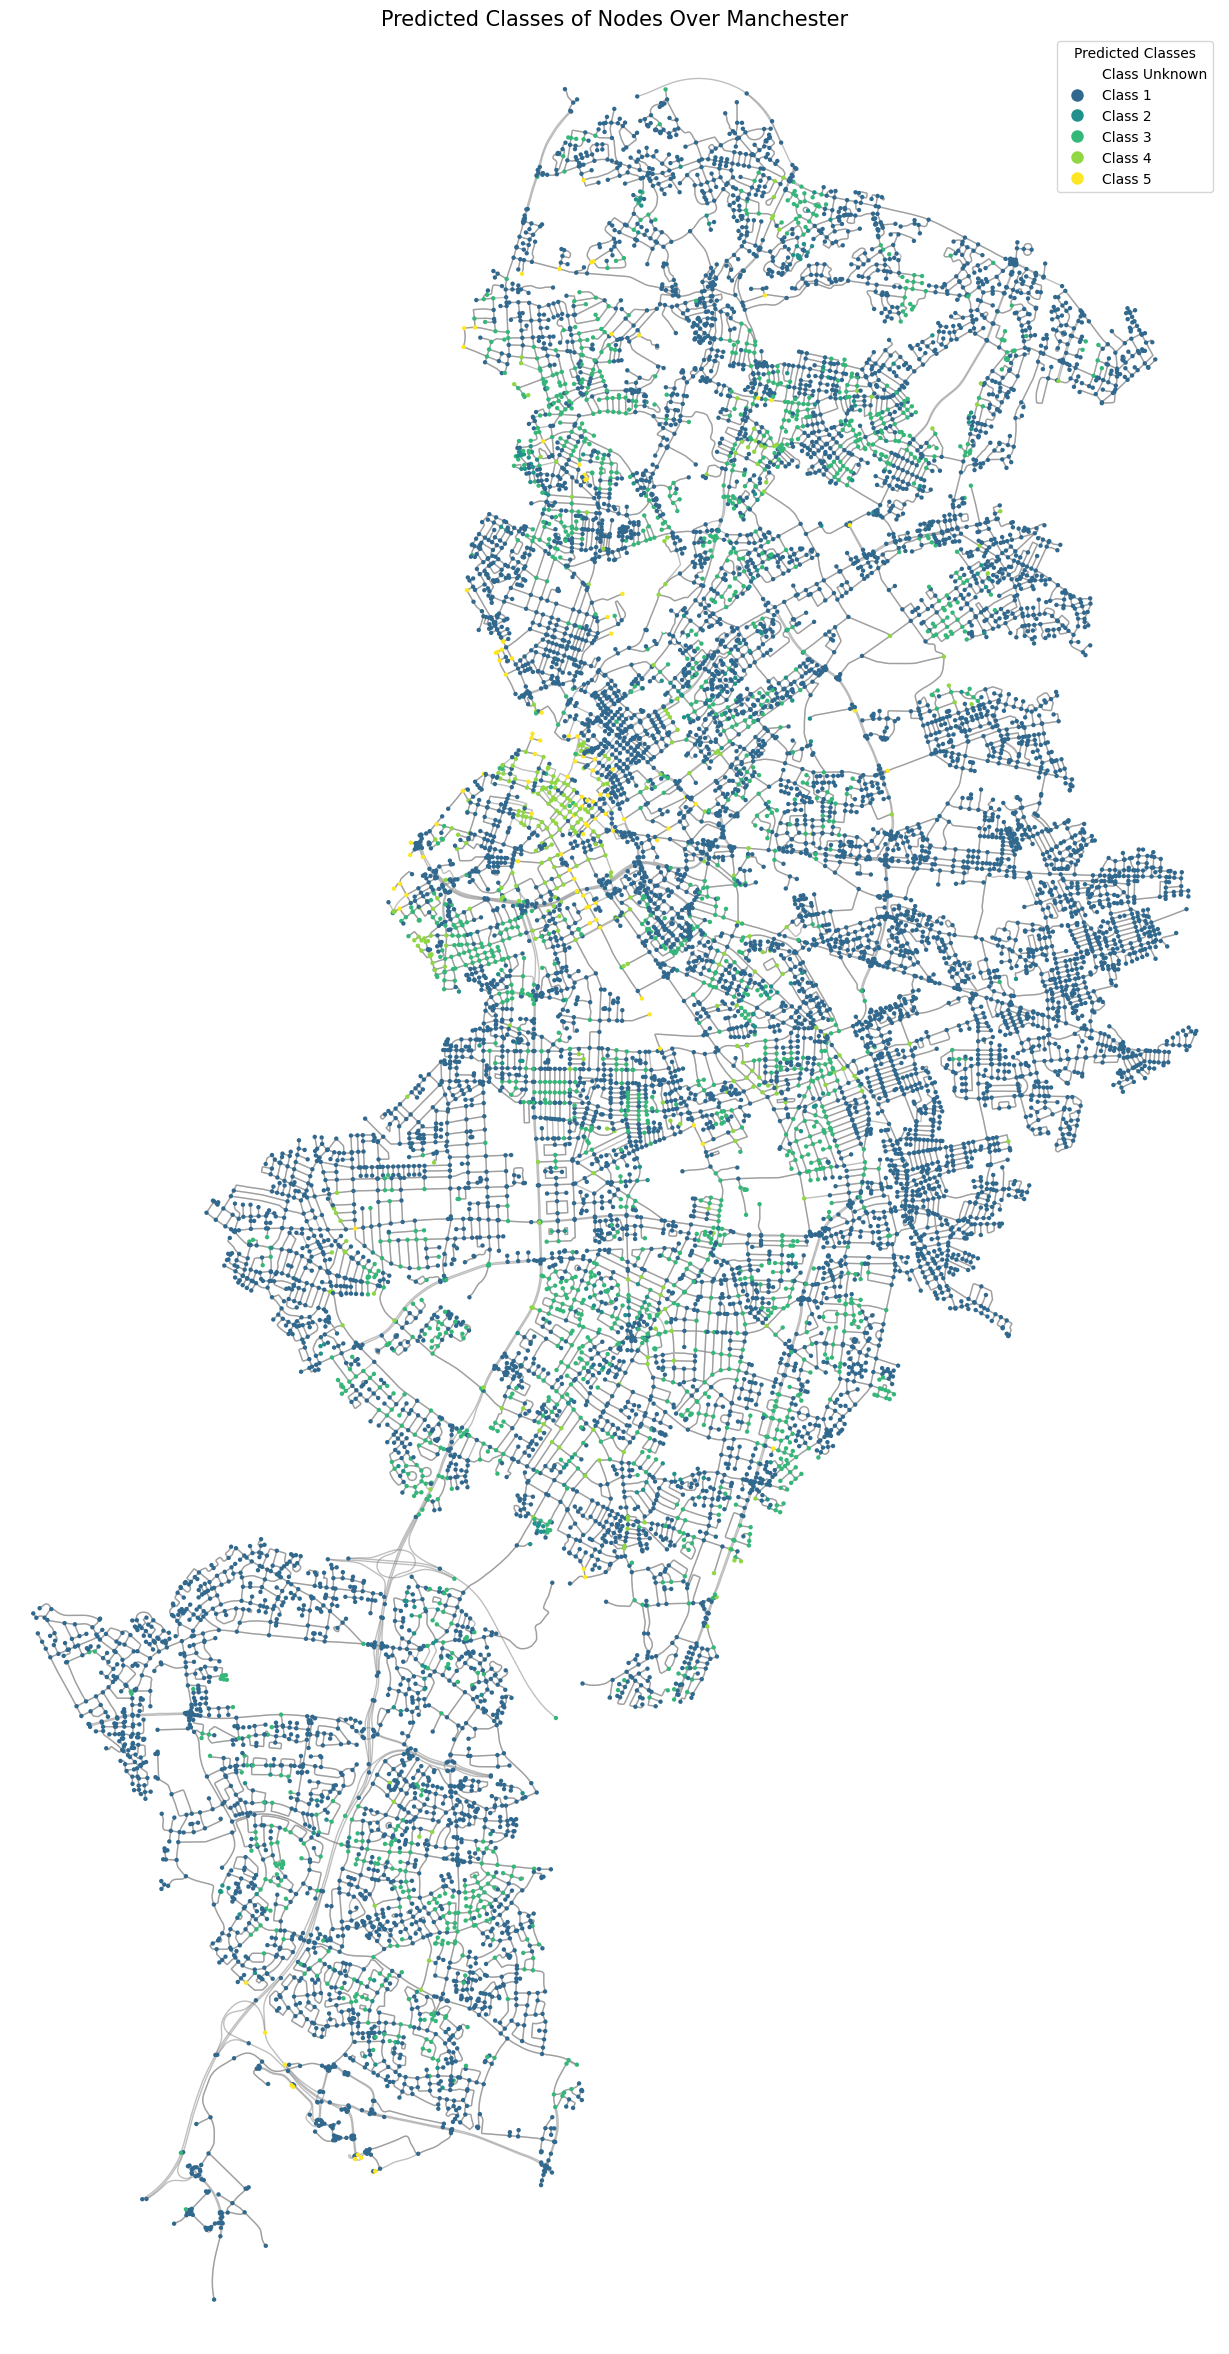
Prediction and Analysis: The trained model predicts crime values for nodes with unknown levels, helping policymakers to prioritise safety measures effectively.
Iterative Learning: The GNN model has the potential to be regularly updated with new data, allowing it to adapt to changing urban dynamics and crime patterns, thus ensuring continued relevance and accuracy.
Datasets
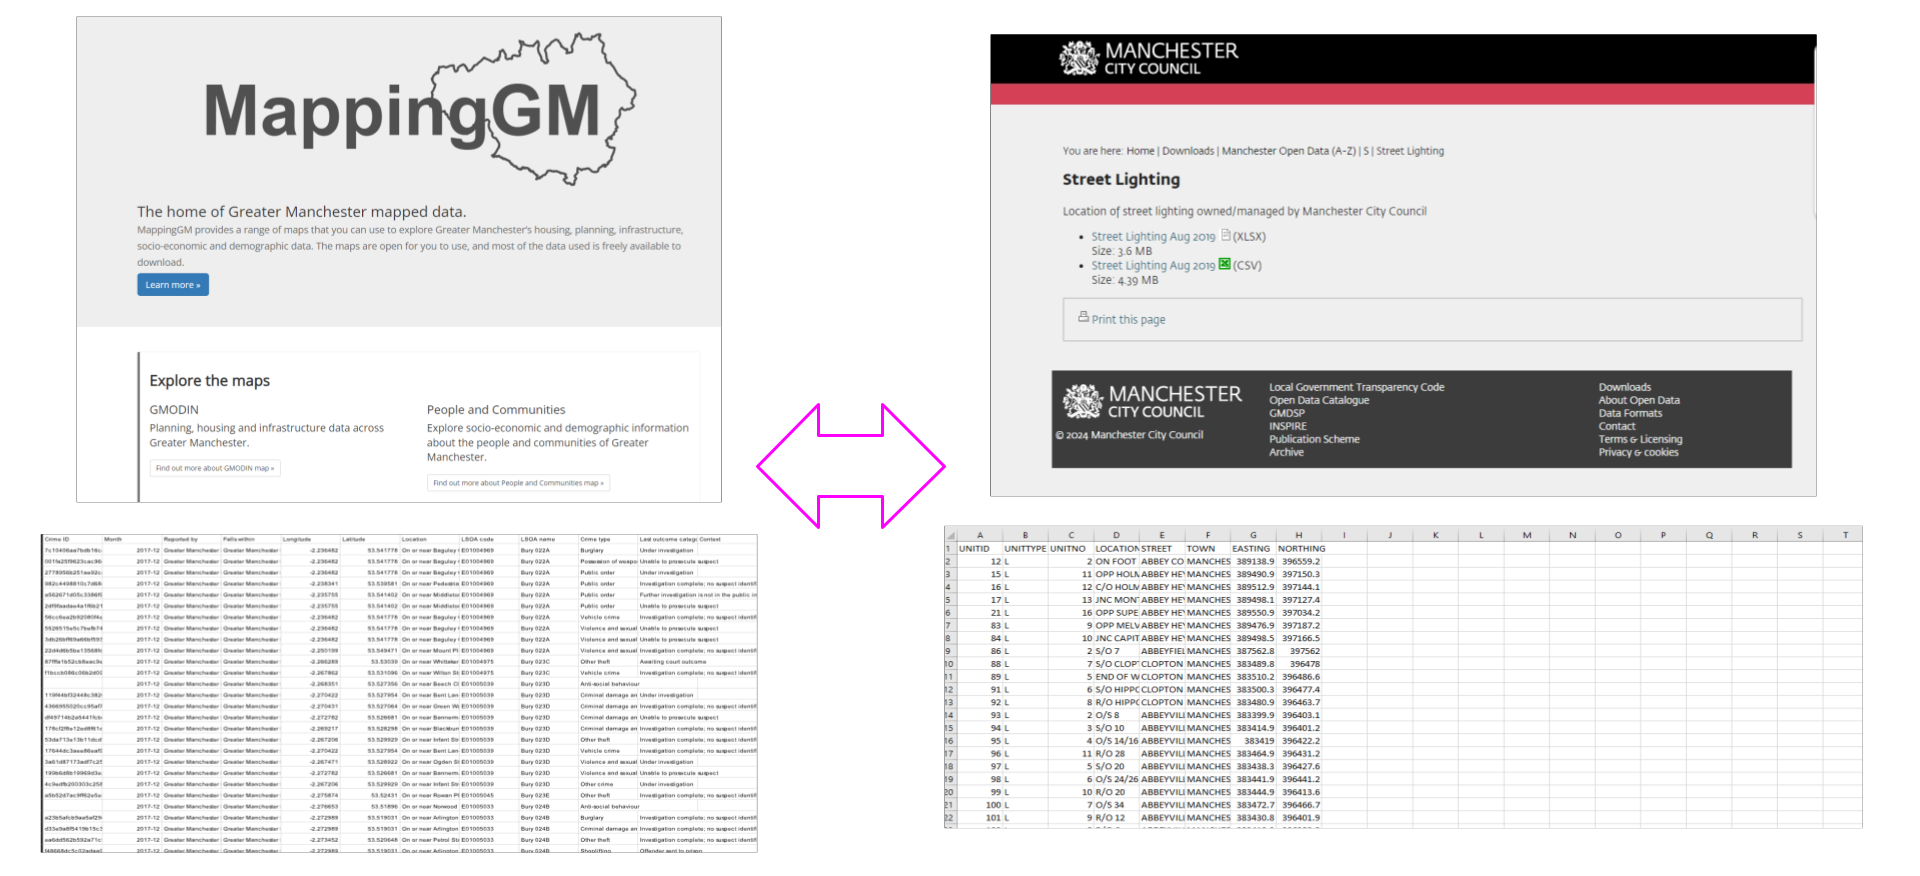
Crime and Street lighting datasets
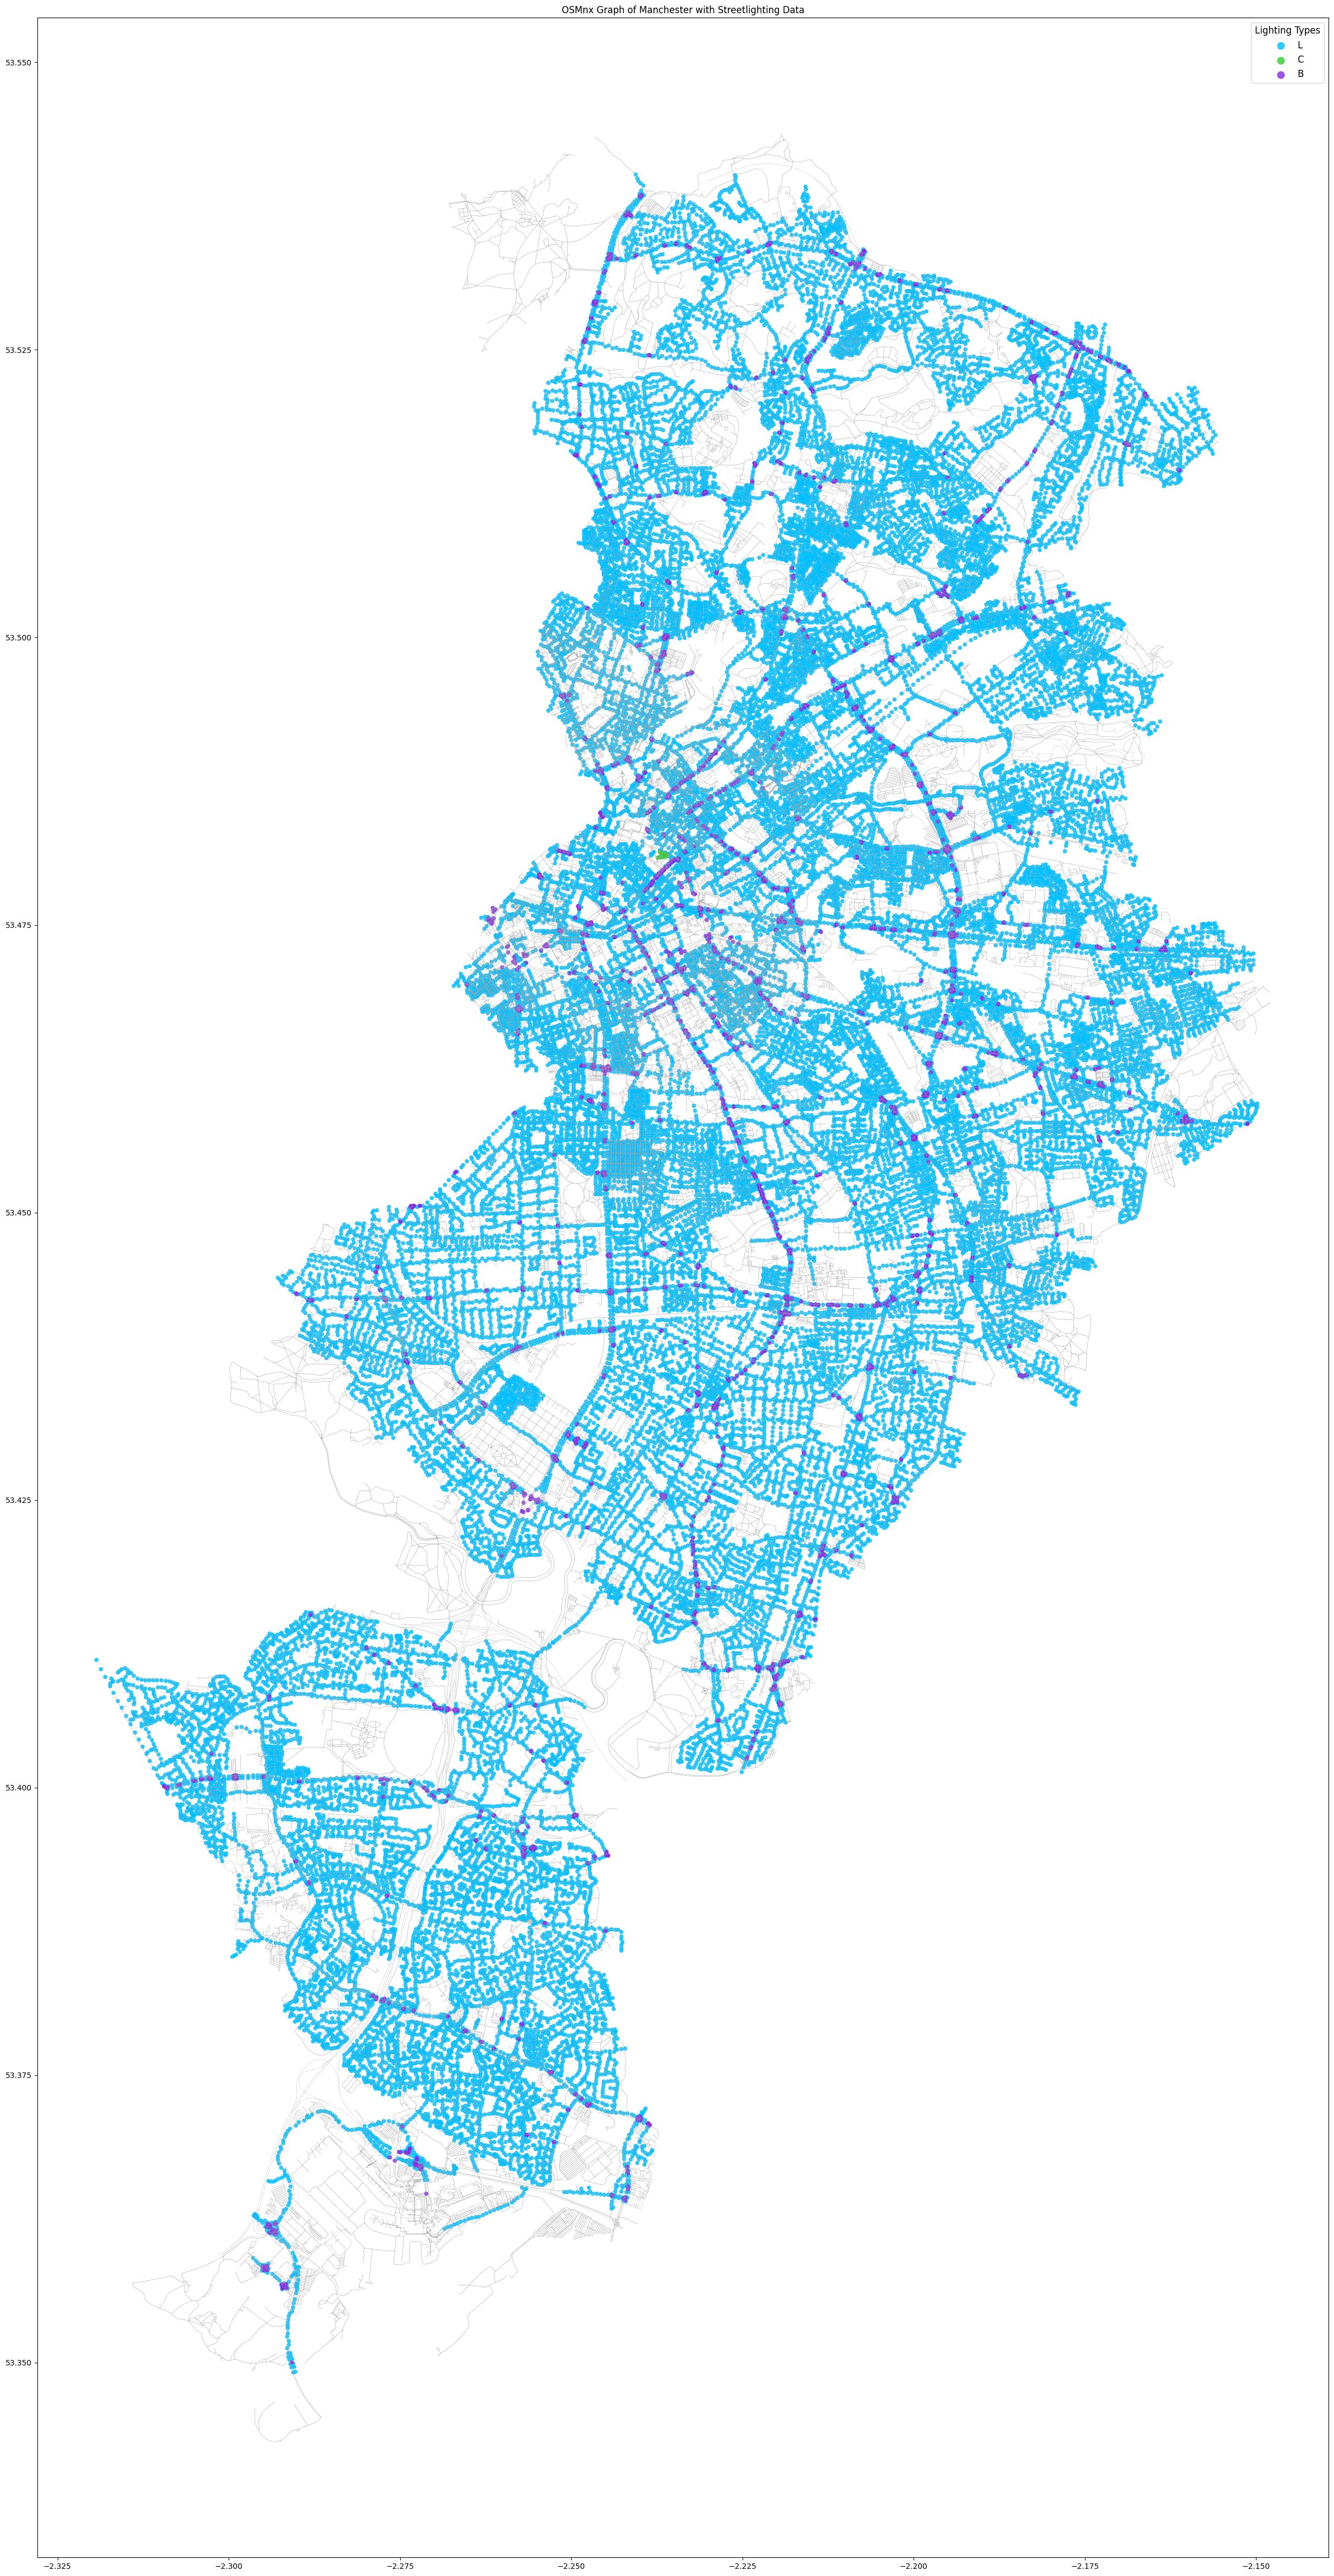
We began by collecting datasets encompassing crime incidents—their types and locations—as well as information on street lighting in Manchester. This information can be found through the Mapping GM website and Manchester’s open data portal.
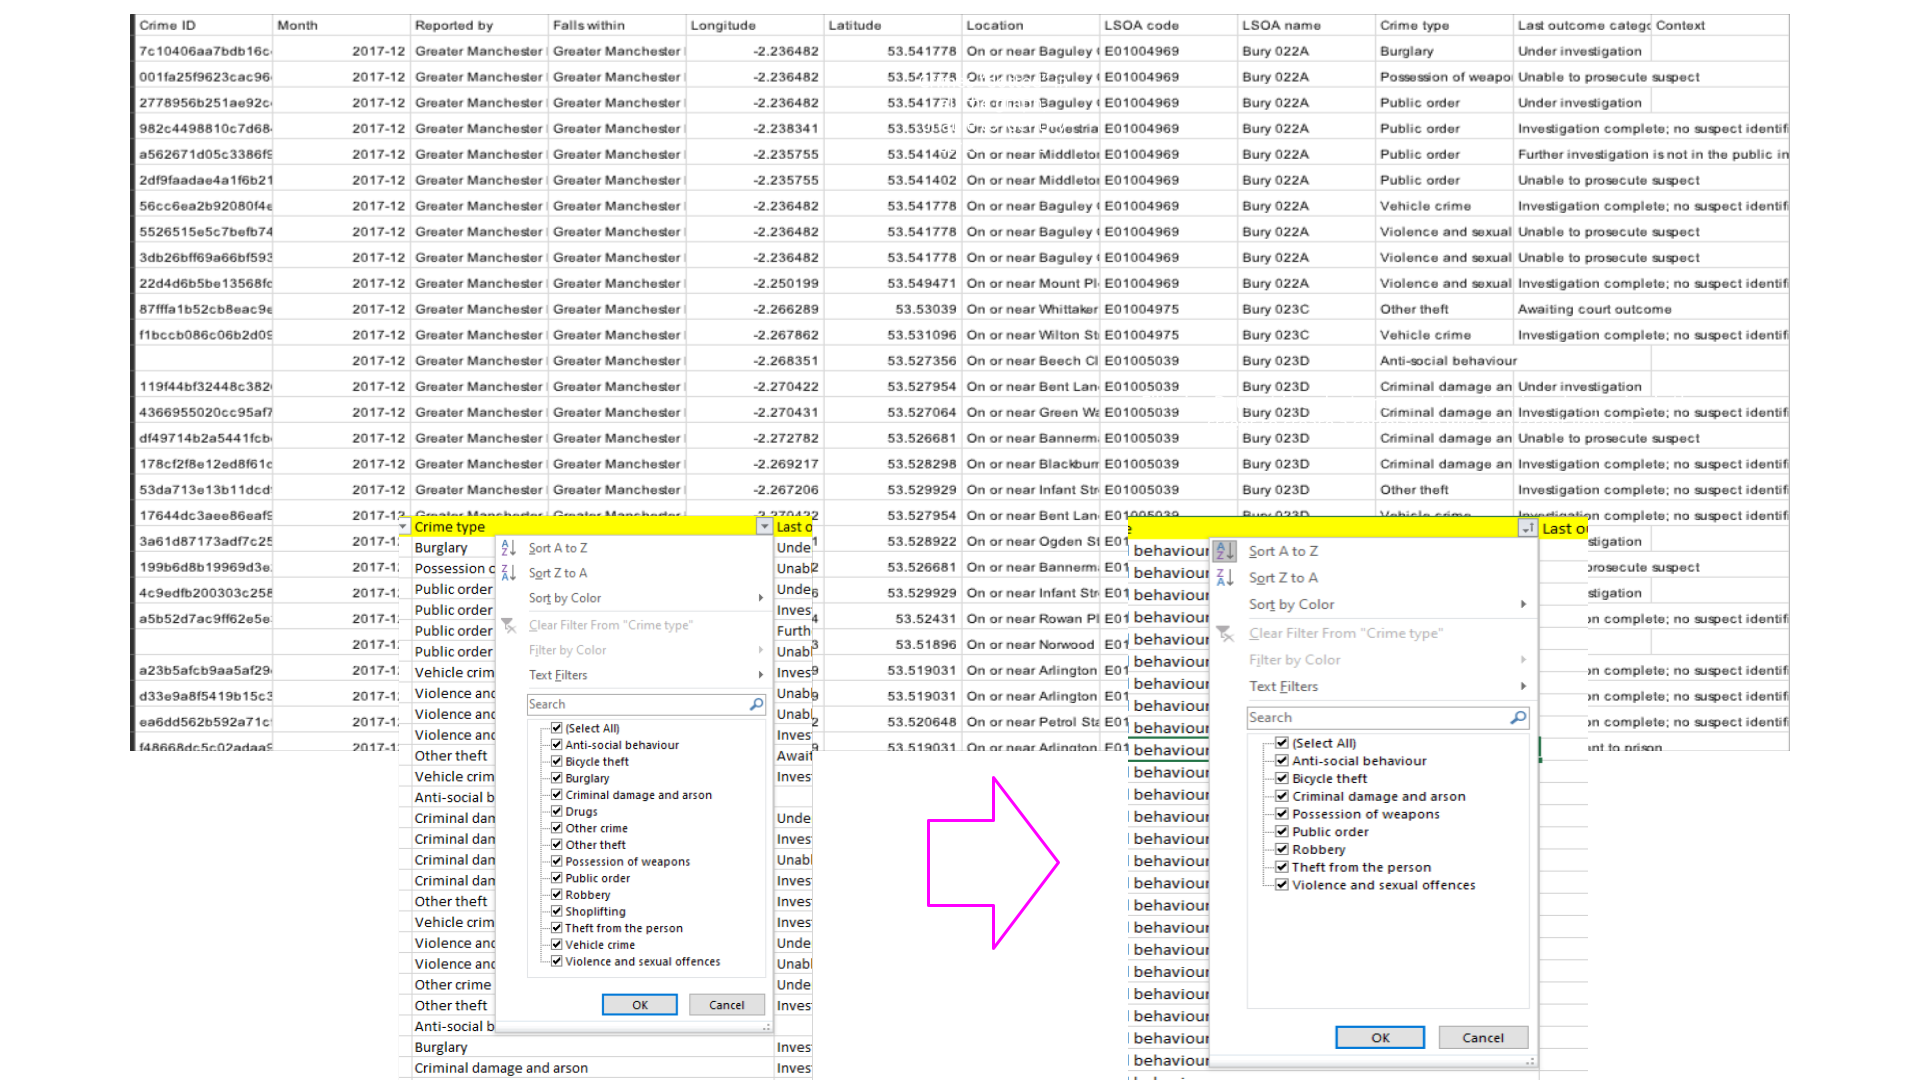
Once the data had been collected, the crime data was filtered in order to eliminate “non street related crimes” and reduce the volume of data being processed.
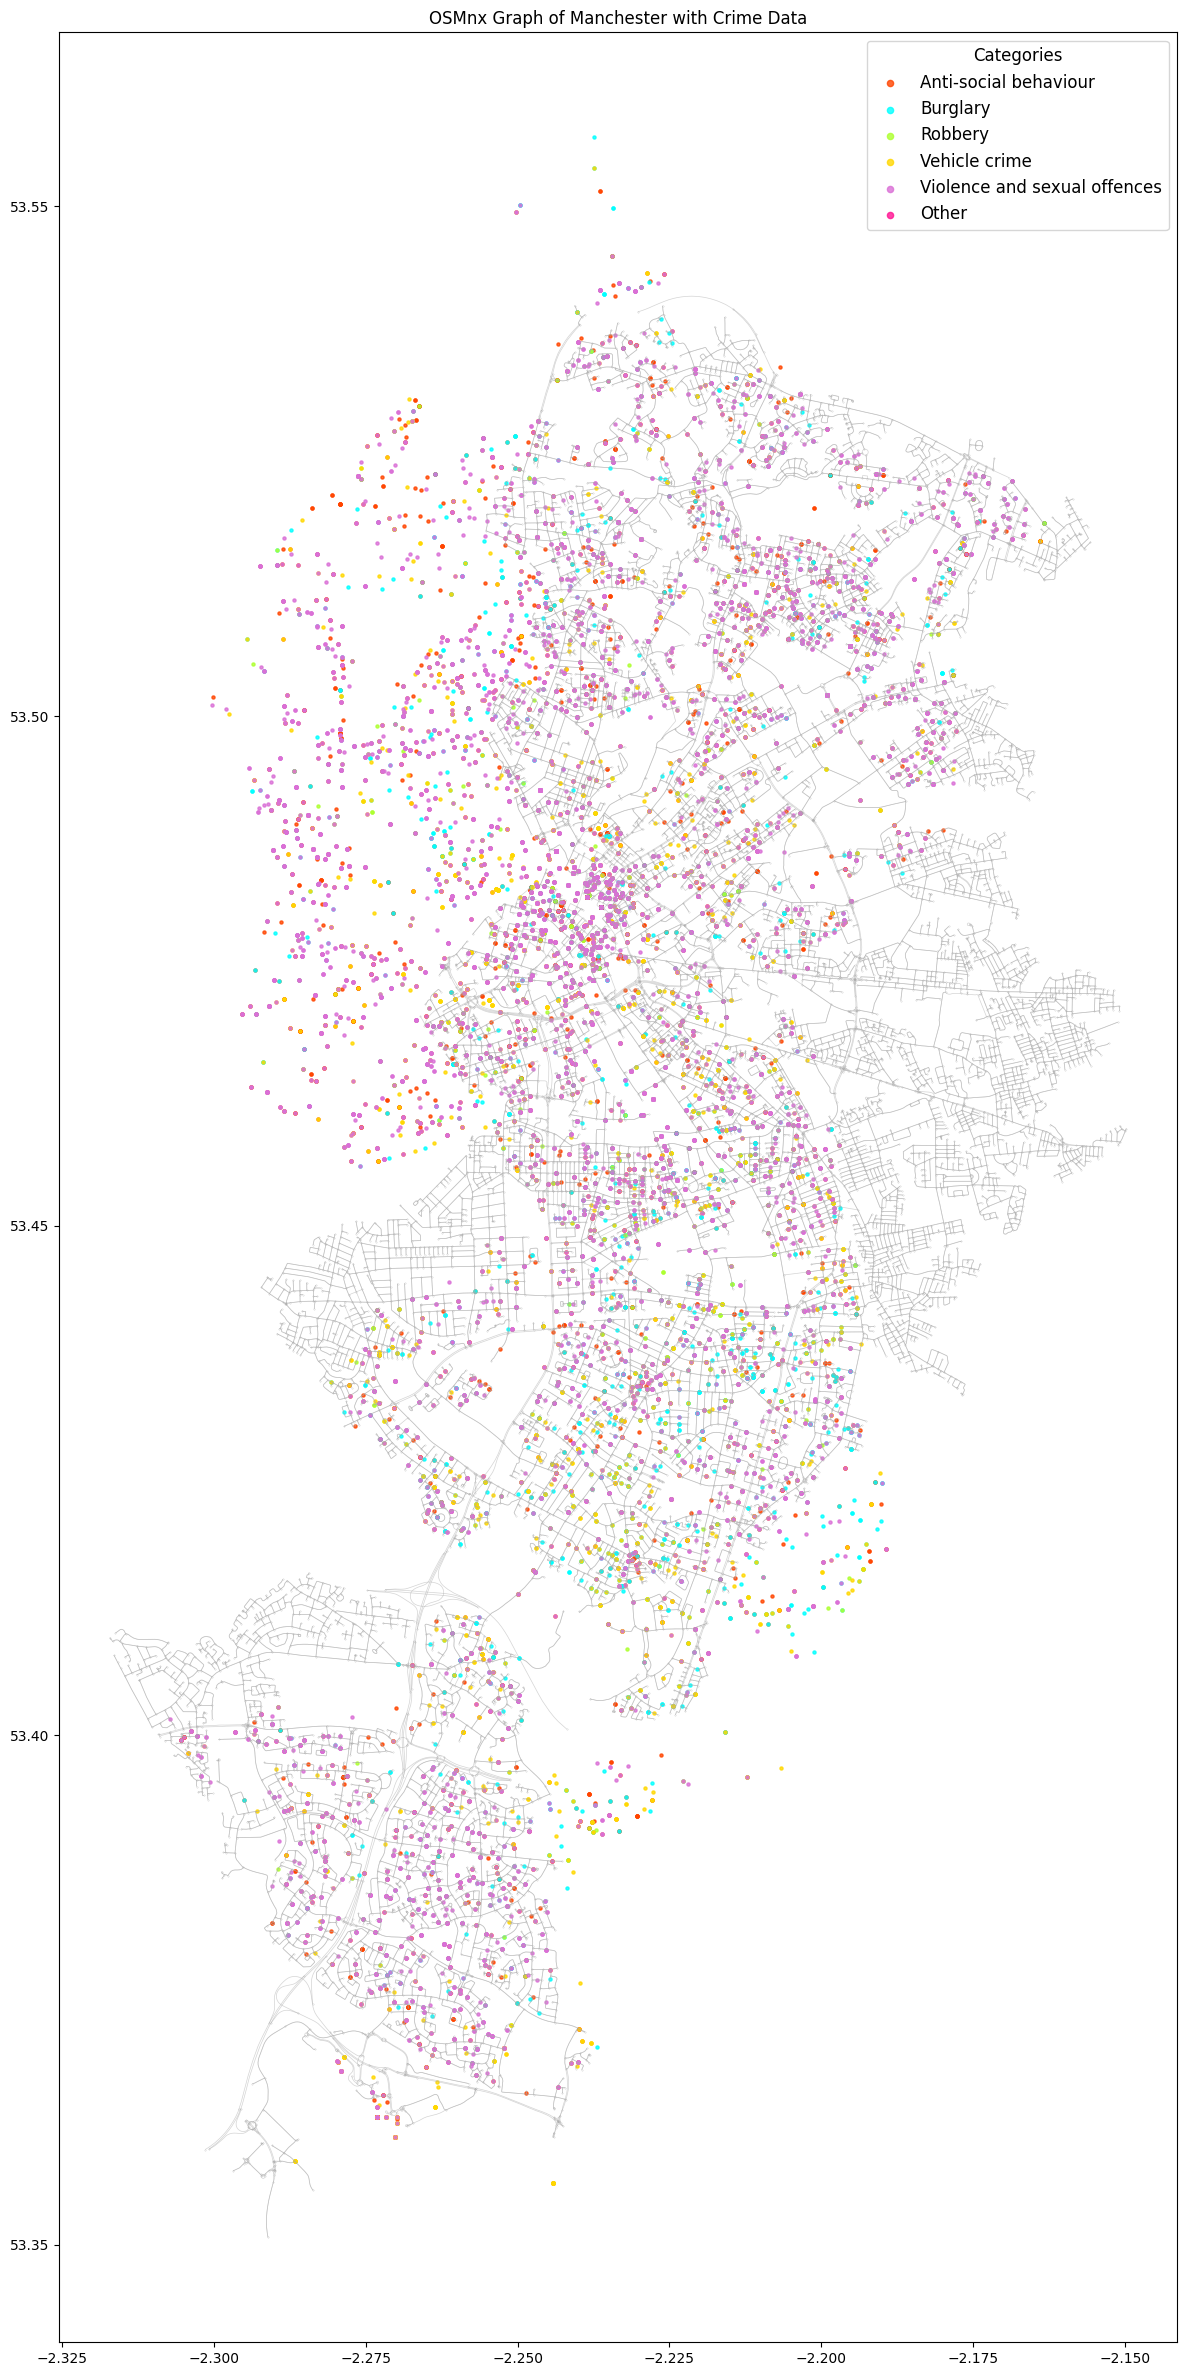
Upon inspection, we observed that some crime data points were located outside Manchester’s boundaries. These outliers were addressed later in the notebook to ensure they did not skew the results.
Before matching both the crime data and the streetlights to the nodes, their coordinates were converted to Shapely points. Upon doing this, we noticed that the coordinates were incorrectly projected. Further investigation revealed that they were not using a Coordinate Reference System (CRS). To correct this, we aligned the CRS with that of the nodes dataframe.
Enriching the Graph
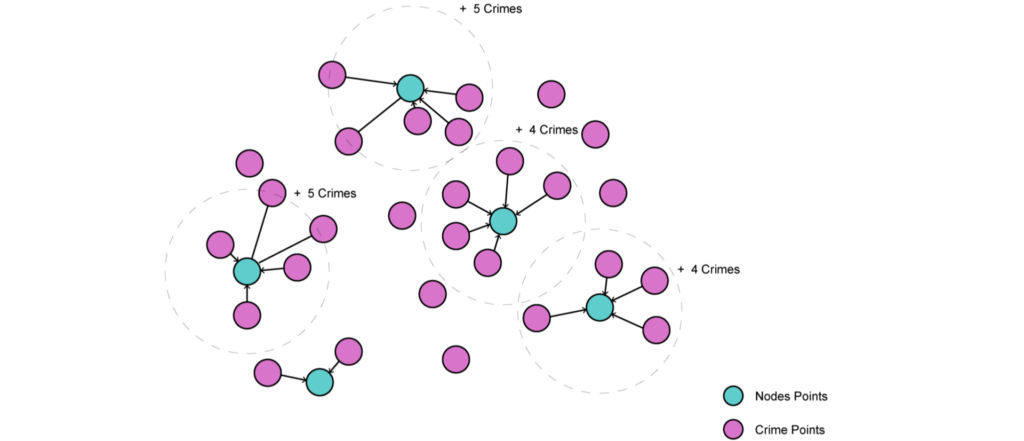
We chose to use closest neighbour analysis to match each crime and streetlight point to their nearest nodes. We then accumulated a count of these points as new attributes for each node.
Correlation matrix and additional datasets
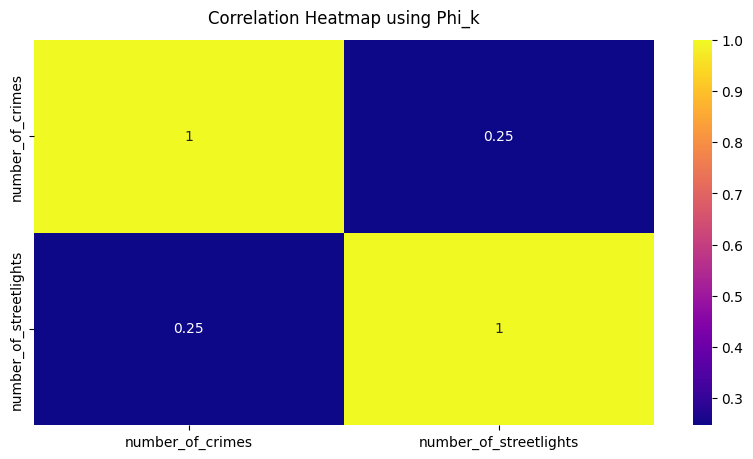
Once nodes had been enriched with the data relating to both the number of crimes and streetlights, we plotted a correlation matrix to understand the relationship between these two datasets.
Additional Attributes
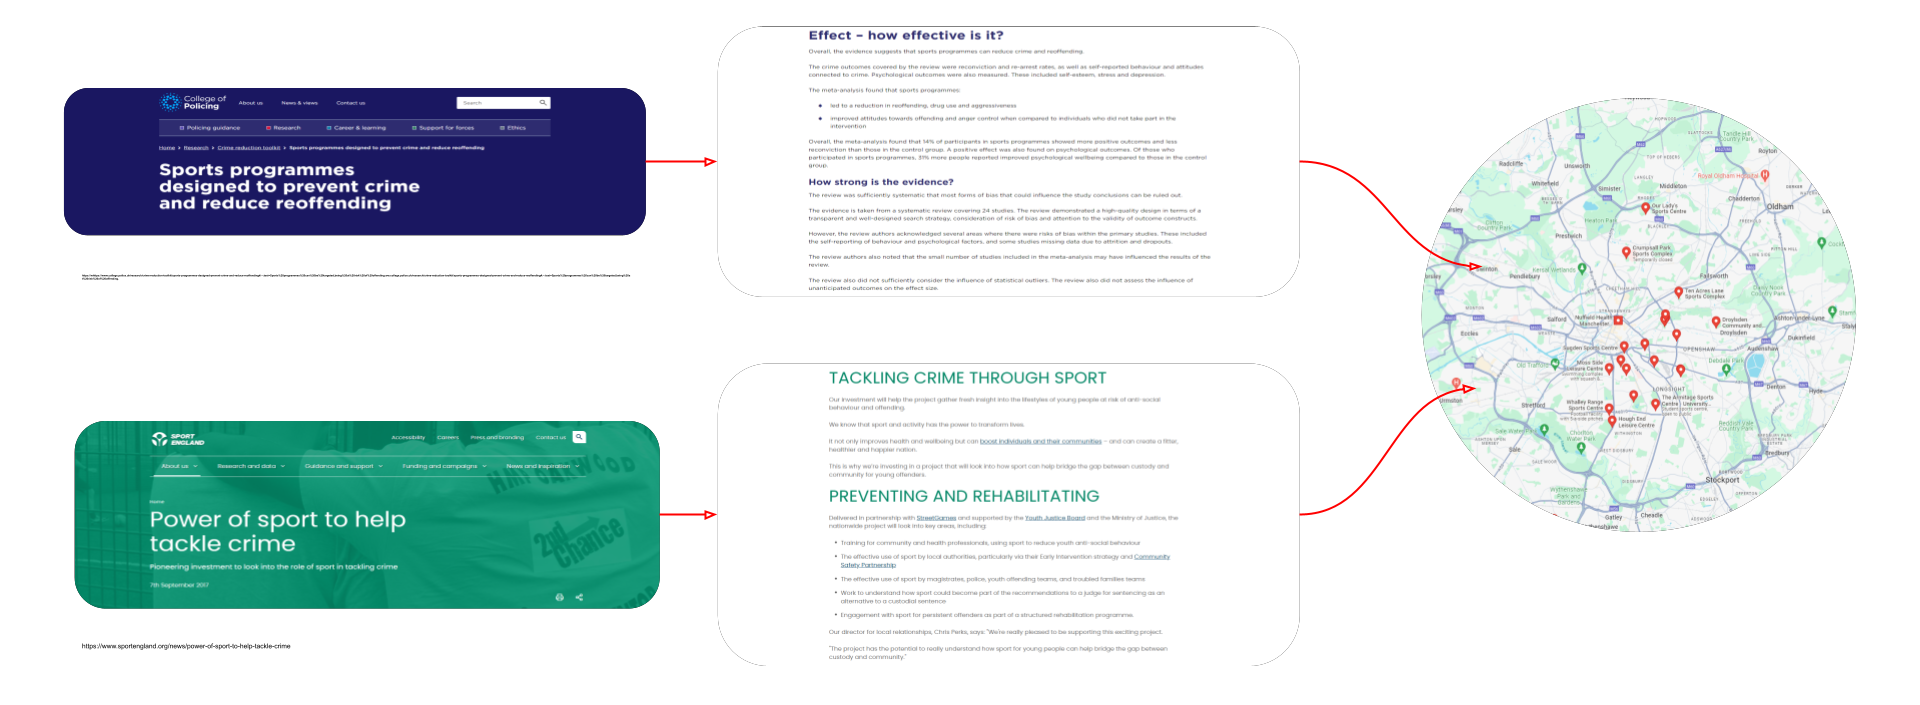
After reviewing the correlation, we realised that we needed to delve deeper than just examining the relationship between lighting and crime. A bit of research led us to several articles and studies that discuss the impact of sports, community centres, and other public facilities in preventing and reducing crime.
We were able to gather information about various types of amenities in Manchester from OpenStreetMap (OSM).
We organised the amenities into the following groups:
- Emergency Services: Police stations, fire stations, and ambulance stations.
- Educational Facilities: Schools, kindergartens, colleges, and universities.
- Health Facilities: Hospitals, pharmacies, and clinics.
- Social Facilities: Community centres, social facilities, and public buildings.
- Leisure and Recreation: Parks, sports centres, and stadiums.
- Nightlife: Bars and nightclubs.
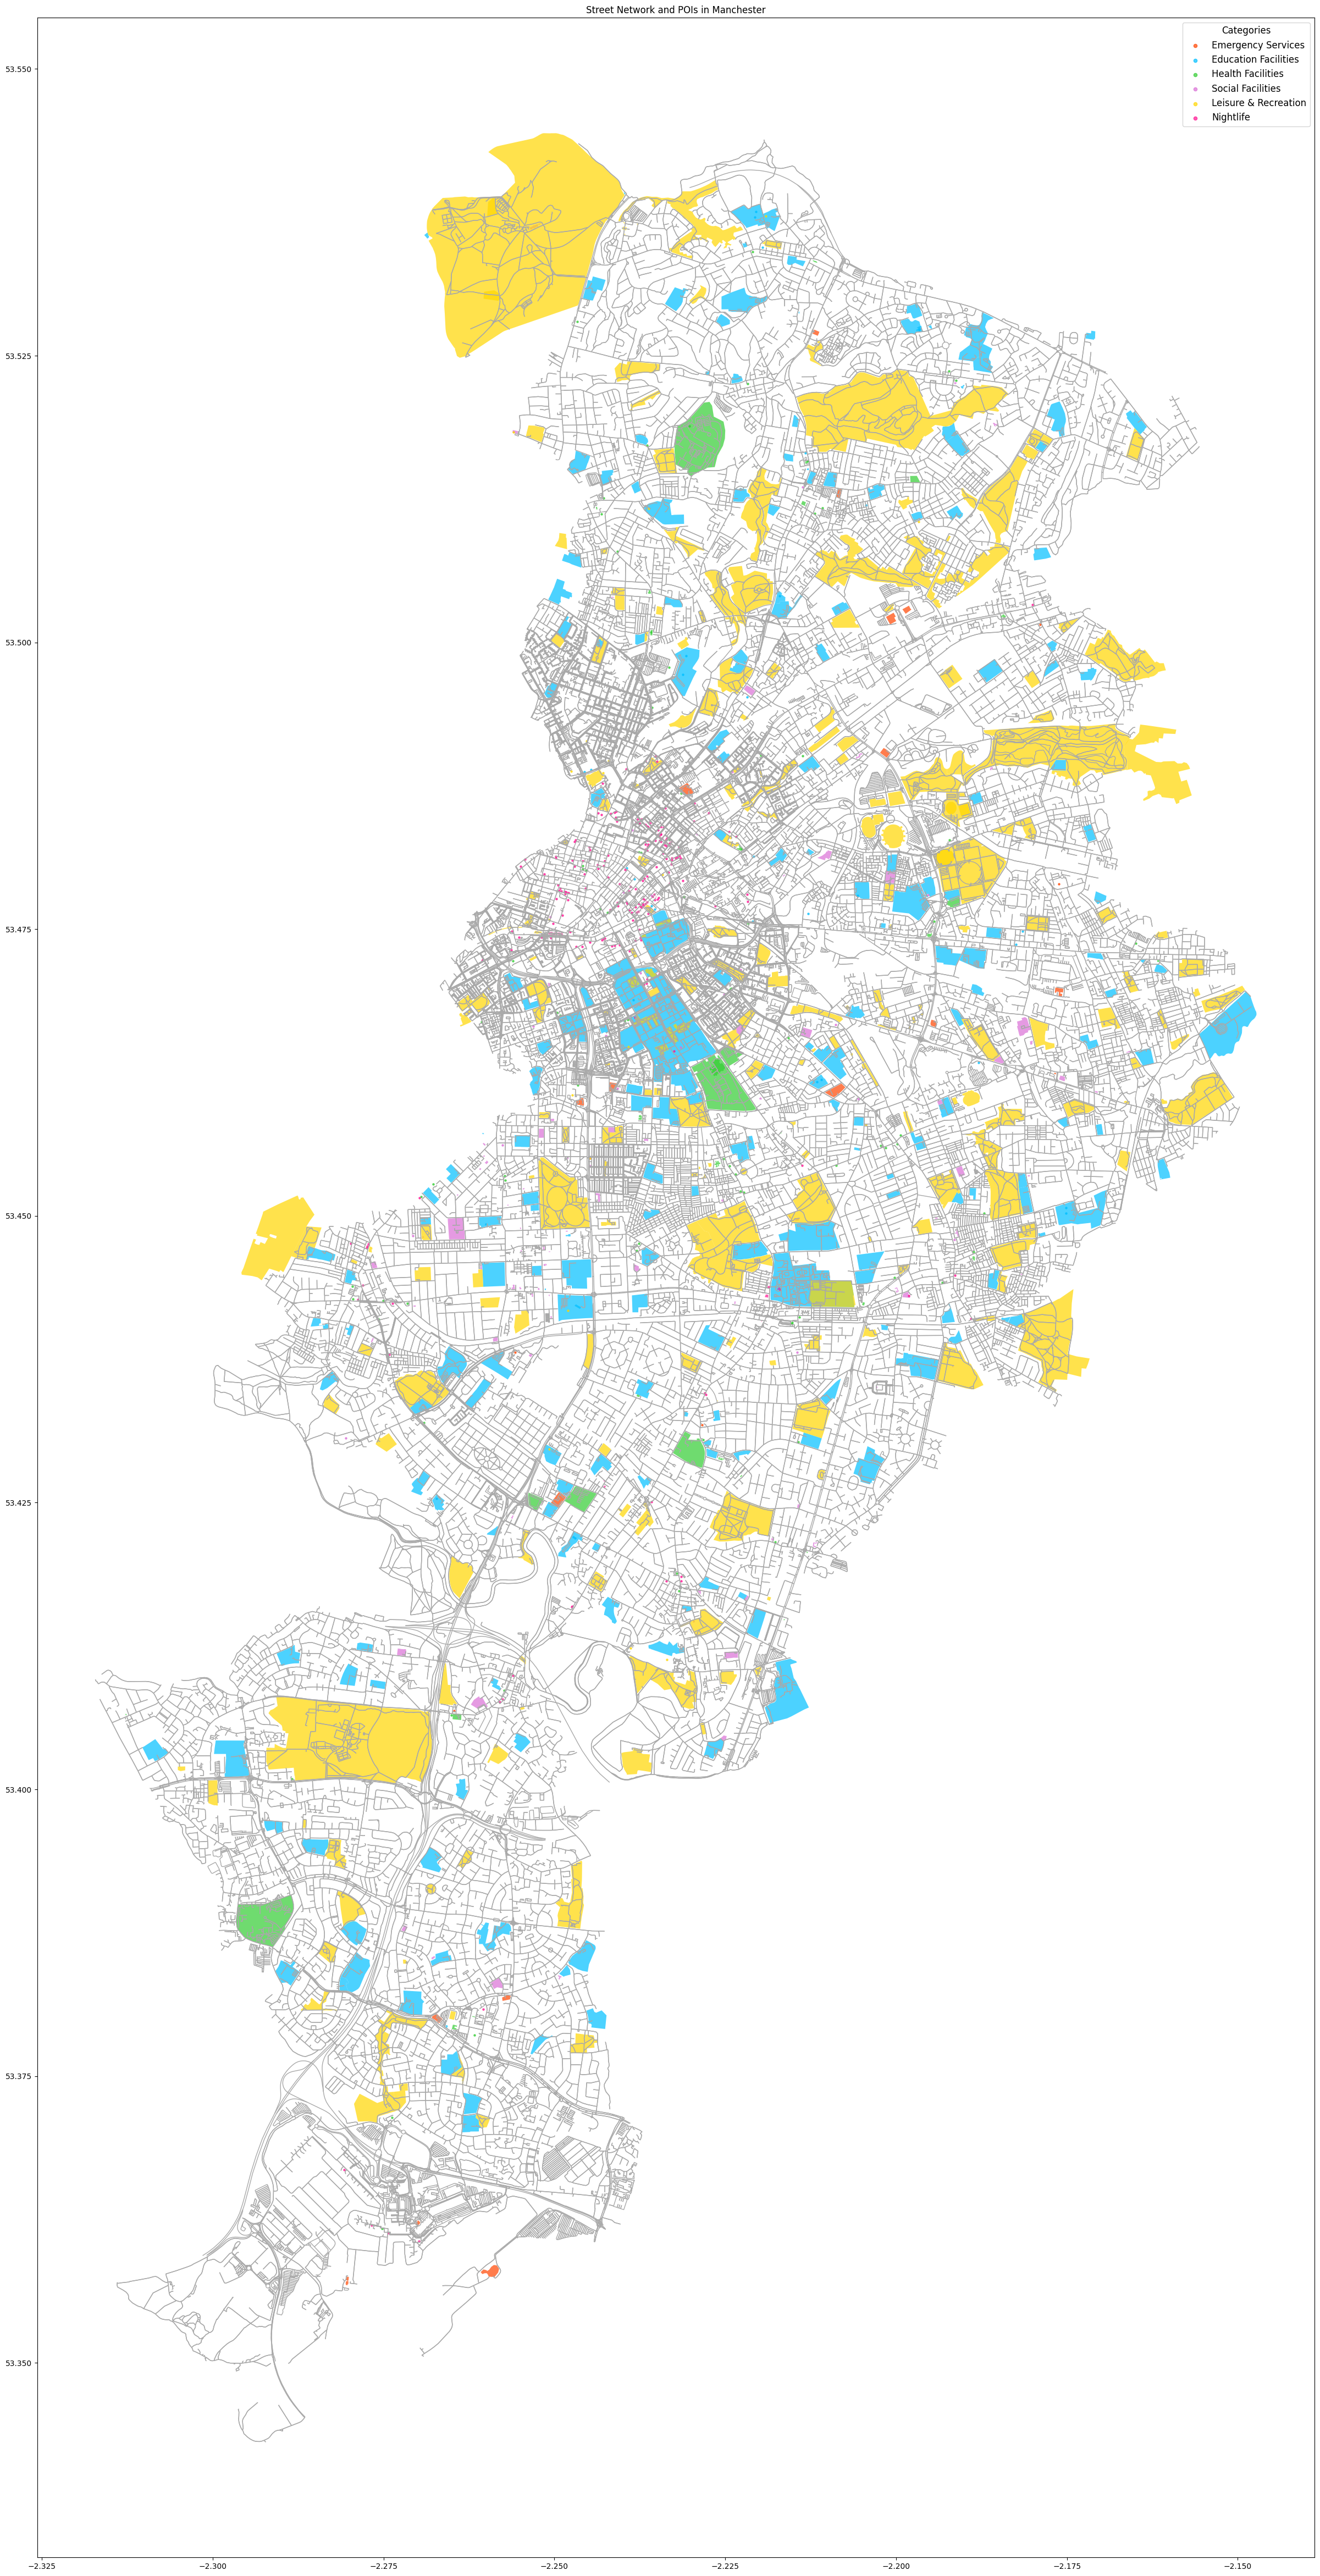
The centre of each polygon was then determined and used to create a new point-based dataframe.
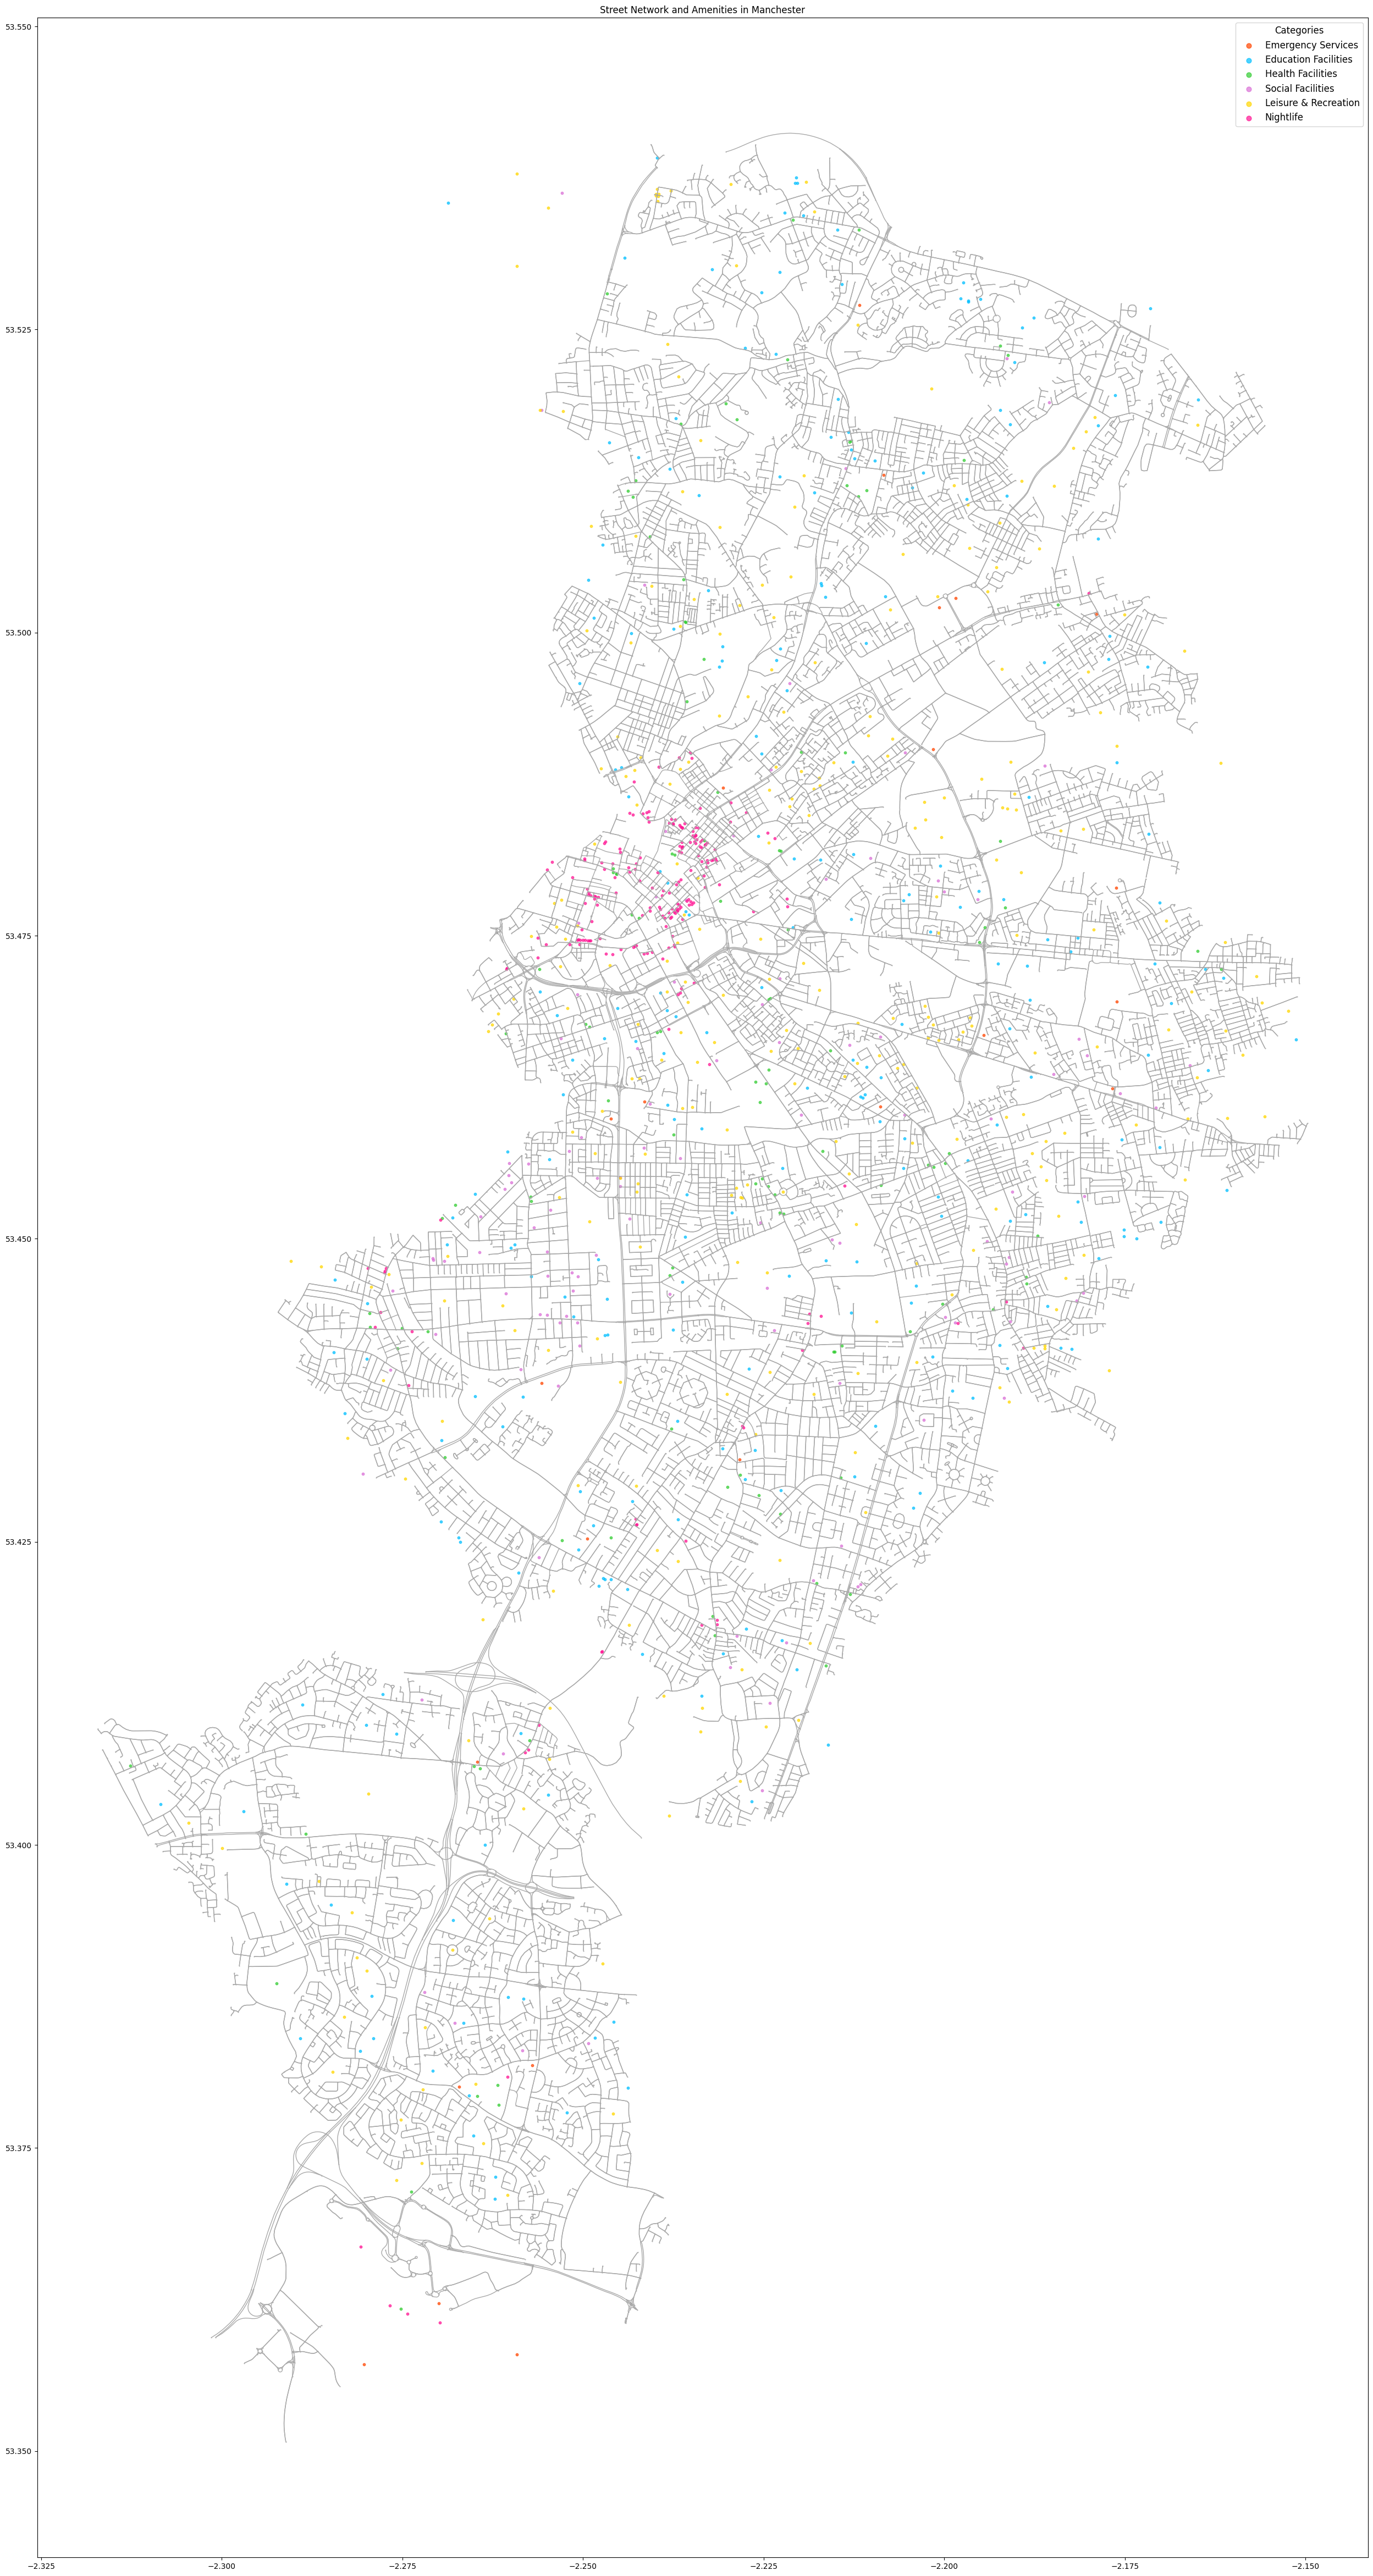
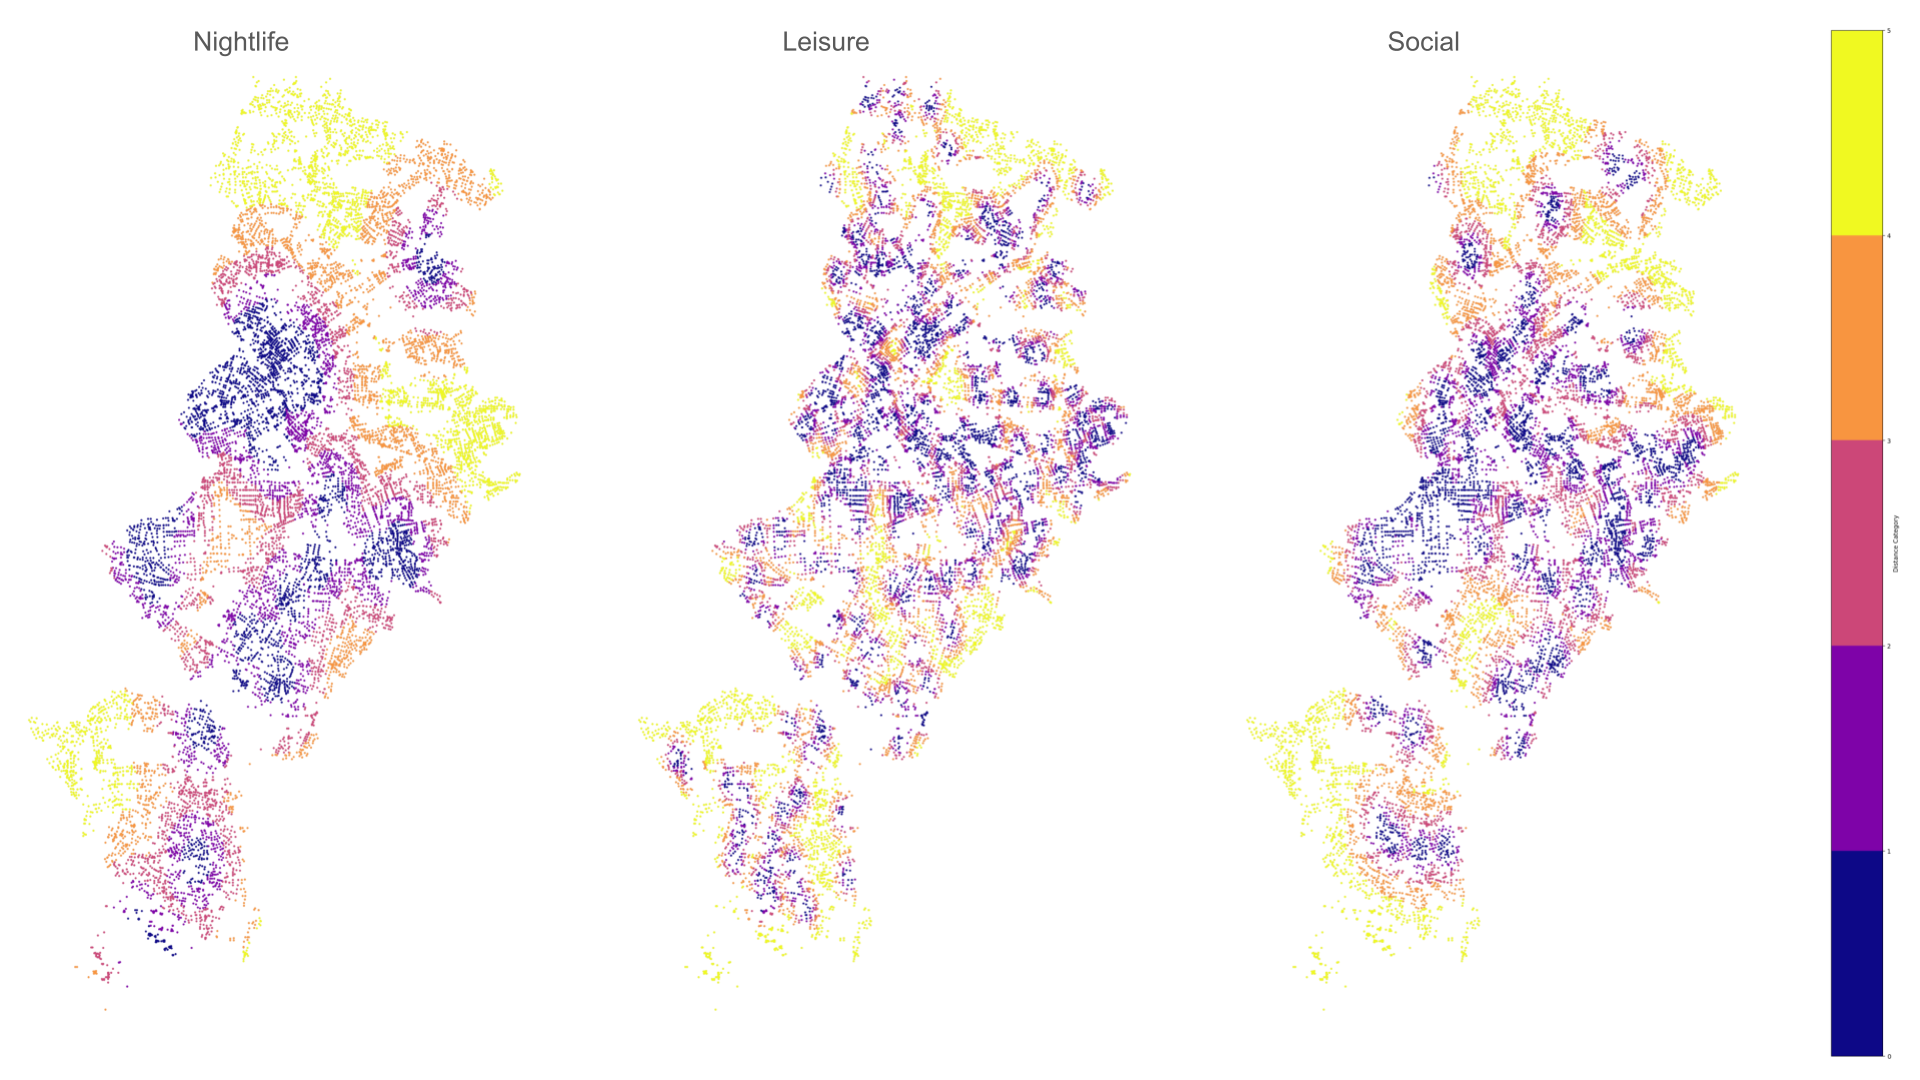
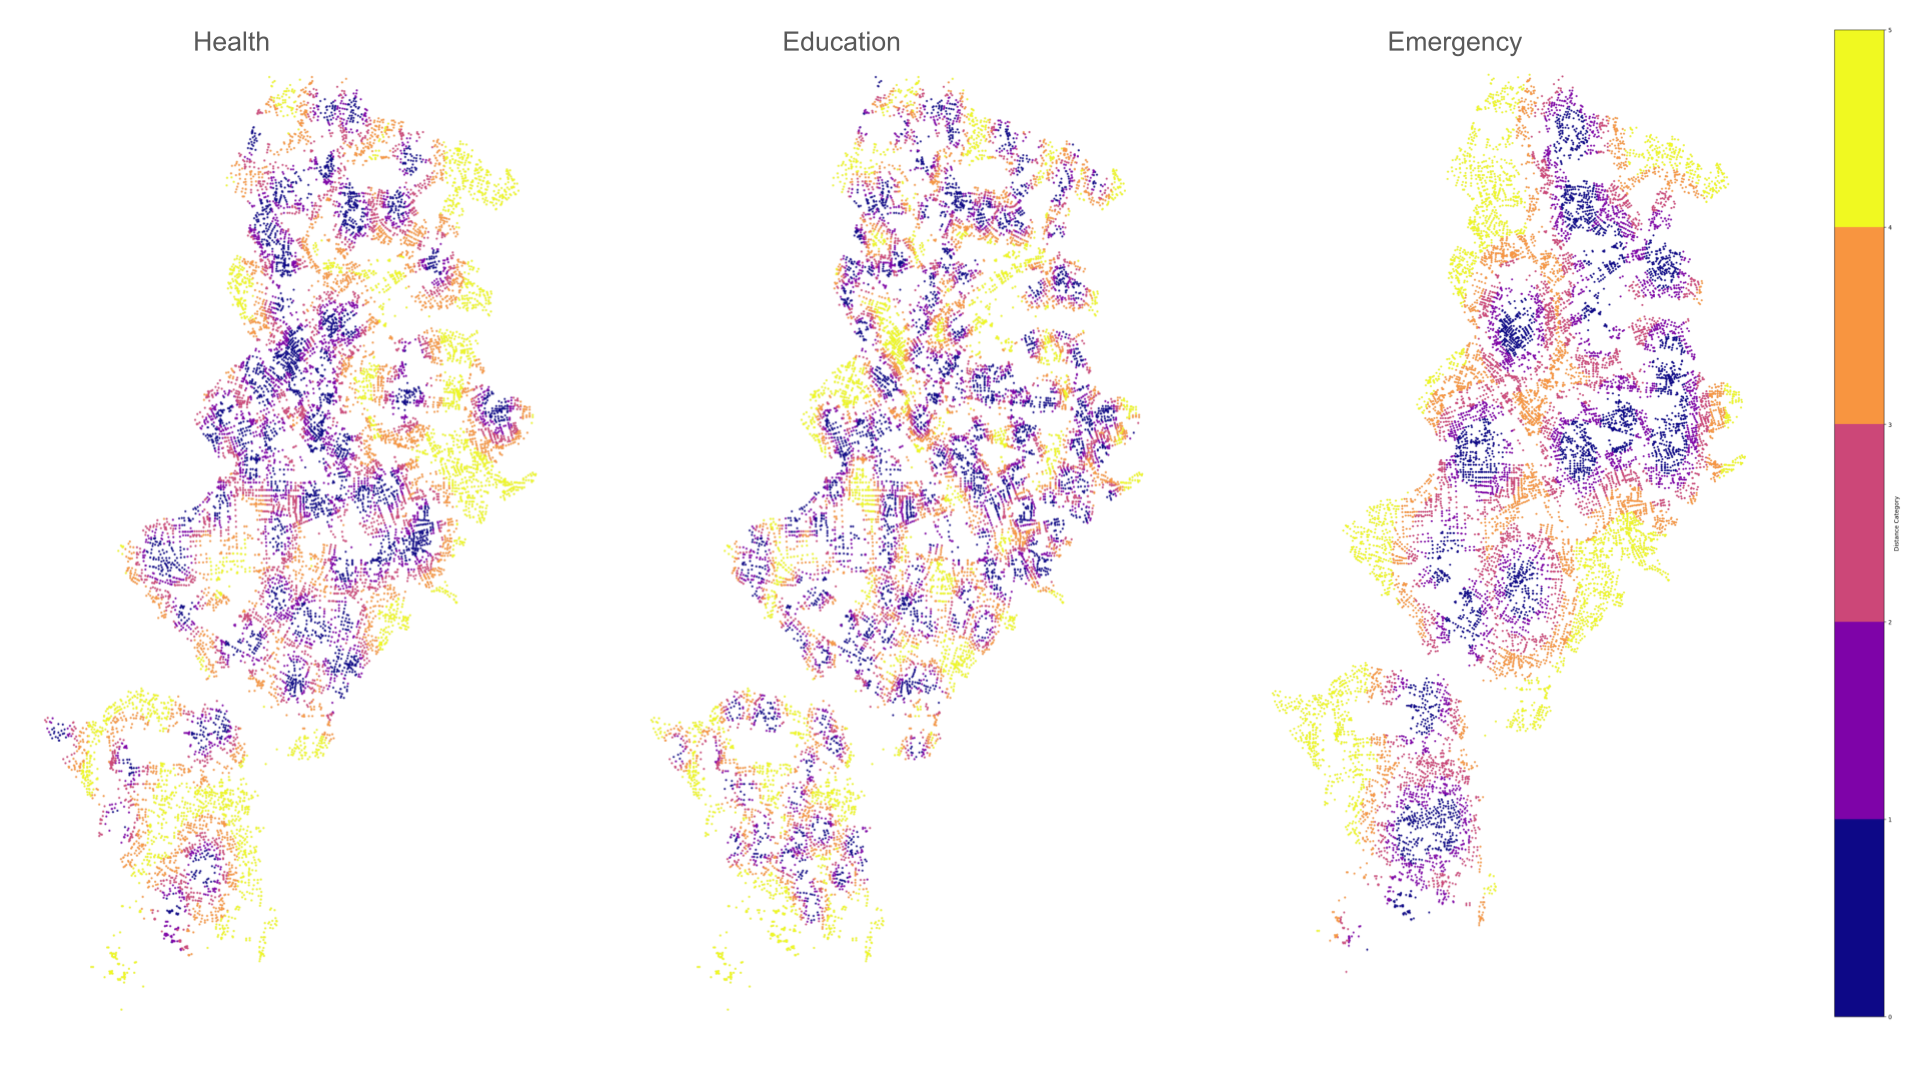
Enriching the Graph – Distance to Closes Point
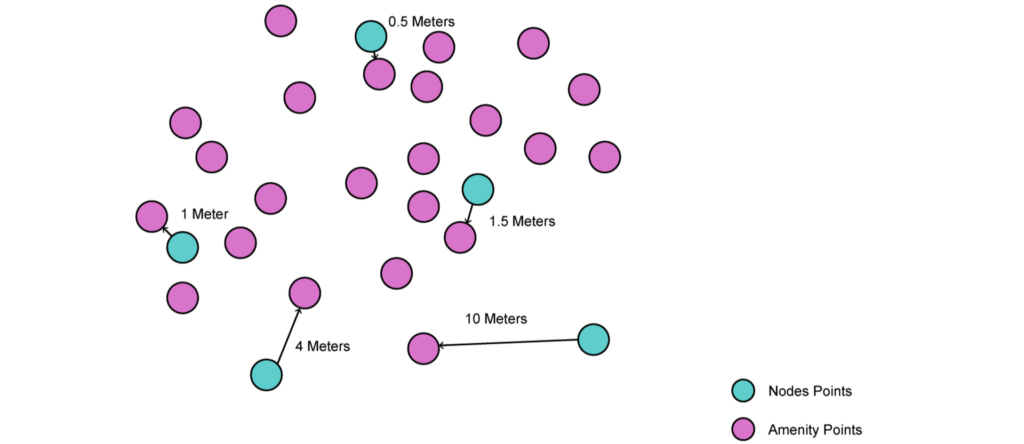
We found the distance from each node to its nearest point in each class and added this as a new attribute. We then grouped these distances and assigned groups as attributes as this showed a better relationship to the crime data.
Amenity Distance Groups
Updated Correlation
After performing the analysis to further enrich the graph with this new data, we looked to check the correlation of these attributes with the number of crimes.
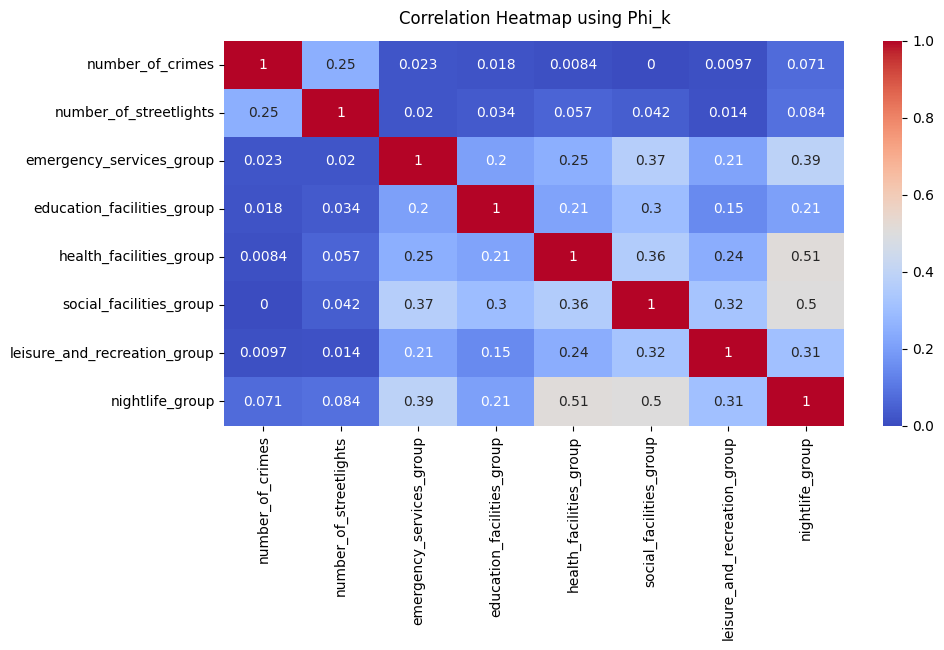
The heatmap reveals some interesting patterns in the spatial distribution of amenities and their relationship with crime rates and streetlights. The moderate positive correlation between streetlights and crime suggests that better-lit areas might not necessarily be safer, potentially due to higher foot traffic or potentially because better lit areas aid in catching the crimes and that there are still other crimes going uncaught in other areas. Nightlife areas show a higher correlation with both crime and streetlights, reflecting the expected trend that these areas are both well-lit and more prone to crime. The strong correlations between different groups of amenities indicate that certain facilities, like health services and nightlife or social and educational facilities, tend to be clustered together.
Additional Features Related to proximity
Geographic Dependencies
Incorporating K-means proximity attributes helps in capturing geographic dependencies which are often crucial in urban studies, crime analysis, and resource allocation. Geographic dependencies refer to the relationships and influences that nearby locations have on each other. By using K-means clustering, these dependencies are encapsulated within the cluster attributes, allowing the model to consider how the presence of certain amenities or the spatial configuration of an area might affect crime patterns. This can lead to more accurate and context-aware predictions and analyses.
Enhancing Deep Neural Network Analysis
Incorporating K-means proximity as an attribute in a Deep Graph Library (DGL) or deep neural network analysis enhances the model’s ability to capture spatial relationships, improves performance, and makes the results more interpretable. This approach leverages the spatial clusters to inform the neural network about the geographical context, leading to better learning of patterns and dependencies in the data. As a result, the model can make more informed predictions, especially in applications where spatial context is critical. This is particularly valuable in fields like urban planning, crime analysis, and public safety, where understanding the geographic context is crucial for effective decision-making and resource allocation.
Final Dataset – Index of Multiple Deprivation
Nodes were tested for inclusion with the ward polygon boundary, and then based on this, were assigned an associated IMD Score.
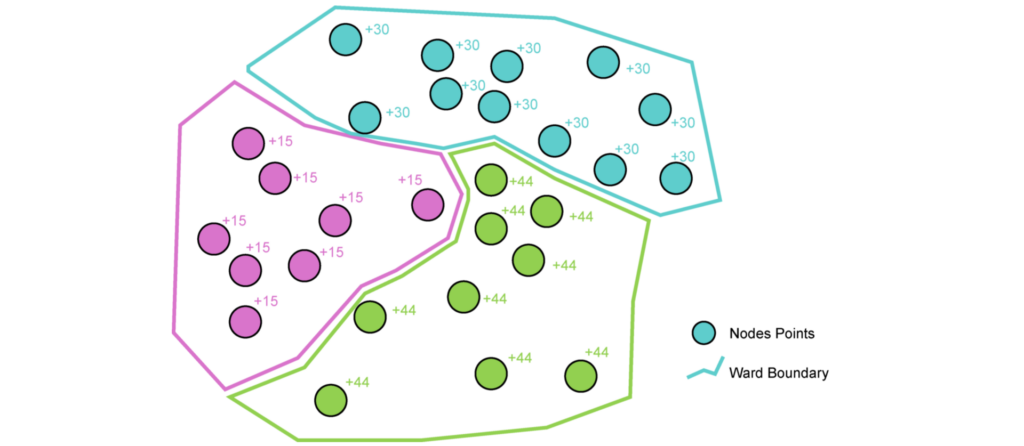
The Indices of Multiple Deprivation (IMD) are area-based measures of relative deprivation in England, published by the Department for Communities and Local Government (DCLG). They consist of several indicators grouped into seven domains: Income, Employment, Education, Health, Crime, Barriers to Housing and Services, and Living Environment. The IMD is used by government and community organisations to identify disadvantaged areas and support decisions regarding resource allocation. It provides a comprehensive analysis of deprivation, making it a valuable tool for urban studies and crime analysis.
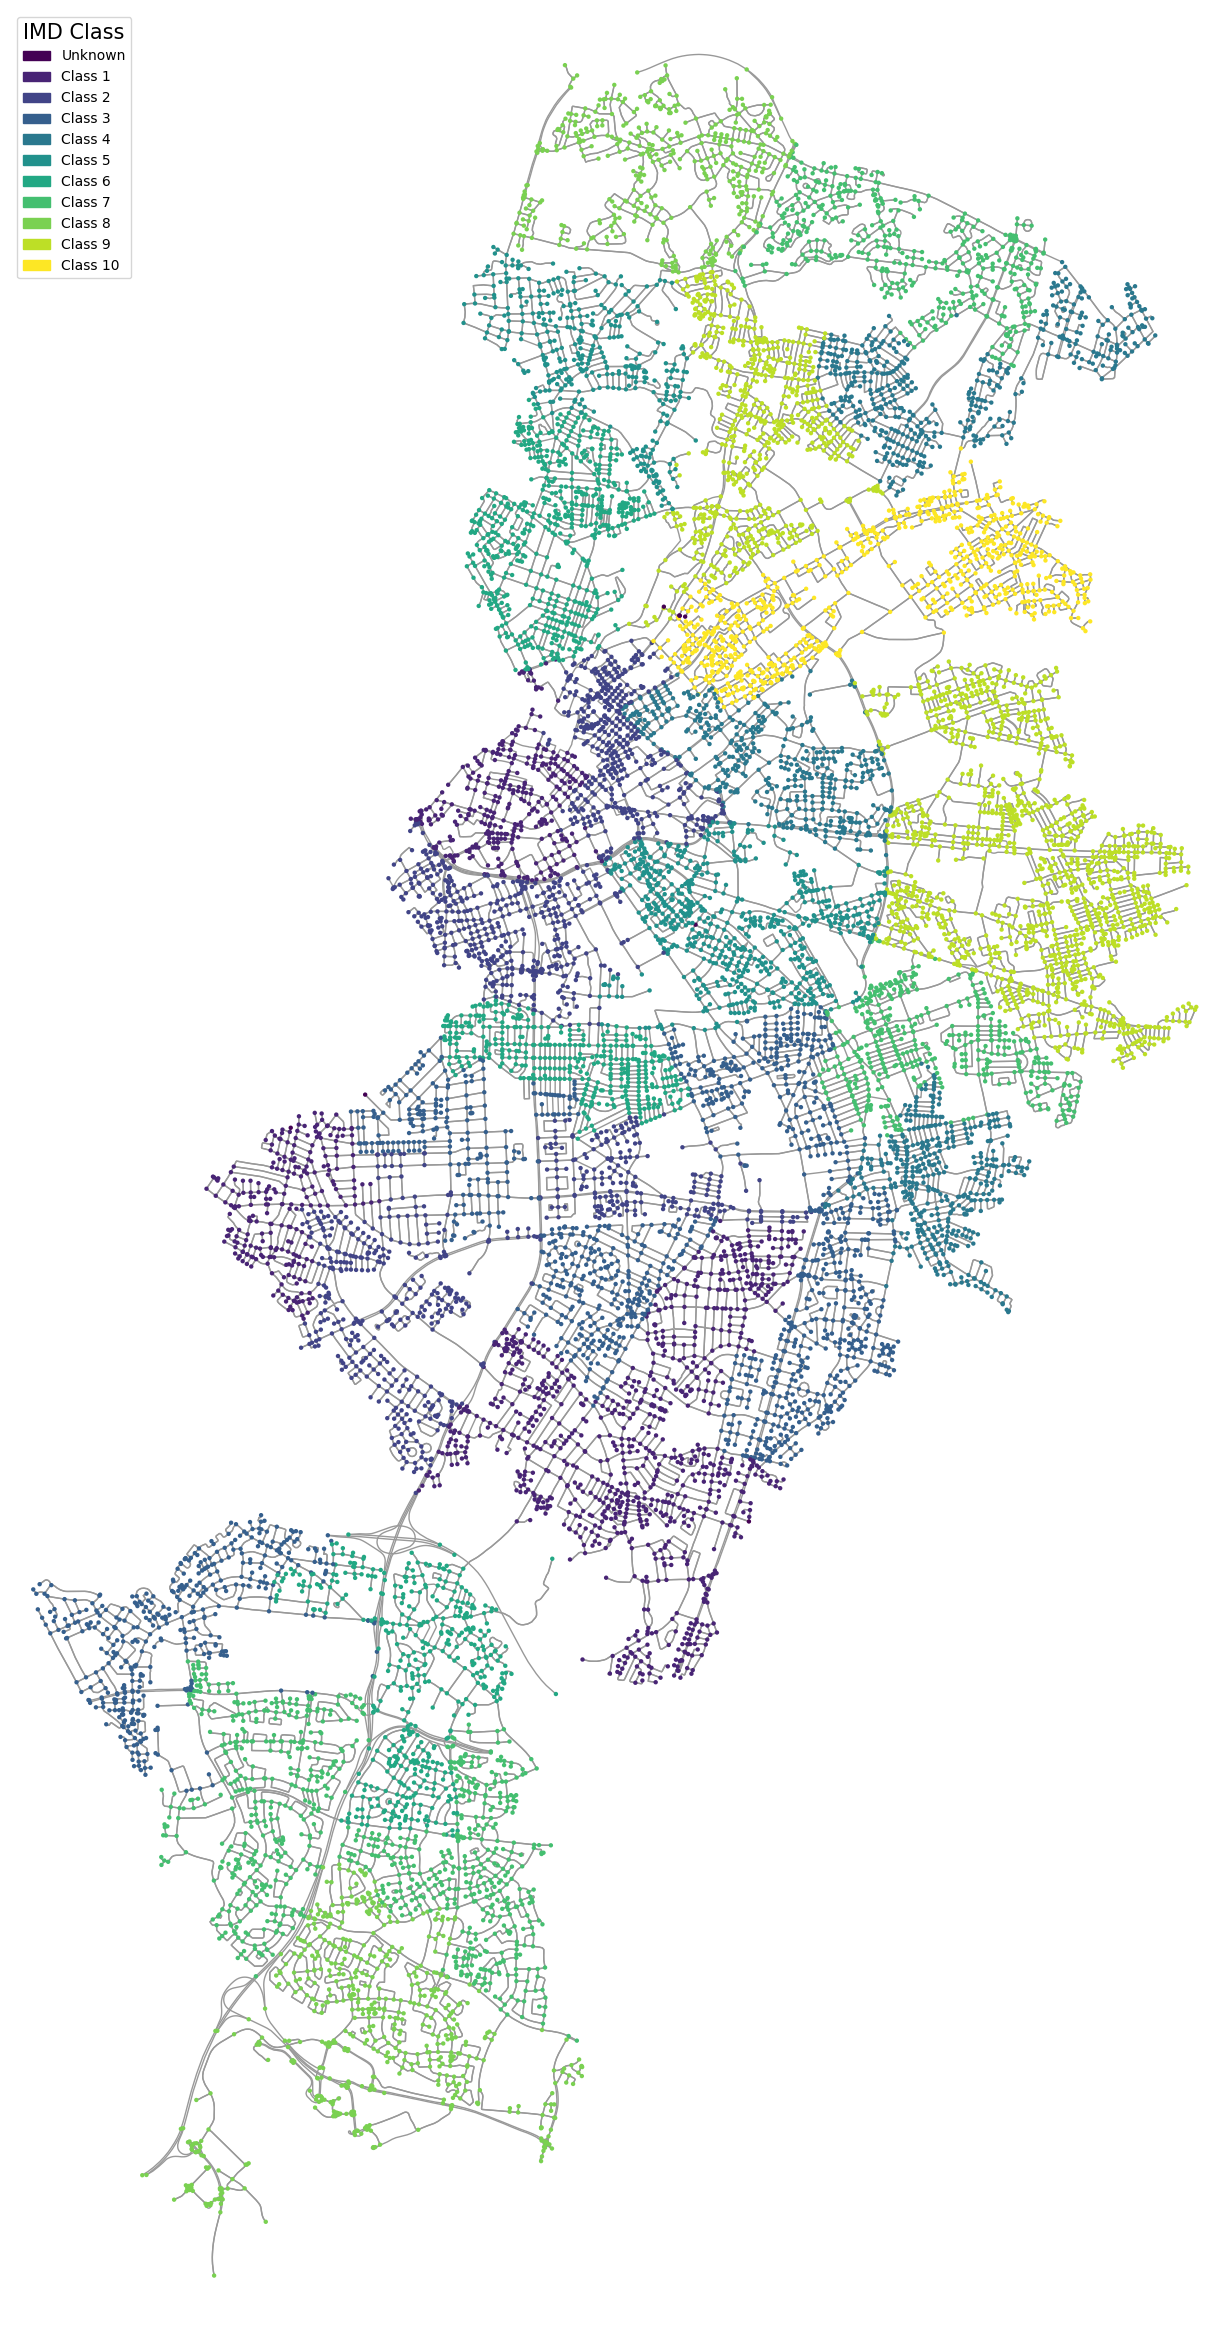
Using the IMD in this analysis enhances understanding of the socio-economic context of different areas, which is crucial for several reasons. It aids in identifying crime hotspots by revealing the link between deprivation and crime rates, supports resource allocation by targeting areas most in need of intervention, enriches spatial analysis with a more comprehensive dataset for examining geographic patterns of crime and amenities, and provides insights into various factors contributing to crime beyond just physical features like streetlights.
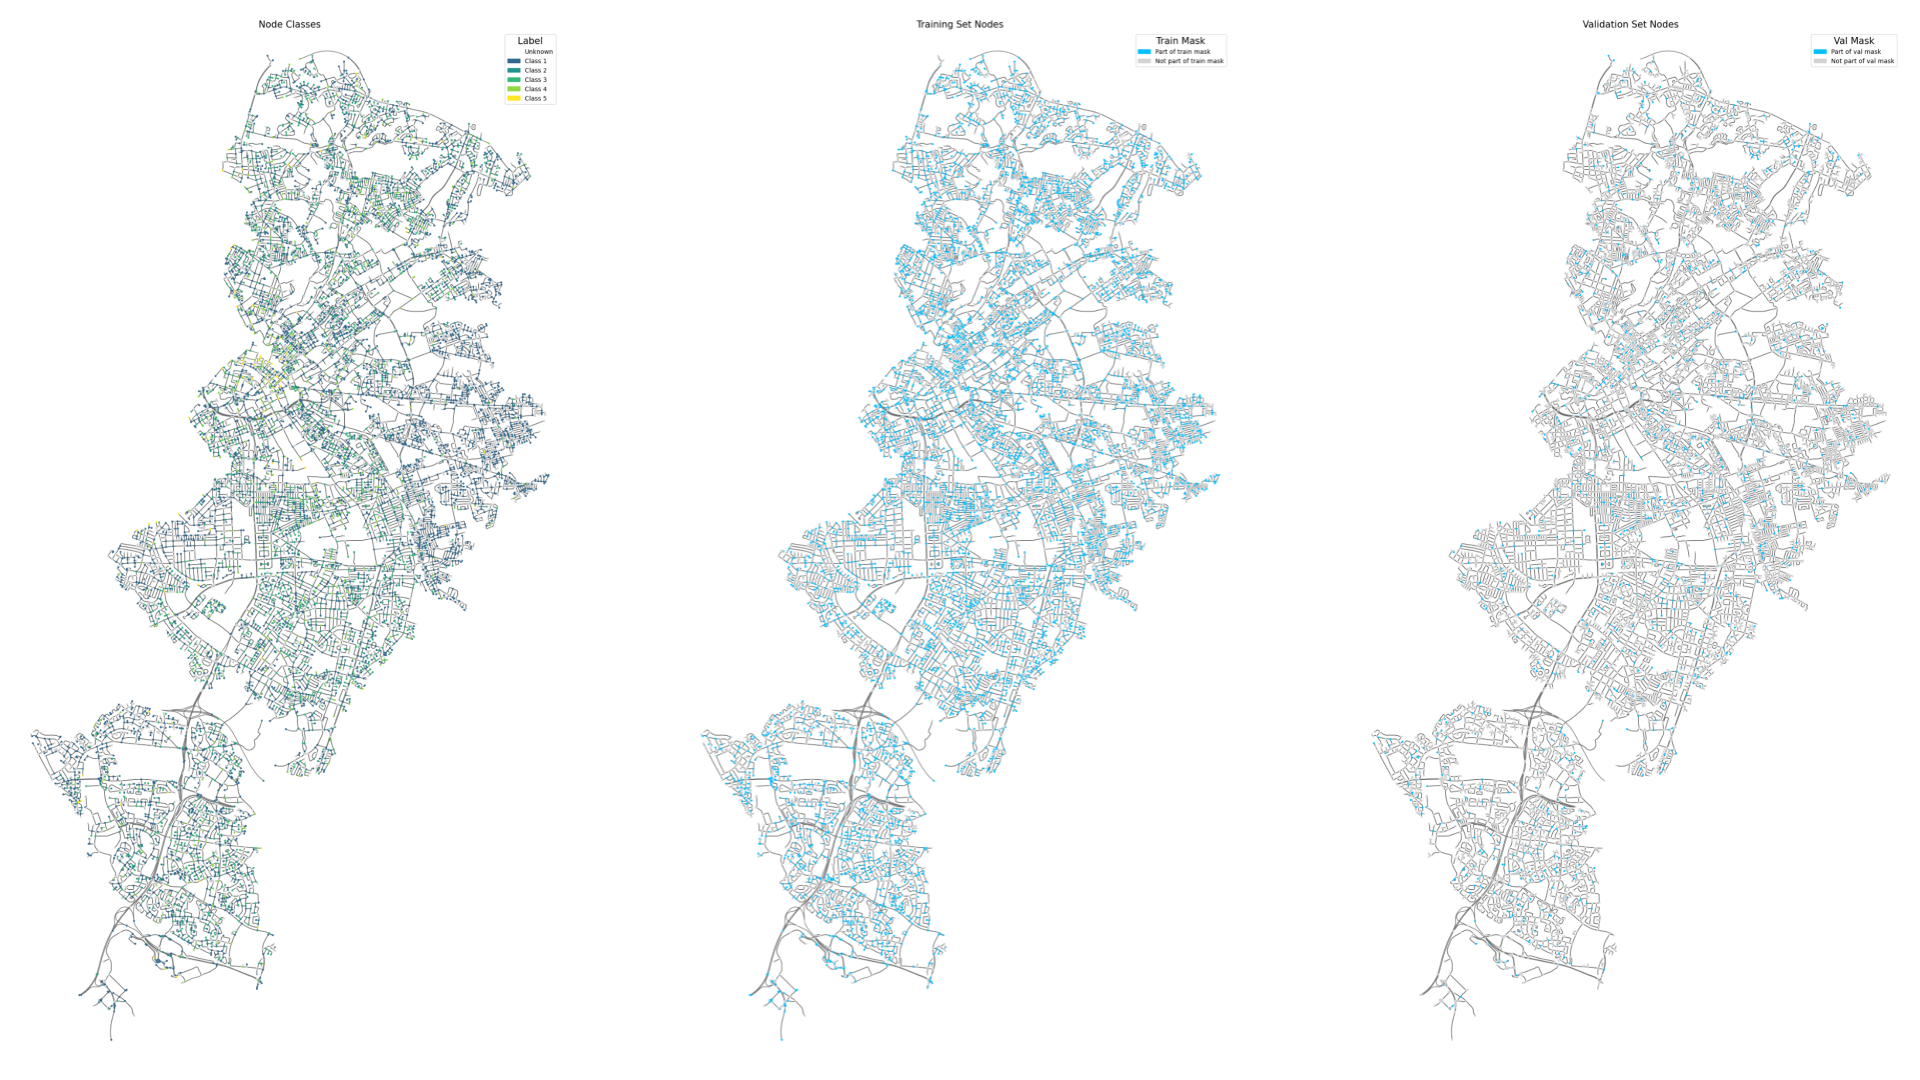
Deep Graph Machine Learning
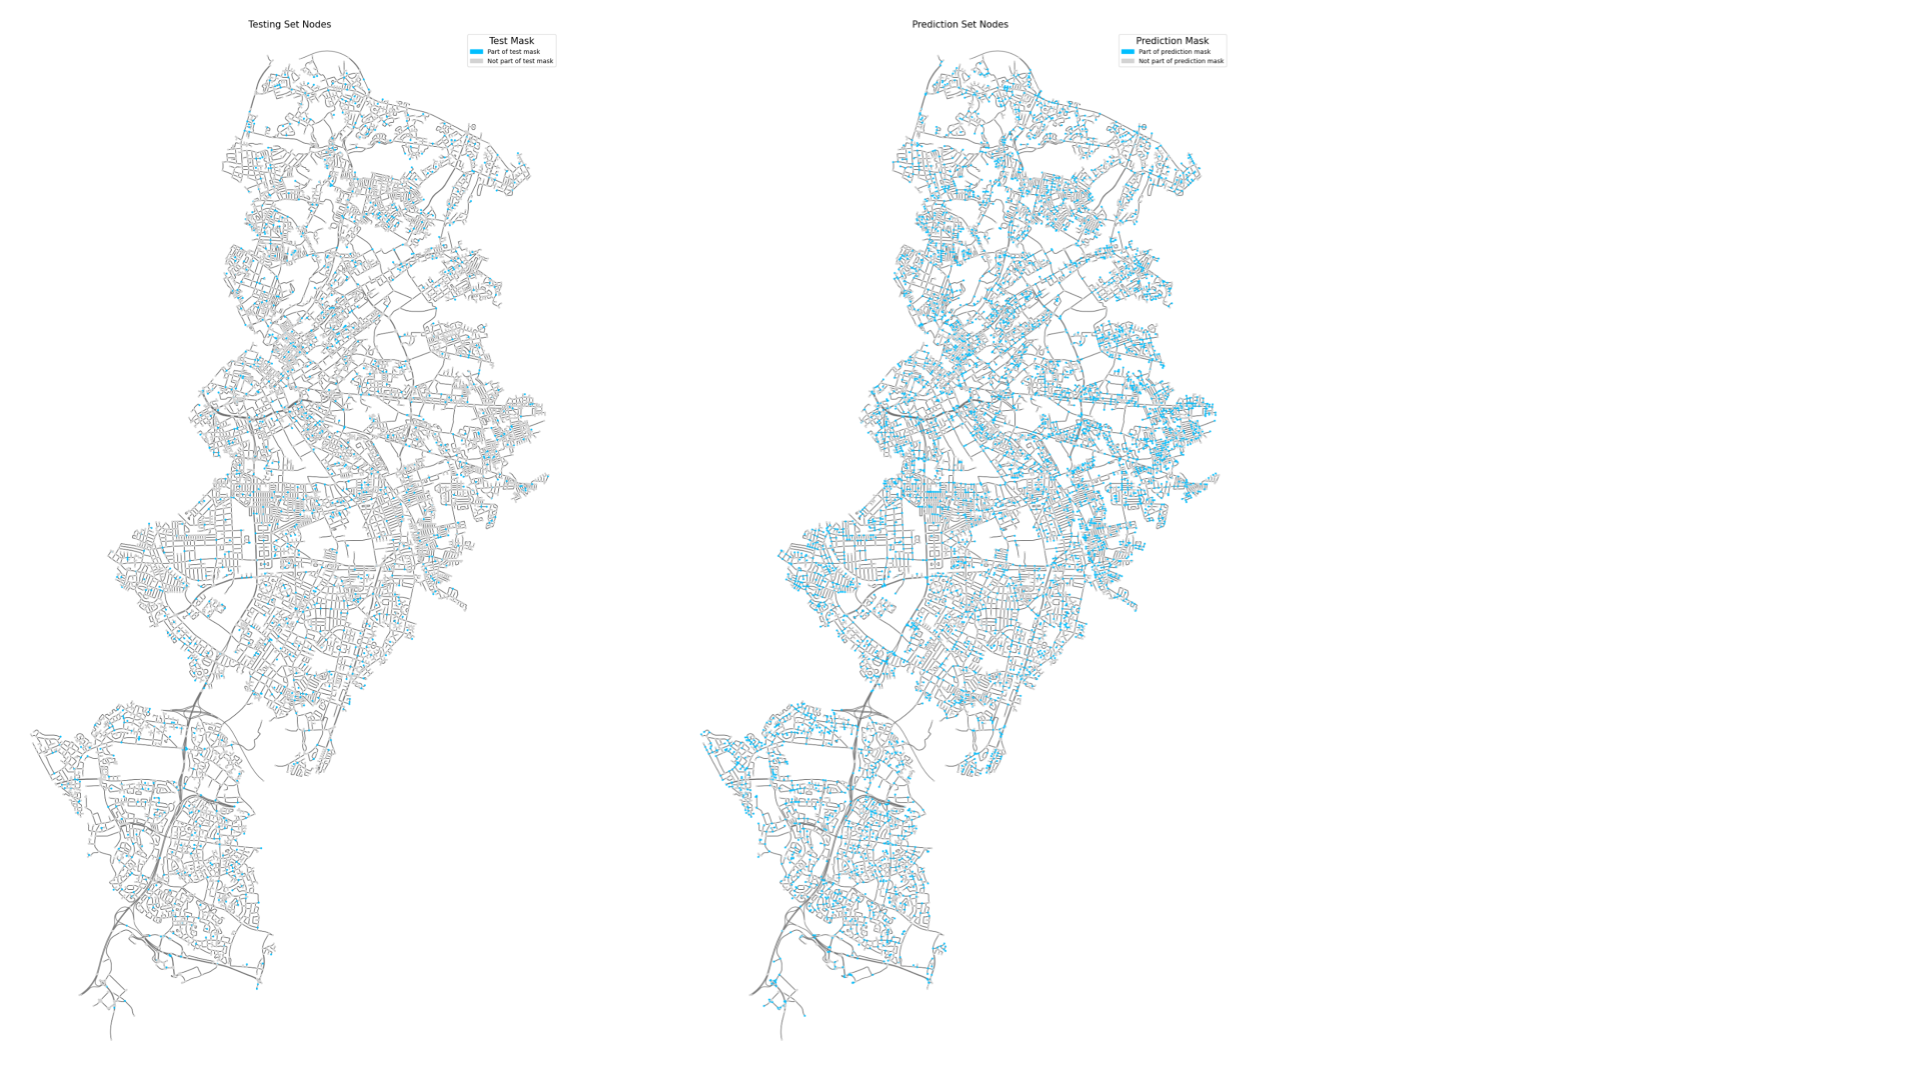
Prior to the learning process, the nodes were split into; train, validation, test, and prediction masks, below, in our DGL graph to facilitate robust training and evaluation.
Model Results – Initial Testing
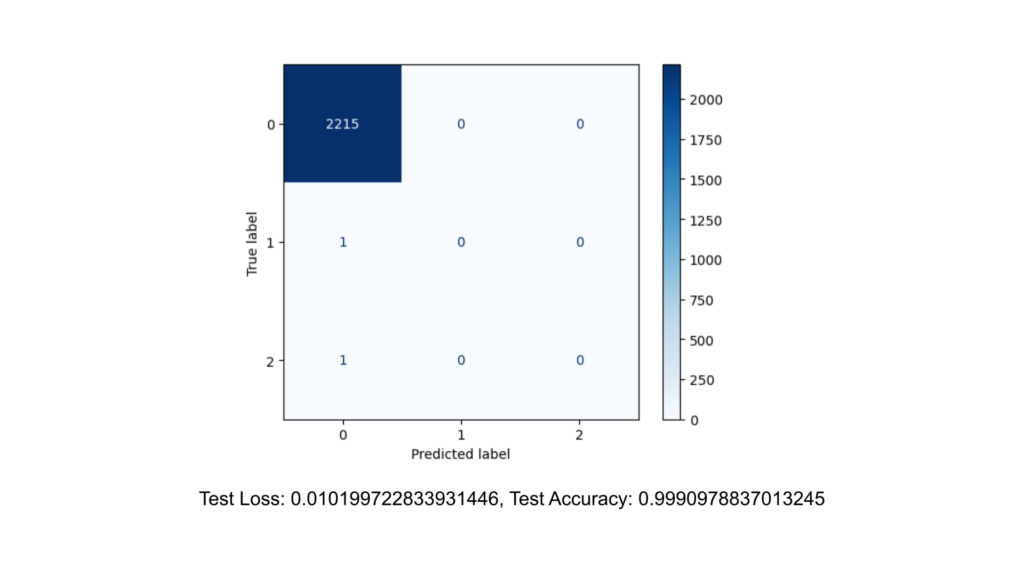
On first look, the model seemed to be performing pretty well. However, we felt that this was largely due to how we had assigned our crime classes.
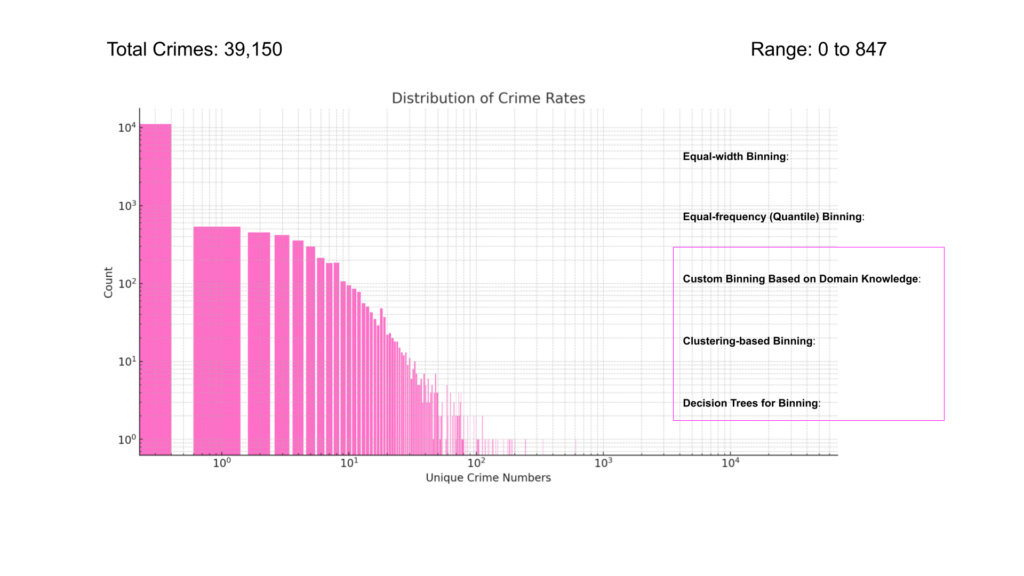
Initially we had opted for Equal-width binning involves dividing the range of data into intervals of equal size. This method can be problematic for several reasons, particularly in the context of the crime rate distribution shown in the histogram.
Uneven Data Distribution:
The crime data is highly skewed, with a large number of areas having low crime rates and very few areas with high crime rates. Equal-width binning does not account for this skew, resulting in many bins with very few or no instances and some bins with a large number of instances.
Class Imbalance:
Due to the uneven distribution, equal-width binning can exacerbate class imbalance issues. In this case, most data points fall into the low-crime bin, leading to a model that appears to perform well by predominantly predicting the majority class correctly but failing to accurately predict the minority classes.
Model Performance:
The model might seem to perform well overall due to high accuracy, primarily driven by the large number of correct predictions in the majority class (low crime rate). However, it likely performs poorly on the minority classes (higher crime rates), as indicated by the confusion matrix showing misclassifications of these classes.
False Sense of Performance:
High accuracy in such a scenario can give a false sense of model performance. The model may not be truly effective in identifying areas with different crime rates, particularly where intervention is most needed (high-crime areas).
Due to these reasons, we decided to re examine how we allocated the crime classes, further analysis of the crime counts revealed:
Count: 14,772 entries
Mean: About 2.66 crimes.
Standard Deviation: About 16.62 crimes.
Minimum: 0 crimes.
25th percentile: 0 crimes.
Median (50th percentile): 0 crimes.
75th percentile: 0 crimes.
Maximum: 847 crimes.
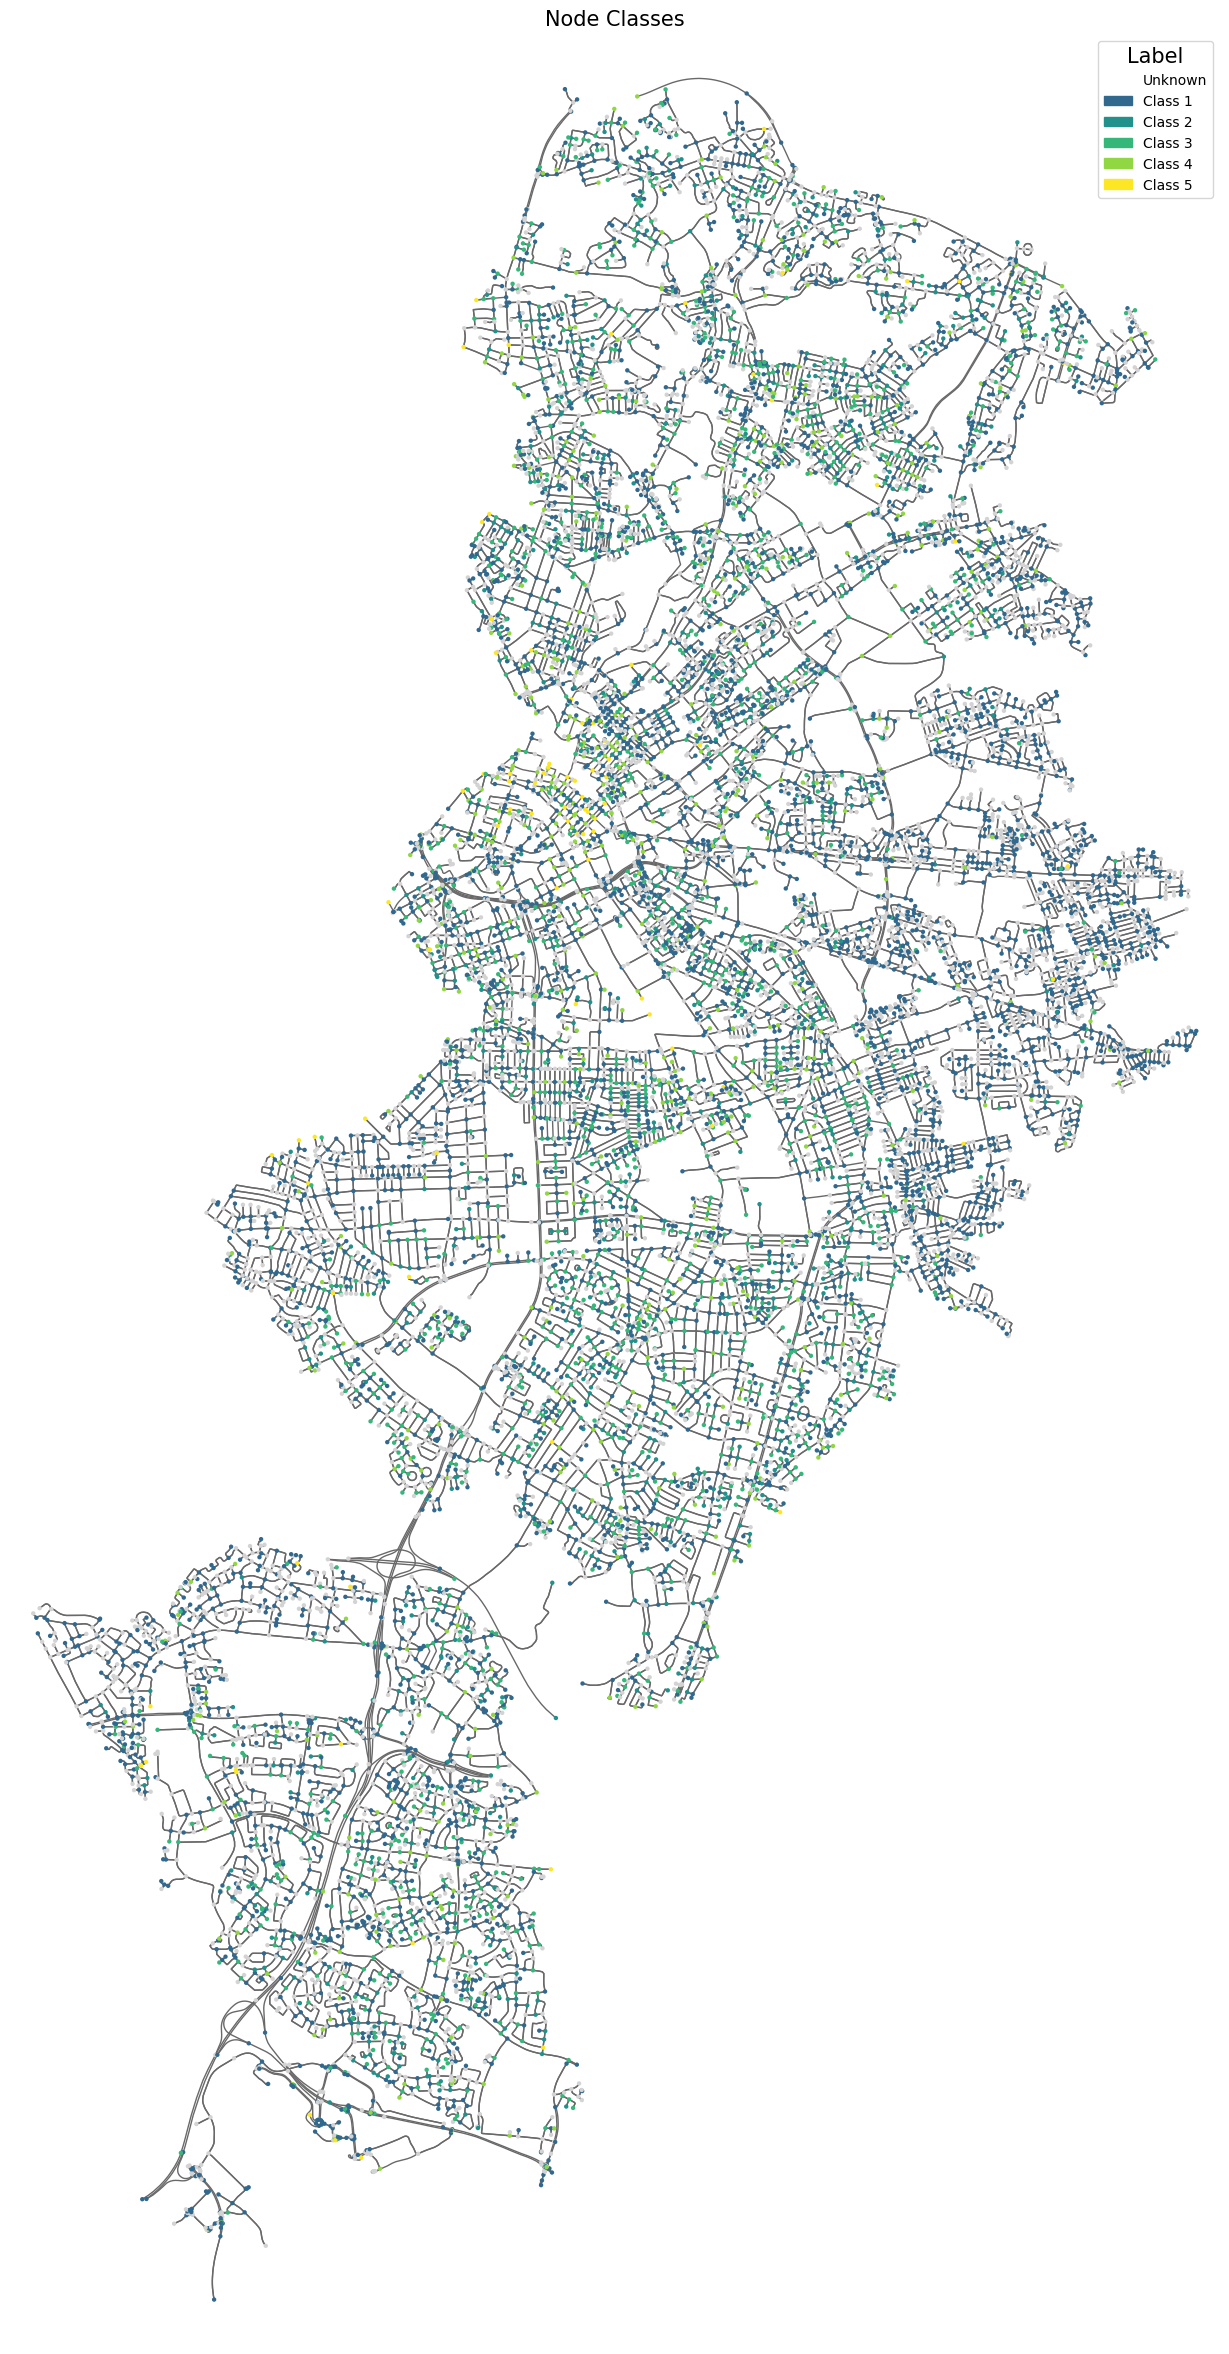
A significant number of entries, specifically 11,091, have 0 crimes. Given this distribution, a method was chosen which grouped all of the 0 crimes into one group and then looked to categories the remaining non-zero values into four groups:
Group 1: 0 crimes.
Group 2: Greater than 0 but less than or equal to 2 crimes.
Group 3: Greater than 2 but less than or equal to 10 crimes.
Group 4: Greater than 10 but less than or equal to 50 crimes.
Group 5: More than 50 crimes.
This distribution attempts to capture the heavy skew towards lower crime counts while still differentiating higher crime areas.
Model Results – Revised Classes
Confusion Matrix
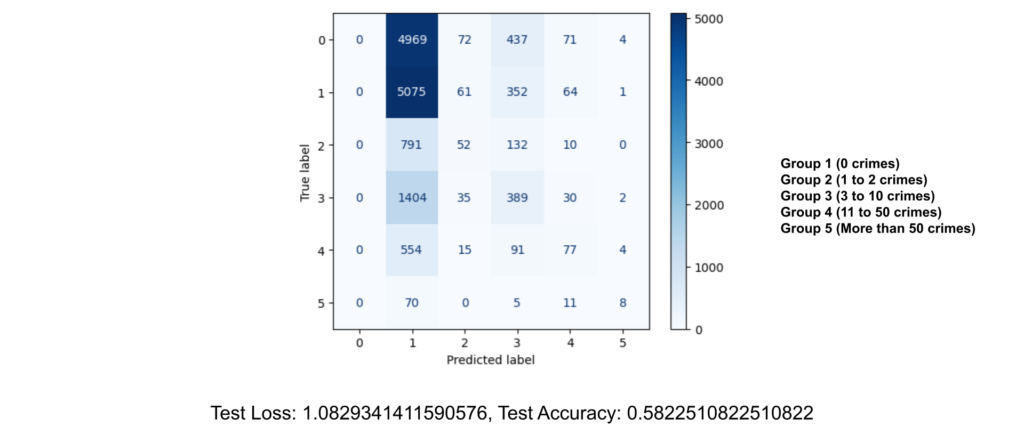
- Group 1 (0 crimes): Predicted 4969 correctly, misclassified 584 as Group 2 to 5.
- Group 2 (1 to 2 crimes): Predicted 5075 correctly, misclassified 478 as Group 1, 3 to 5.
- Group 3 (3 to 10 crimes): Predicted 791 correctly, misclassified 194 as Group 1, 2, 4, 5.
- Group 4 (11 to 50 crimes): Predicted 1404 correctly, misclassified 456 as Group 1 to 3, 5.
- Group 5 (More than 50 crimes): Predicted 554 correctly, misclassified 109 as Group 1 to 4.
The categorization into five groups appears to have provided a more detailed breakdown of crime rates, improving granularity compared to previous equal-width binning. This method better captures the skew in crime distribution, particularly isolating the zero-crime entries and distinguishing between varying levels of crime severity. However, there is now a significant misclassification rate, especially for Group 1 (0 crimes) and Group 5 (More than 50 crimes), leading to a low test accuracy of 58.2%. This might be due to the large number of zero-crime entries (Group 1) and the minimal entries for high-crime categories (Group 5) likely contribute to the model’s poor. Misclassifications across neighboring groups suggest that the model struggles with differentiating between closely related crime rate categories.performance.
Training Hyperparamters
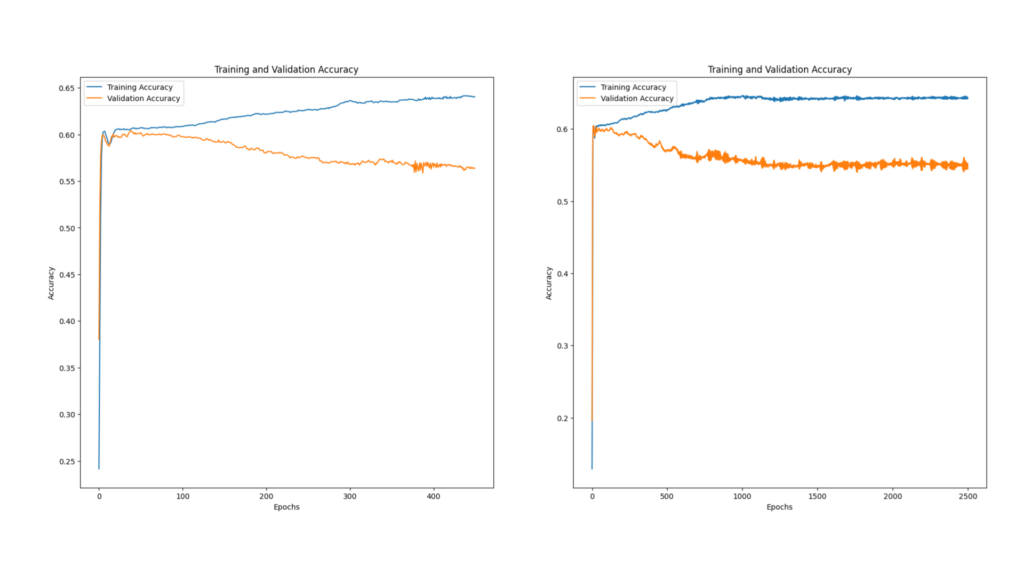
First Graph:
- Training Accuracy: Starts around 0.3, increases sharply, and stabilizes at 0.65 with minor fluctuations.
- Validation Accuracy: Also starts at 0.3, rises sharply, but then gradually declines, stabilizing around 0.5.
Second Graph:
- Training Accuracy: Begins just below 0.4, rises quickly, and steadily improves to about 0.65.
- Validation Accuracy: Starts just below 0.4, rises initially, but shows a more pronounced decline, stabilizing around 0.55 with more variability.
Performance Considerations:
- Both graphs show training accuracy improving consistently while validation accuracy plateaus or declines, indicating potential overfitting.
- The second graph shows better validation accuracy but more fluctuations, suggesting potential instability or sensitivity to hyperparameters.
In summary, the second graph indicates better peak validation accuracy, but it requires careful handling to manage variability and prevent overfitting.
Prediction
Conclusions
On reflection, we found that in Manchester, there don’t seem to be any definitive indicators of crime based on the data we explored. Localized hotspots, such as Piccadilly Gardens, are areas known for antisocial behavior and have seen numerous efforts to reduce crime rates. This points to potential social factors not captured in our data. The lack of a clear relationship might also be impacted by the steady decline in policing numbers or the highly publicized news about UK prisons nearing capacity, providing fewer deterrents for potential offenders.
From a technical perspective, several areas could be improved in our analysis. Firstly, addressing overfitting through techniques such as early stopping and regularization could enhance model performance. We also recognize the need for better data representation, suggesting the incorporation of additional relevant features and balanced binning methods to handle class imbalance. Enhancing model stability through learning rate adjustments and employing cross-validation for robust performance assessment are crucial steps. Additionally, augmenting the dataset to increase diversity and experimenting with more complex models like ensemble methods could capture more intricate patterns
