Background
Public transportation plays a crucial role in urban planning globally. Extensive research indicates that bus transit has become a highly favored mass mobility system. This preference stems from its cost-effective infrastructure, flexible planning, and discrete architecture that supports incremental growth. Bus transit systems exhibit lower infrastructure costs compared to rail or subway networks, making them financially viable and allowing services to reach areas with limited resources. The adaptable nature of bus transit systems contributes to their popularity. Buses can be easily rerouted to accommodate changing travel patterns, enhancing the efficiency of the overall transit network. Additionally, the discrete architecture of bus transit minimizes the need for dedicated infrastructure, enabling gradual expansion without major disruptions to urban landscapes. This flexibility and scalability are valuable attributes in responding to evolving transportation needs.
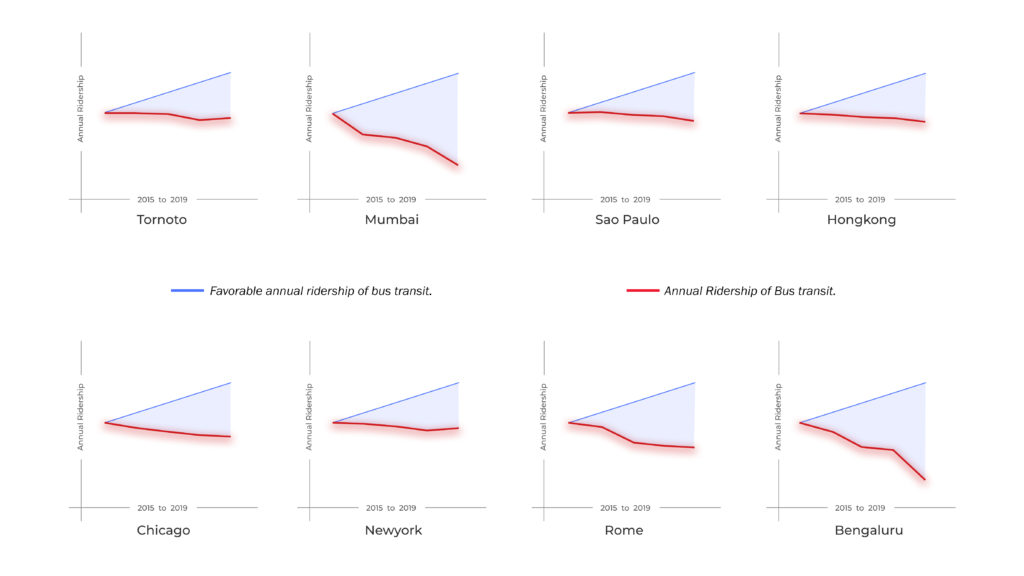
However, it is crucial to note that bus transit has experienced a steady decline in annual ridership rates worldwide, even prior to the COVID-19 pandemic. This decline can be attributed to factors such as increased private vehicle ownership, changing mobility preferences, and the availability of alternative transportation options. Addressing these underlying causes is essential for revitalizing and sustaining the usage of bus transit systems. Notably, a research conducted by Bloomberg highlights the need for a substantial shift in this trend. To effectively meet the emissions reduction target of limiting global warming to 1.5 degrees Celsius, as set forth by the Paris Climate Agreement, it is imperative to achieve an annual growth rate of 5% in bus ridership rates worldwide starting by 2015 till the year 2030.
Among the factors contributing to the declining annual ridership in public transportation, several key reasons include the availability of alternative transit options, safety concerns, heavy street traffic, and network planning deficiencies. However, network planning emerges as a particularly significant factor that demands critical attention and mitigation strategies due to its potential to yield positive externalities in contrast to other factors. Improving network planning in public transportation systems is crucial to address inefficiencies, enhance connectivity, optimize routes, and ensure seamless integration with other modes of transit. By prioritizing network planning and implementing effective measures, cities can potentially reverse the declining ridership trend and promote sustainable and efficient public transportation networks.
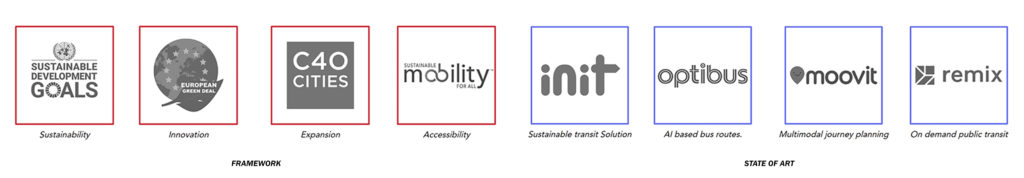
Currently there exists both global and local frameworks that deal with the network planning of bus transit. These frameworks have extensive goals and have been moving towards sustainable development particularly across Europe. Moreover, even private industries and start ups have been contributing to solving urban mobility problems. These private companies often partner with municipalities to enhance the mobility infrastructure technologically. This leads to my research question :
How complex network such as bus public transit can be planned that responds
to the ever evolving urban paradigms leveraging open data of cities ?
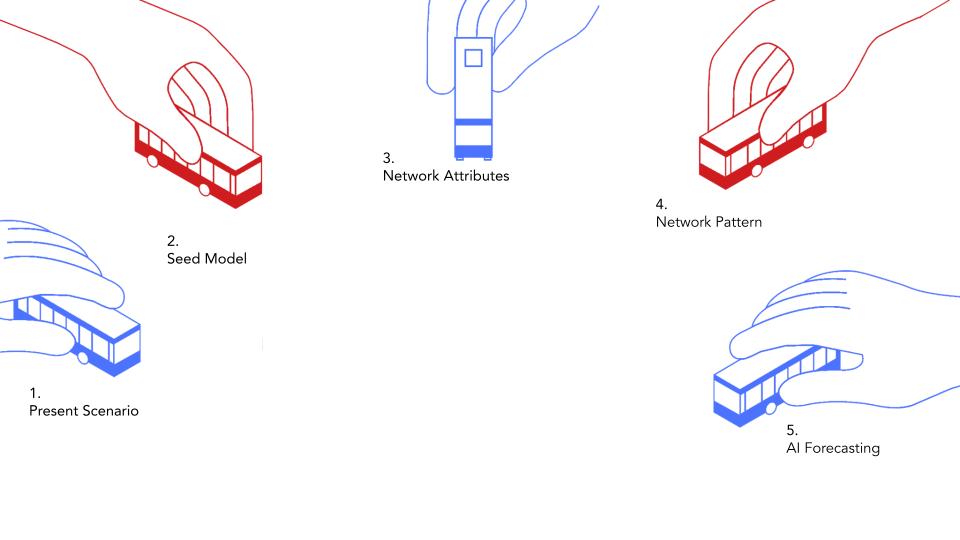
In order to understand how this research question is been explored the study ahead is divided in 5 chapters.
`
Present Scenario
Geoff Boeing’s study represents a significant contribution to urban planning and transportation research as it delves into the intricate details of street orientations within a city. By employing polar histograms as a visualization tool, the study provides a unique perspective on the spatial characteristics of urban development and central planning. One of the key aspects of this research is its ability to shed light on a city’s layout and how individuals navigate it. Through the analysis of street directions, the study uncovers valuable insights into the historical, architectural, and functional aspects of a city’s design. It allows us to understand the underlying patterns that shape a city’s growth and organization over time, as well as the impact of central planning efforts on its layout. Importantly, this research holds great relevance for the field of urban transportation, particularly in the context of bus networks. The orientation and layout of a city’s street networks are foundational to the efficient operation of any public transit system, including bus networks.
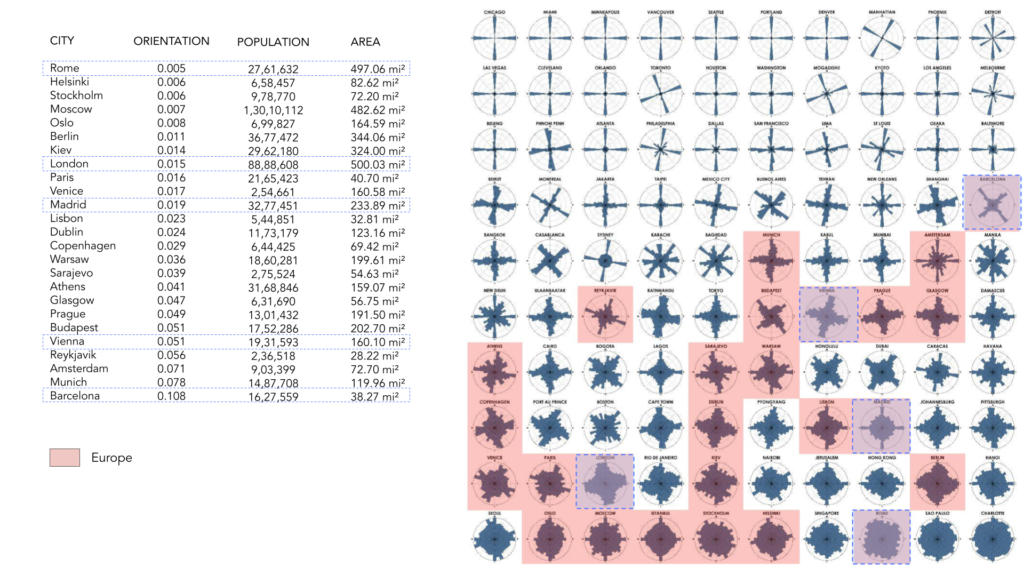
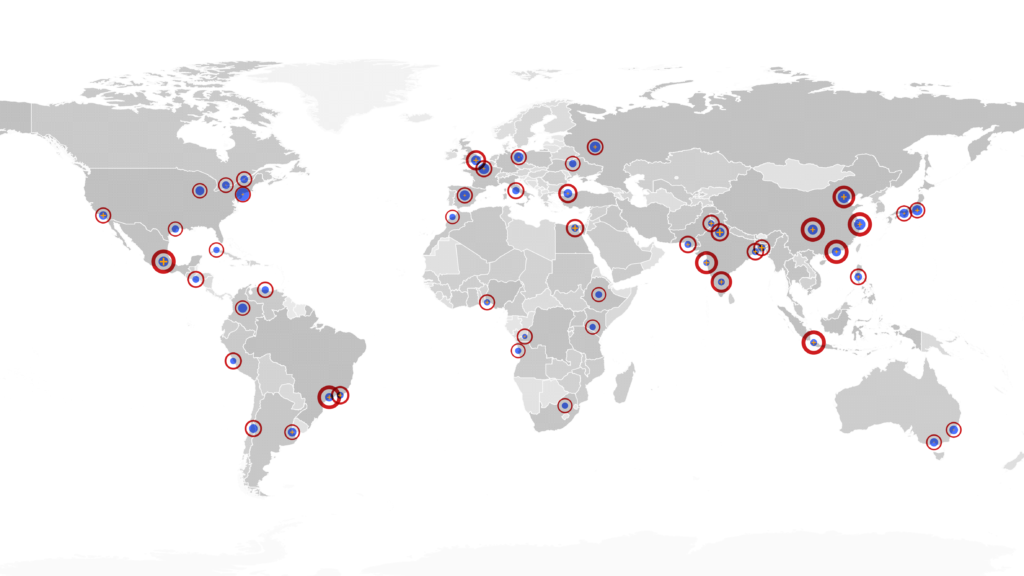
Boeing’s comprehensive study encompasses the analysis of 100 cities across the globe. The primary aim is to delve into specific case studies that exhibit a broad spectrum of street network orientations. European and Asian cities were chosen as the focal points of investigation due to the notable diversity observed in their orientation entropy when compared to cities in the Americas and Africa. Despite the intriguing possibilities offered by Asian cities, European cities ultimately emerged as the primary case study of interest. This decision was informed by the abundance of readily available open data sources for the European region. To comprehensively assess bus transit accessibility, this research aims to analyze the orientation of the bus network and overlay it with the street network within the city under consideration. The polar histogram of the street network orientation visually represents the distribution of streets throughout the city. Similarly, our objective is to employ a similar approach for the bus network, shedding light on areas that may exhibit a lack of alignment with the bus network orientation.
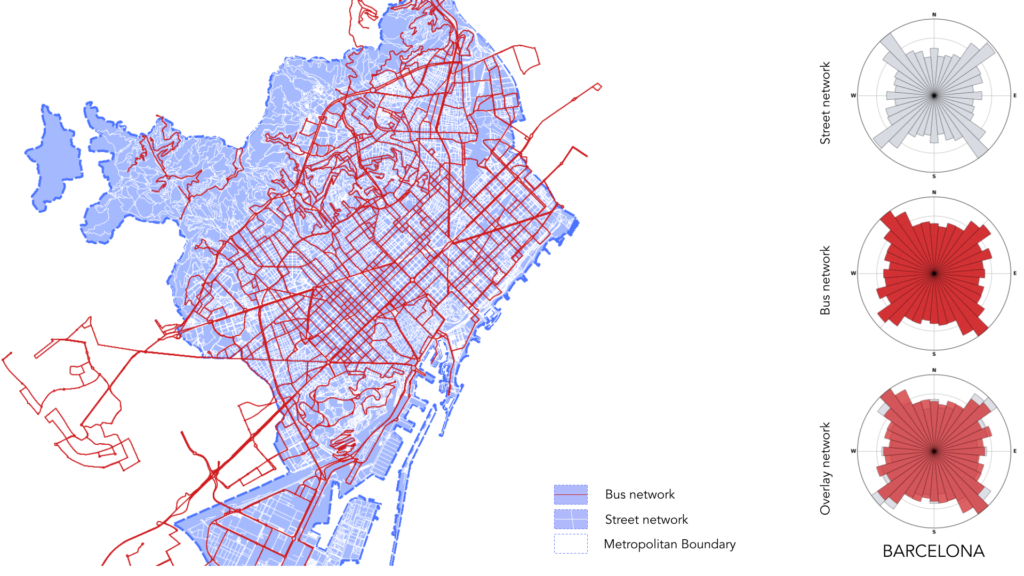
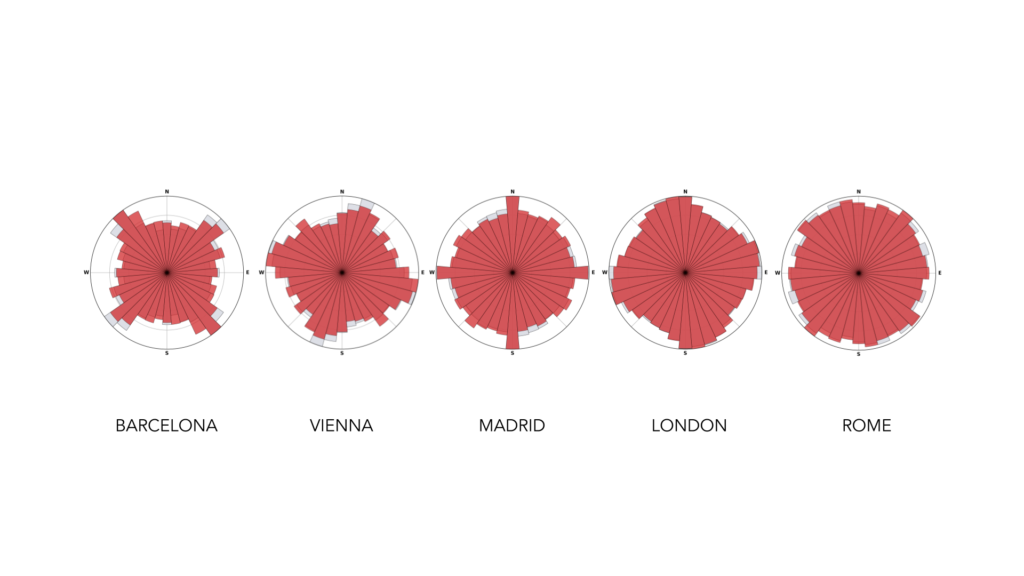
The case study of Barcelona is evident that Barcelona’s grid layout significantly prevails over historically organically developed areas, leading to a predominant orientation from Northwest to Southeast and Northeast to Southwest. These same characteristics are mirrored in the orientation of the bus network, which includes the bus routes operated by the Barcelona city council. With an overlap of more than eighty-five percent, it can be inferred that the bus transit system is well-distributed and accessible across the majority of areas in the city. When applying a similar process to the remaining four case studies, it becomes evident that consistent results, akin to Barcelona’s, emerge. This observation indicates that cities across Europe tend to exhibit a prevailing trend of possessing a well-distributed and accessible bus network.
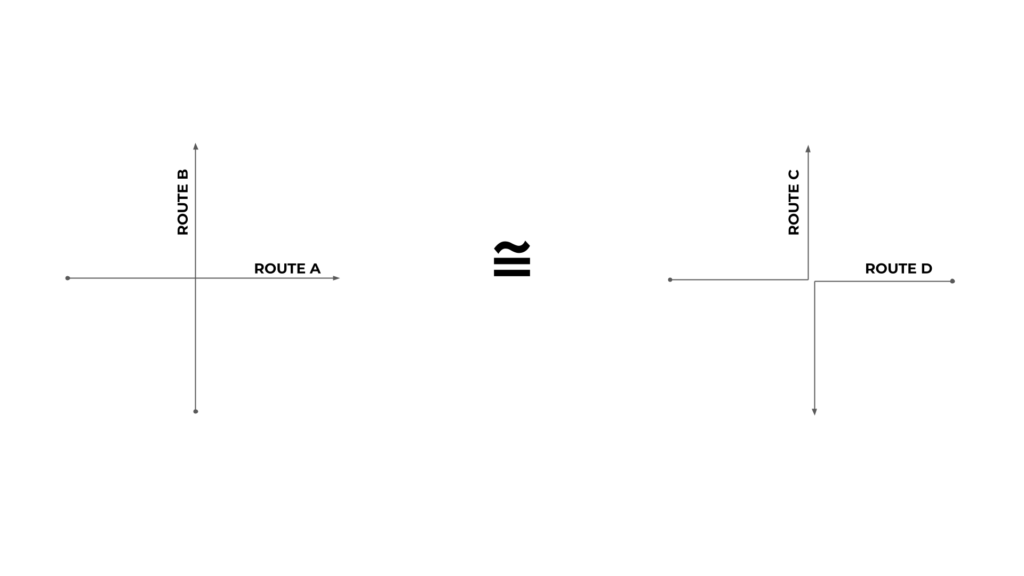
To expand the scope of this study, it’s crucial to recognize that the most accessible network isn’t necessarily the most optimized one. This illustration underscores the importance of distinguishing between accessibility and optimization. For instance, when comparing routes A and B on the left-hand side (LHS) with routes C and D on the right-hand side (RHS), we observe that they share similar orientation characteristics. However, their planning and operational aspects differ significantly. This realization prompts the next phase of the research, which focuses on planning bus network routes that are well-optimized.
Seed Model
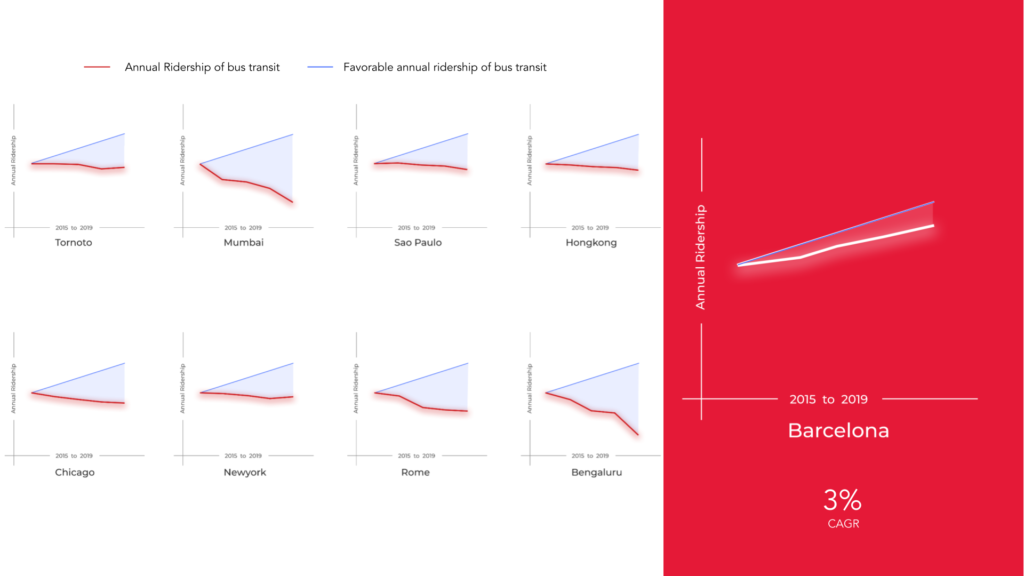
In contrast to the trends observed in many major cities worldwide, where the ridership of bus transit notably declined between 2014 and 2019, Barcelona stands out as an exceptional case. During this time frame, Barcelona experienced a substantial increase in bus transit ridership. This remarkable attribute of the city underscores its significance as a prime candidate for the researcher’s study. The focus of this investigation is to gain insights into the characteristics and attributes of a successful bus transit network by examining Barcelona’s newly planned bus model. By delving into Barcelona’s unique case, the research aims to uncover key factors contributing to the city’s increased bus ridership, which can serve as valuable lessons for improving bus transit systems in other urban contexts.
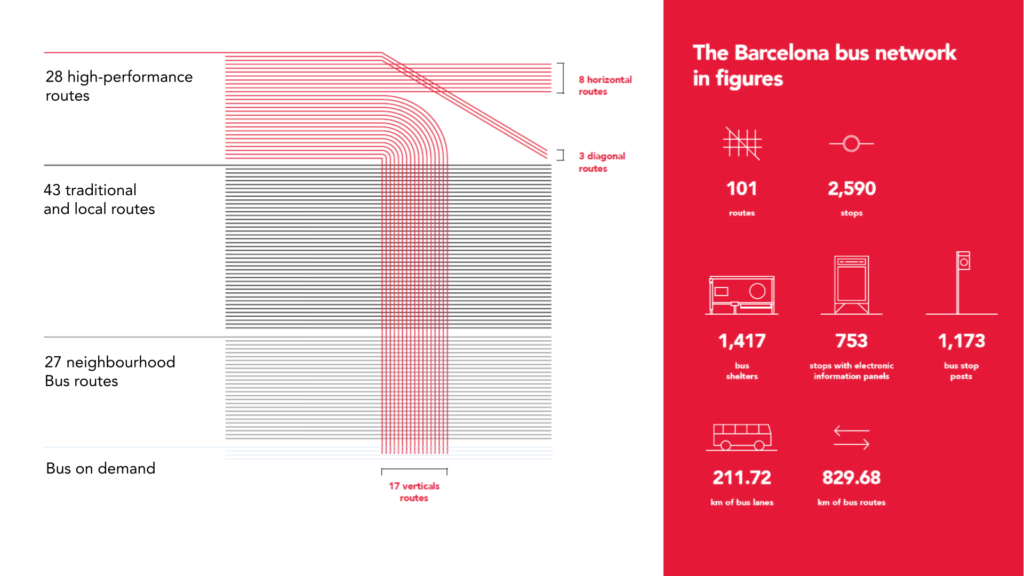
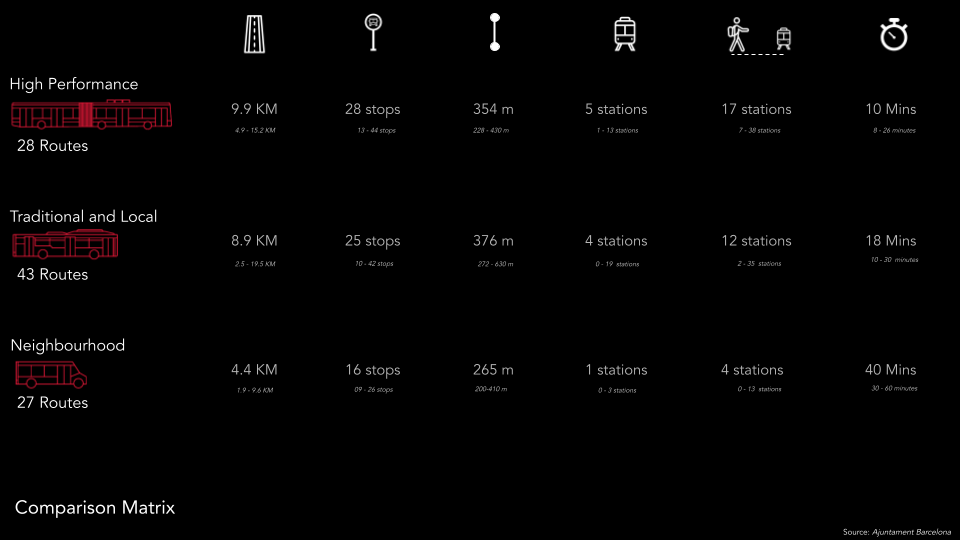
The revamped bus network in Barcelona signifies a significant transformation. This innovative concept revolves around the introduction of 28 high-efficiency routes, consisting of 17 vertical, 8 horizontal, and 3 diagonal routes. These routes are meticulously designed to be as direct as possible, accompanied by enhanced information and signage for passengers. Additionally, the initiative includes measures to prioritize buses over private vehicles, further improving the efficiency of the network. This high-performance route grid operates in conjunction with some of the existing conventional routes within the city, which may have undergone modifications, as well as the local routes. As a result, the new bus network offers a diversified range of bus services, forming a comprehensive grid composed of three interrelated networks:
- High-Performance Network
- Traditional and Local Network
- Neighborhood Bus Network
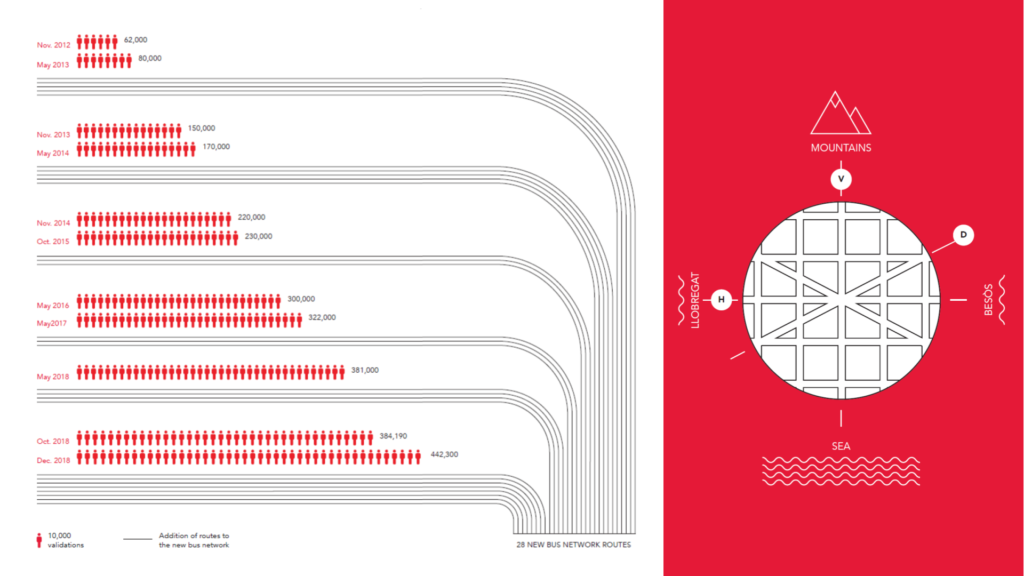
This integrated approach aims to enhance the overall public transportation system in Barcelona, offering passengers a more efficient and diverse range of transit options. The redesigned bus network in Barcelona places a strong emphasis on accommodating the city’s unique geographical layout and topography, ensuring that mobility is as equitable as possible for all residents. This strategic overhaul prioritizes:
Easy Usability: Simplifying the system for passengers, making it more accessible and user-friendly.
Enhanced Punctuality: Improving regularity and reliability to minimize wait times for commuters.
Accelerated Commutes: Striving for quicker journeys, reducing travel times for passengers.
Increased Frequency: Providing greater service frequency, ensuring more convenient access for riders.
Optimal Connectivity: Maximizing network connectivity and fostering better intermodal transportation options.
Enhanced Sustainability: Incorporating eco-friendly measures to promote environmentally responsible transit solutions.
The introduction of this new model for the Bus Network in Barcelona has resulted in a consistent annual ridership growth of three percent, represented by a Compound Annual Growth Rate (CAGR). Presently, residents of Barcelona benefit from a more straightforward and easily navigable bus network. This transformation has led to reduced wait times, shorter travel durations, and improved connections between various modes of transportation, contributing to the creation of a more appealing and sustainable public transit system.
Through this mapping endeavor, we can identify the core elements that have made Barcelona’s bus network thrive, including factors such as route rationality, ease of use, connectivity, efficiency, and resource optimization. These insights can then serve as a blueprint for crafting a similar model in a new city, tailoring it to the specific urban context while retaining the successful principles that have made Barcelona a shining example in the realm of public transportation.
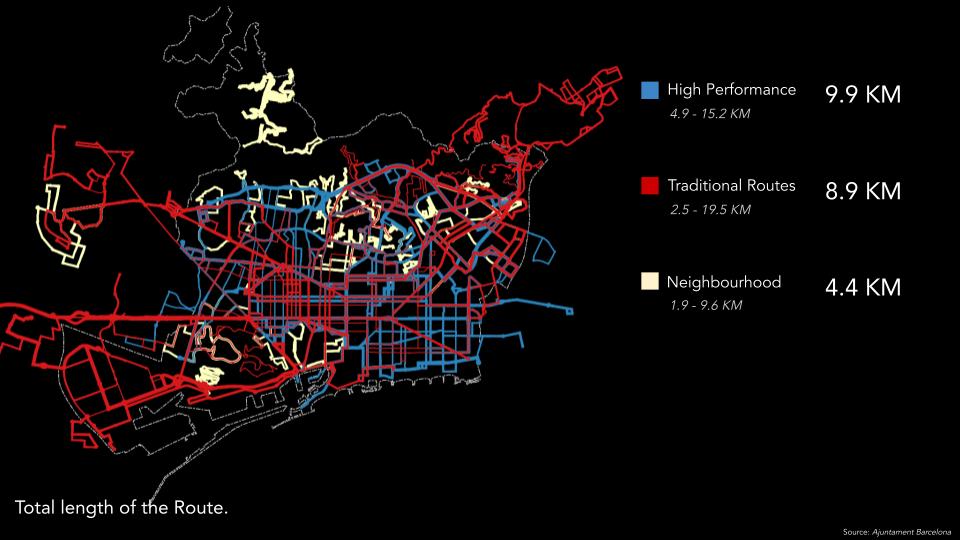
Several intriguing insights have come to light. Firstly, it’s striking to observe the balanced allocation of service routes between High-Performance and Neighborhood routes. Even though High-Performance buses serve a substantial 60% of the ridership, Neighborhood routes, which cater to less than 10% of the ridership, are given significant attention. This approach is rooted in the commitment to enhance accessibility and inclusivity within the bus transit system, ensuring that even less heavily used routes are considered in the overall planning.
Another noteworthy revelation pertains to traditional routes, which appear to be predominantly designed to connect key Points of Interest (POIs) that have held significance in the city for an extended period. This suggests a historical and pragmatic approach in creating these routes, catering to established patterns of movement and community engagement. The mapping exercise also highlights a consistent and evenly distributed distance between two bus stops throughout the network. This uniformity ensures that bus stops are readily accessible to a broad range of residents, irrespective of their location within the network. It underscores the importance of equity and accessibility in transit planning.
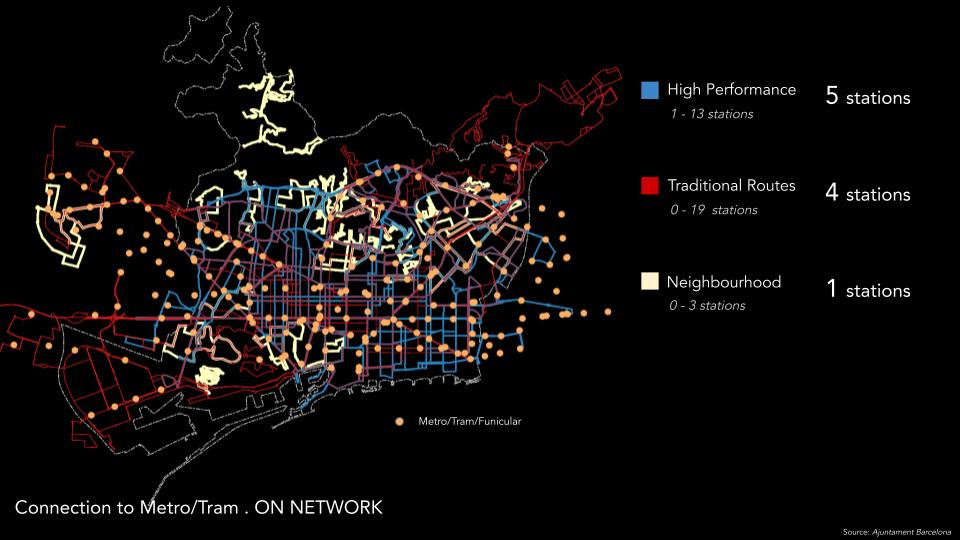
Furthermore, a deliberate effort is evident in the design of High-Performance routes to closely align with other public transit stations. This strategic placement enhances intermodal connectivity, making it convenient for passengers to transition between different modes of public transportation. Lastly, a direct correlation is observed between bus size and frequency, suggesting that the size of buses deployed is intricately linked to their frequency. This insight underscores the significance of optimizing the bus fleet to meet passenger demand efficiently.
Network Attributes
Drawing inspiration from the successful Barcelona bus network model, the process of replicating or adapting similar strategies in a new city demands a fundamental prerequisite: the establishment of a systematic approach for crafting routes that can replicate or even improve upon the existing Barcelona model.
To create a replicable model, it is essential to delve into a profound understanding of the Barcelona bus network. This entails a comprehensive exploration of the foundational principles upon which it was meticulously planned and executed. By dissecting the intricate details of three different route topologies, namely high performance, traditional and local and neighborhood, we can discern the key factors that have contributed to its effectiveness and sustainability.
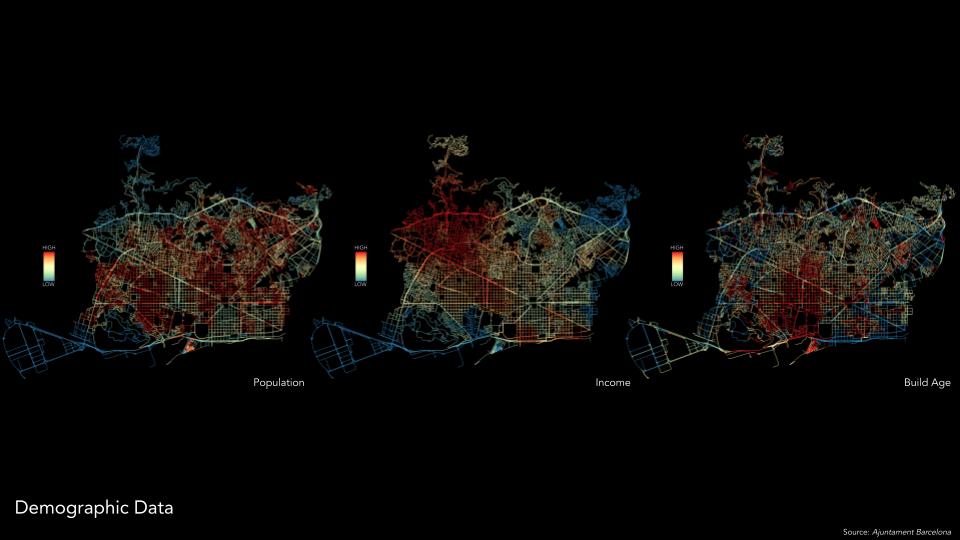
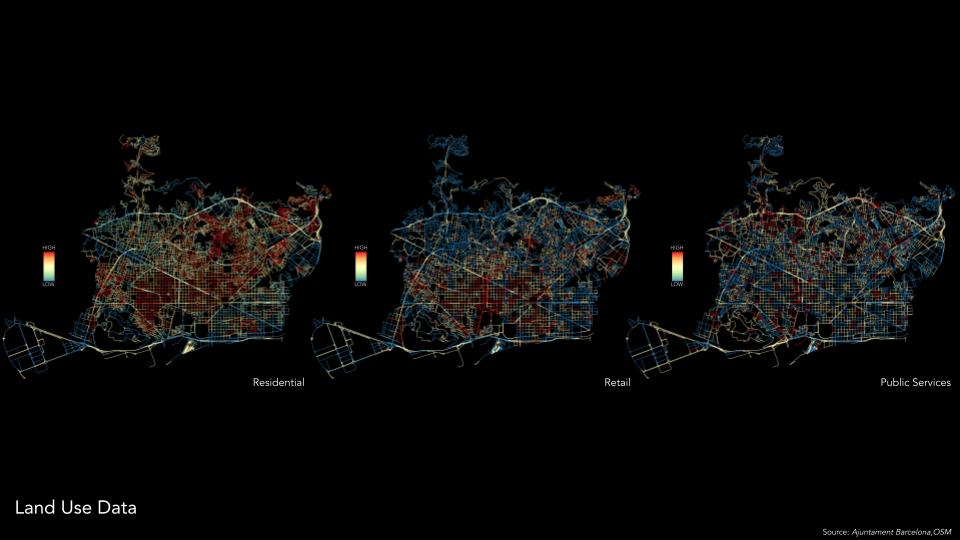
Within this chapter, an extensive analysis of diverse datasets pertaining to the city of Barcelona is conducted, and these datasets are then integrated into the Barcelona street network using the OSMnx library. Given the inherent variability in the raw data, which may take the form of point data or neighborhood-level data, a meticulous process of remapping, resizing, and spatial integration ensues. This comprehensive approach employs techniques like nearest neighbor analysis and point-in-polygon analysis, among others, to standardize the data into a consistent format. By doing so, it achieves uniformity in data configuration, which in turn facilitates the assignment of multiple attributes to each street. This process essentially bestows each street with a distinct identity through the amalgamation of various attributes, enabling a richer and more informative characterization of the urban landscape.
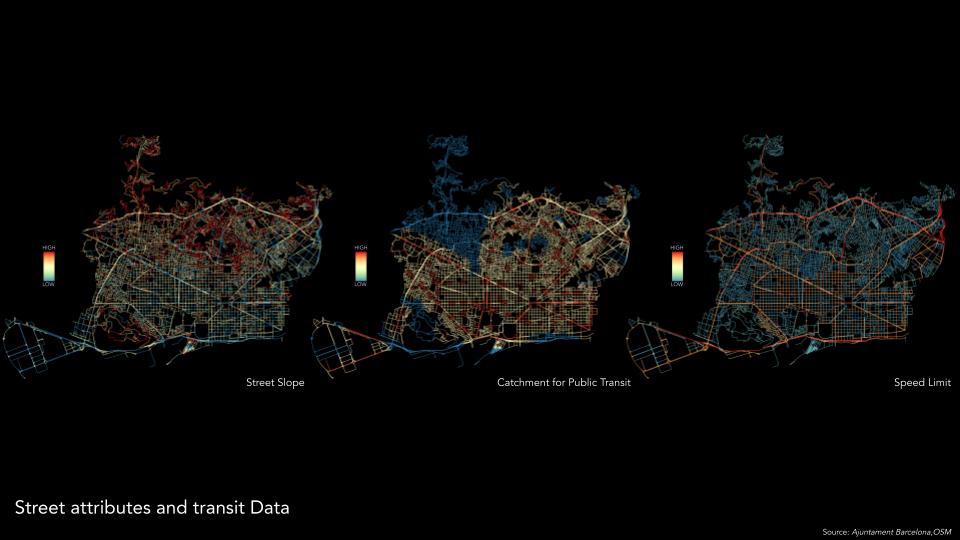
Network Pattern
The foundational element of this extensive dataset is its meticulous assembly of individual streets, each allocated a unique identifier as its primary column. These streets are not merely placeholders but reservoirs of valuable information, enriched with diverse attribute values that encapsulate their distinct characteristics. To enhance the dataset’s utility, streets are further adorned with labels, a process intricately tied to the types of bus routes that traverse them. These labels serve as the keys that unlock the dataset’s potential, allowing it to classify streets into three crucial route typologies: High Performance, Traditional, and Local and Neighborhood routes. This classification is a critical step that empowers the dataset to predict the typology of streets based on their unique attribute profiles.
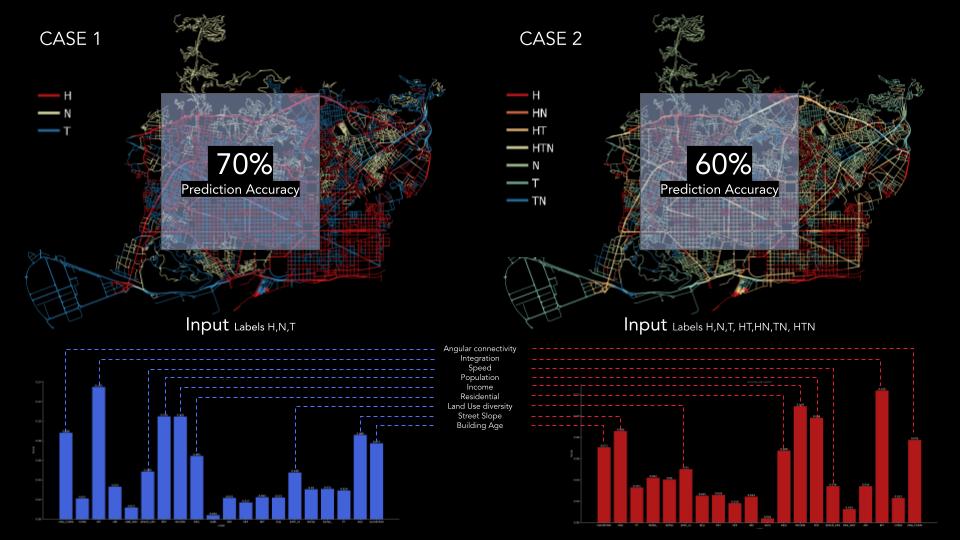
The process of labeling streets within this dataset unfolds through two distinct approaches: Case 1 and Case 2. In Case 1, streets are assigned labels based on a hierarchical framework, prioritizing the presence of High-Performance routes, followed by Traditional and Local and Neighborhood routes. This hierarchy mirrors the significance of each route type within the transit network. However, Case 2 embraces a more comprehensive approach, dispelling hierarchy in favor of a nuanced, multi-dimensional categorization system. Here, streets are classified into seven distinct labels, each representing a different combination of the three route typologies. This method casts a wider net, accommodating diverse permutations and combinations, capturing the intricacies of real-world transit scenarios.
When a machine learning algorithm is deployed with a randomly selected 20 percent of the dataset as the training data, using the Random Forest classification technique, the results yield an accuracy of seventy percent for Case 1 and sixty percent for Case 2. The slightly lower accuracy of Case 2 is outweighed by its holistic approach, which considers a more extensive range of possibilities when predicting the route typology of streets. Furthermore, these predictions offer insights into the significance of individual datasets in the prediction process. Datasets (fig42) that prove to have limited utility in enhancing prediction accuracy are meticulously identified and pruned from the dataset. This meticulous data refinement ensures that the dataset remains a potent tool for ongoing transit planning and optimization efforts, continually evolving to meet the demands of effective urban transportation planning.
A.I. Forecasting
Upon generating predictions for bus routes, the obtained results are seamlessly integrated into the dataset containing street characteristics. This dataset serves as a critical reference point for mapping out the new bus routes and comparing them with the existing ones. The core idea is to optimize bus transit by devising more efficient routes based on key factors like High-Performance criteria, Street Integration, and Public Transit Connection. The new bus routes are calculated as the shortest paths between origin and destination points while incorporating these weighted factors. This approach ensures that the new routes are not only efficient in terms of distance but also prioritize essential criteria for enhanced service quality.
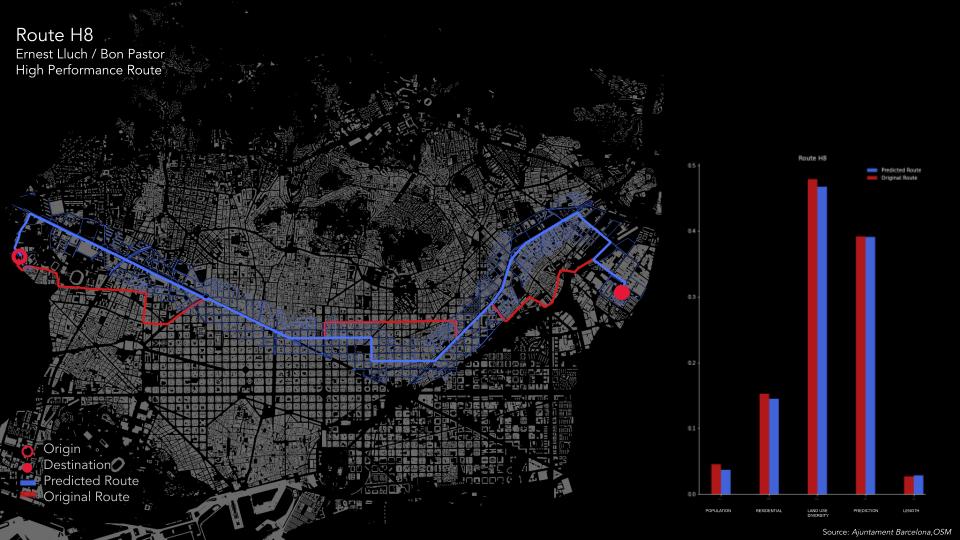
Conversely, when we analyze the original bus routes, we leverage the street characteristics dataset to calculate attributes like the population served by each route. This enables a direct comparison between the existing and newly predicted routes, utilizing the common ground provided by the shared dataset. While the model demonstrates promising results and often delivers superior or comparable outcomes to the existing routes, it’s important to acknowledge that some disparities arise due to the 60 percent prediction probability threshold. Nonetheless, this threshold doesn’t undermine the overall effectiveness of the methodology.
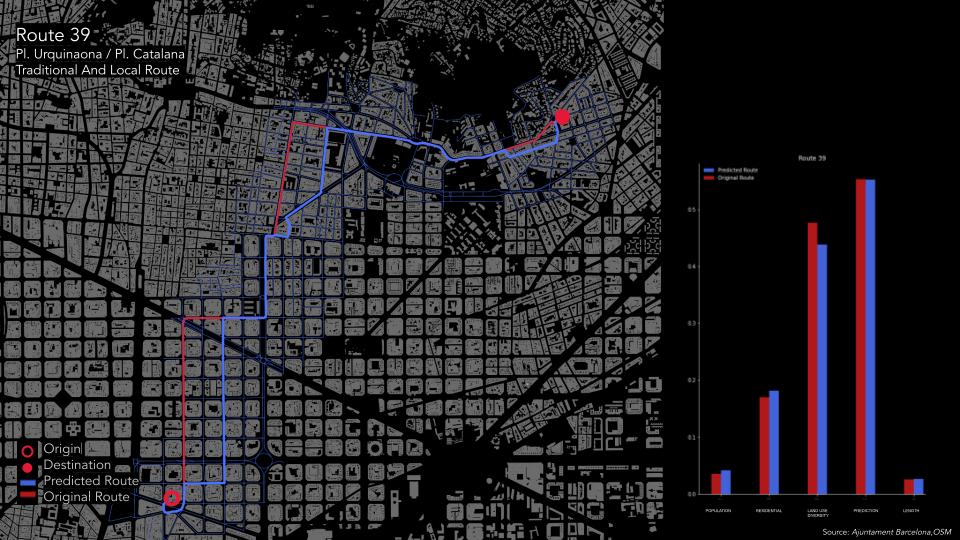
For instance, when we focus on Route 39, a new route generated by the model, we notice an increase in service to the population it caters to. This is a positive outcome. However, it’s also interesting to observe that the route traverses streets with lower land-use diversity and experiences only a marginal increase in length. One significant observation is that the methodology may not perform as effectively for neighborhood routes when solely relying on the shortest path approach. This indicates the need for alternative solutions and refinements to enhance the accuracy of predictions, particularly for routes within neighborhoods where intricate factors come into play.
Limitations and Future Scope
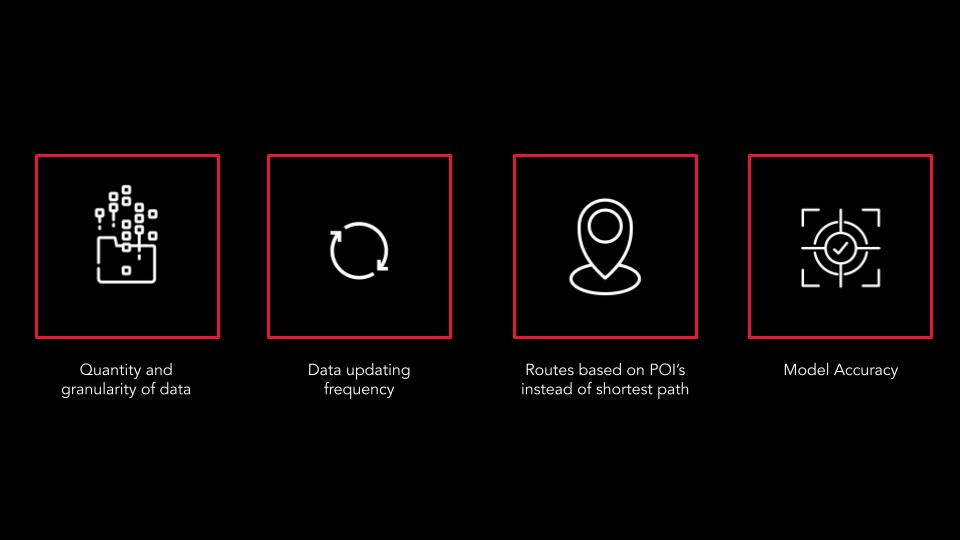
A significant limitation of this research pertains to the quality and consistency of data across different datasets within the same city under investigation, or occasionally between the model city and the city where the model is intended for replication. The presence of similar types of datasets greatly enhances the precision and reliability of the model and its predictions. Furthermore, the granularity of the data is a critical factor. It involves considerations such as whether a dataset, such as population data, is represented per building, block, or neighborhood. The finer the level of granularity in the data, the greater the potential for improved model accuracy and replicability.
The frequency of data updates emerges as another crucial aspect, enabling us to grasp the evolving dynamics within the city and to keep the bus network aligned with these changes. Regular updates ensure that the model remains relevant and responsive to shifting urban landscapes. Moreover, it’s imperative to note that not all datasets necessarily originate from the same timeframe. This temporal disparity can introduce inaccuracies into the model, as the data may not fully reflect the concurrent conditions in the city. This underscores the importance of synchronizing and harmonizing data sources to maintain the model’s accuracy and relevance over time.
An essential insight gleaned from the research is that planning neighborhood routes cannot solely rely on the shortest path approach. Such routes demand a deeper understanding of the local environment, the nuances of residing in that area, and active engagement with the public to shape route planning decisions. Addressing the limitations previously discussed, including data quality, homogeneity, granularity, and updating frequency, serves as a crucial endeavor to enhance the accuracy of the prediction model. By diligently working on these limitations, researchers can refine the model, making it a more reliable and effective tool for optimizing bus networks and enhancing urban mobility.
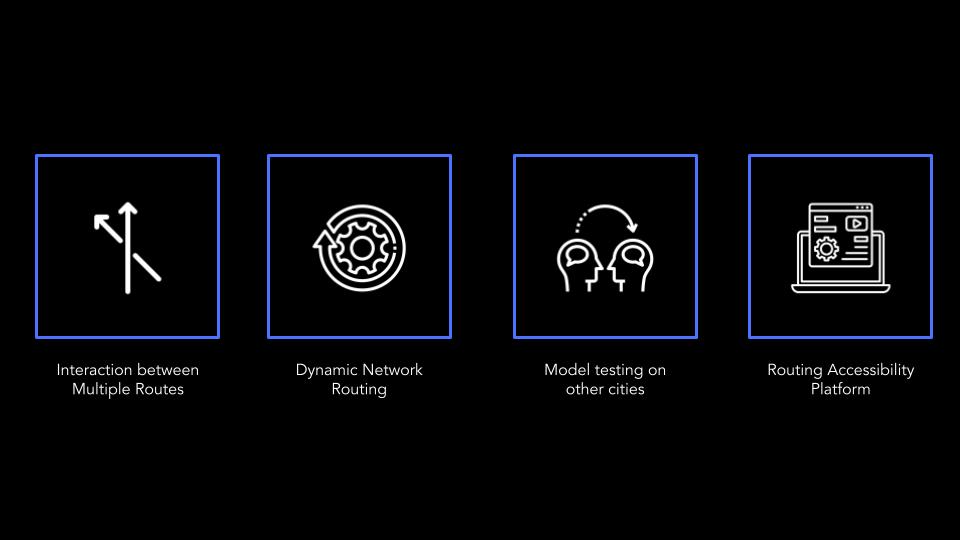
The significance of this research lies in its capacity to facilitate the creation of a replicable model for individual bus routes, drawing insights from the Barcelona case study. This model can subsequently serve as a blueprint for the development of bus networks in diverse cities. However, the natural progression of this research leads us to consider the broader implications and challenges The next logical step is to delve into the intricate task of reevaluating and reconfiguring the entirety of existing bus routes within a city. This involves not only the optimization of individual routes but also an exploration of how multiple routes can interact harmoniously.
Furthermore, a crucial next step involves comprehending the evolving dynamics of the city where the model is slated for replication. This understanding paves the way for establishing a dynamic planning framework, determining the intervals at which bus routes should be reevaluated and adjusted. These planning durations can be tailored to align with various factors, such as seasonal changes, fluctuations in tourism patterns, or other city-specific dynamics. In light of the time constraints within the scope of this research, a significant next step is to undertake the replication of the model in another city. This effort aims to evaluate the model’s adaptability and effectiveness in a different urban context, particularly concerning existing routes.
Looking ahead, a promising avenue for future development lies in the creation of an online platform tailored for urban planners. This platform would enable planners to input data files from both a model city and the city they intend to design a bus network for. Through user-defined permutations and combinations, the platform would generate outputs that facilitate the streamlined and efficient design of bus networks. Such a tool would not only enhance the efficiency of route planning but also foster more accessible and responsive urban transit systems.