
DETECTING SAND MINING USING MULTI-TEMPORAL SATELLITE IMAGERY
Introduction
Sand is ubiquitous in the modern world. It is the second-most extracted material on Earth after water, driven principally by the global demand for concrete, infrastructure, and urban expansion. Estimates place global sand and gravel extraction at 40–50 billion tonnes per year, a scale that outstrips many other extractive industries and accounts for a significant portion of the raw material footprint of contemporary development. This demand is not evenly distributed. Rapid urbanization, large-scale construction, and shoreline development in Asia, Africa, Latin America, and the Middle East have elevated sand from a local commodity to a global resource with international trade and informal supply networks.
While most sand extraction occurs domestically, shortfalls in legal supply have spawned cross-border movements of sand and extensive black-market activity. The global illegal sand trade—an underground economy involving trafficking, corruption, and organized syndicates—is estimated to be worth hundreds of billions of dollars annually, rivaling other illicit natural resource markets.
Despite its scale, sand extraction remains poorly regulated in many regions. Governance gaps, legal ambiguities, and weak traceability have enabled high rates of illegal extraction from rivers, beaches, dunes, and marine environments, contributing to habitat loss, altered sediment regimes, and coastal instability.
Why ?
Systemic Environmental Harm
The physical removal of sand at industrial scales disrupts natural systems:
- Accelerated coastal erosion and shoreline retreat as sediment sources are depleted.
- Altered river morphology, lowered water tables, and loss of aquatic habitat where riverbed sand is mined.
- Offshore dredging impacts, including suspended sediment plumes that reduce water quality and alter benthic ecosystems.
These changes are not local curiosities but ecosystem-scale disturbances with measurable knock-on effects on flood risk, biodiversity, and coastal resilience.
Social and Political Costs
Global sand extraction is entangled with uneven regulatory environments and informal economies. In many countries, powerful interests and weak enforcement enable illicit extraction, while frontline communities bear the costs:
- Loss of fisheries, tourism, and subsistence livelihoods.
- Erosion of legal authority as enforcement is undermined by corruption or political protection.
- Displacement of traditional land and water uses as infrastructure development accelerates around extractive sites.
These dynamics appear in contexts as diverse as South Asia, West Africa, and the Middle East.
The Core Problem: Visibility
If illegal sand mining is widespread, why is it so difficult to regulate? The answer is structural invisibility. Extraction sites may be remote, informal, or short-lived. Licensing boundaries are opaque. Enforcement is inconsistent. However, while sand may move through informal networks, it leaves spatial signatures. Our project focuses on one central question –
Can sand mining be systematically identified and distinguished—legal or illegal—using satellite data?
Case of Dwarakeshwar River in Bankura District, West Bengal, India
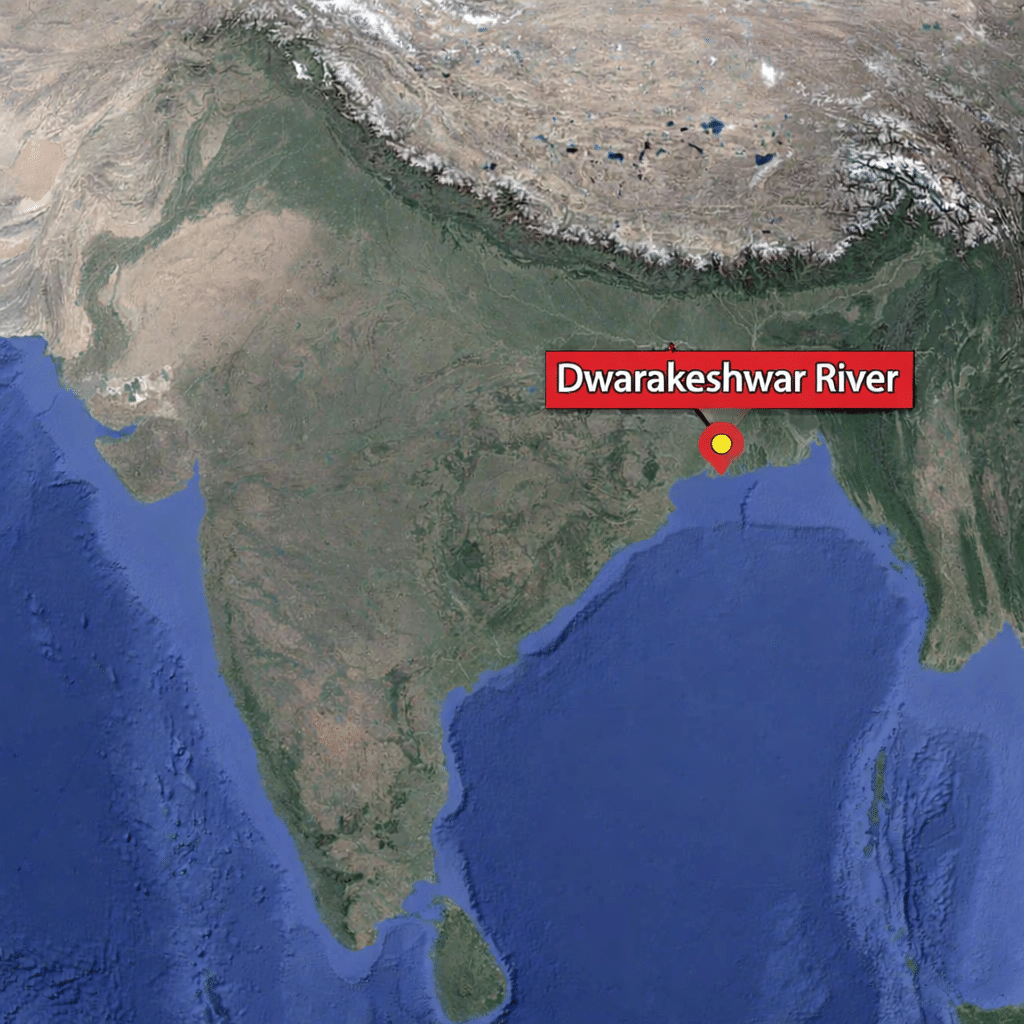
The Dwarakeshwar River is a significant river within the Western Ganga-Brahmaputra Delta (GBD), encompassing a basin area of 4,225 km² and extending between 22°40′ N to 23°31′ N latitudes and 86°30′ E to 87°48′ E longitudes.
Sand mining in the Dwarakeshwar River, is a significant minor mineral activity driven primarily by local construction demand. The riverbed contains coarse sand rich in feldspar and mica, making it highly valued for construction and industrial use. Surveys of the river have identified multiple active mining segments. The mining activity in Dwarakeshwar is largely regulated through state-sanctioned lease blocks, granted for defined areas and durations, usually around five years.
Despite regulation, the high extraction rates and intensive human intervention have notable environmental and socio-economic implications. Intensive mining can alter river morphology, cause localized bank erosion, and impact riparian vegetation. Sand demand from nearby towns such as Bankura and Bishnupur exerts further pressure on the river system.
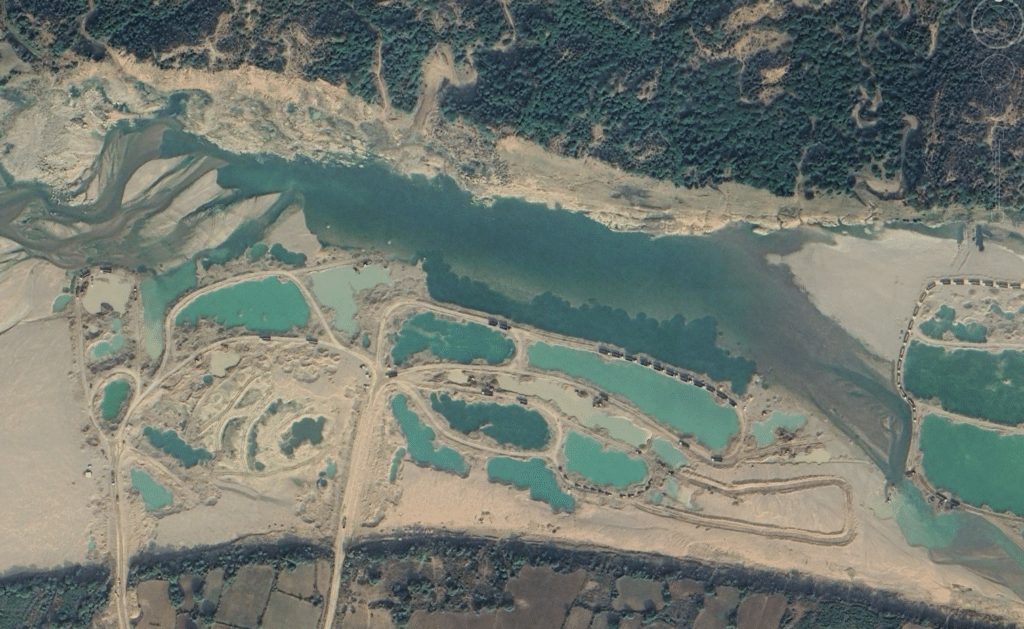
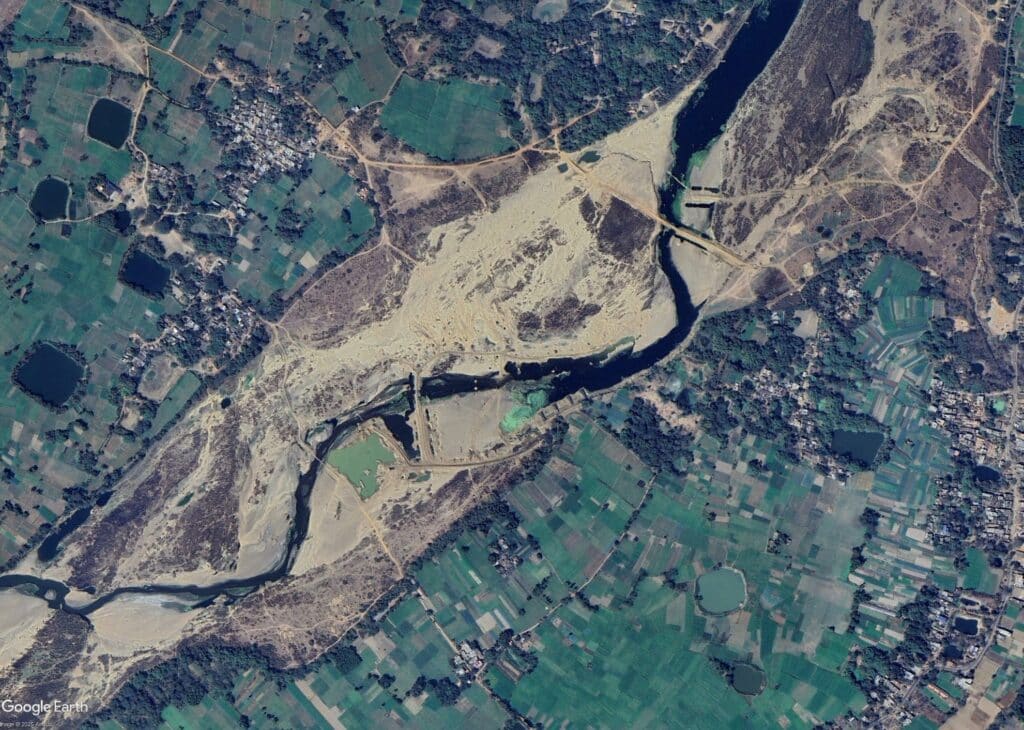
The floodplain in this reach is characterised by wide sandy point bars and inter-channel islands formed by braided channel morphology. Ground truth imagery (Google Earth, February 2025) confirms large-scale sand extraction across the floodplain, with evidence of heavy machinery, vehicle tracks, and water-filled excavation pits (Figure 2). The presence of these extraction pits on both banks and on inter-channel islands indicates that mining activity has expanded well beyond the active channel margin.
Approach
Rather than beginning with a single site, we are constructing a transferable detection framework.
The strategy is iterative:
- Identify confirmed sand mining sites.
- Extract measurable spectral and morphological traits.
- Develop indices that isolate these traits.
- Test these indices across suspected sites globally.
This phase focuses on index construction—not yet on full automation.
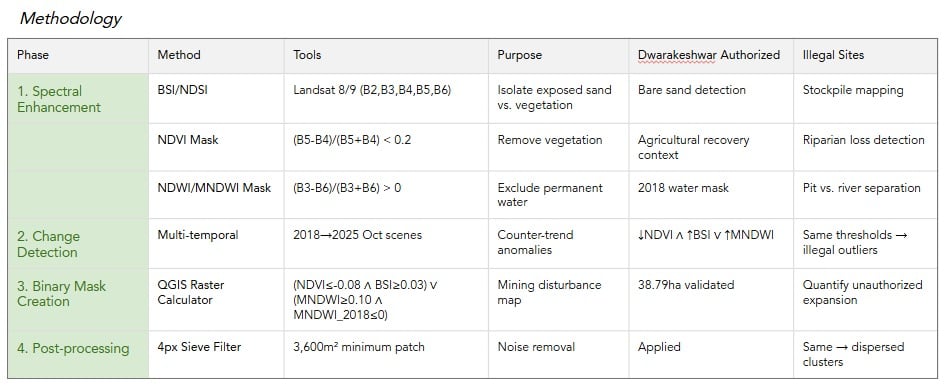
The methodology begins with spectral enhancement of Landsat 8/9 imagery using Bare Soil Index (BSI/NDSI) to isolate exposed sand surfaces, followed by masking vegetation (NDVI < 0.2) and permanent water bodies (NDWI/MNDWI > 0) to create clean change detection rasters. Multi-temporal analysis (2018→2025 October scenes) identifies sand mining as counter-trend anomalies: NDVI decline (≤-0.08) signals vegetation clearance, BSI increase (≥0.03) reveals bare substrate expansion, and MNDWI rise (≥0.10 on previously dry land) flags water-filled excavation pits. A QGIS Raster Calculator combines these into a binary disturbance mask via (NDVI_change≤-0.08 ∧ BSI_change≥0.03) ∨ (MNDWI_change≥0.10 ∧ MNDWI_2018≤0), followed by a 4-pixel sieve filter (3,600m² minimum) to eliminate noise and ensure mapping units match 30m resolution.
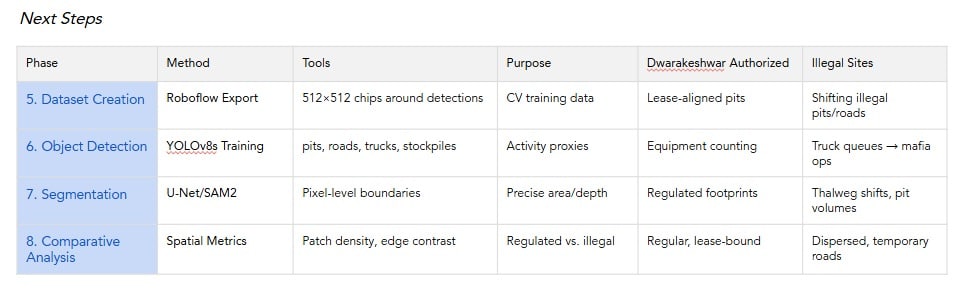
This pipeline transitions to computer vision by exporting validated detection chips (512×512 pixels) via Roboflow for YOLOv8 object detection training on pits, roads, trucks, and stockpiles, enabling activity intensity proxies like truck queues invisible at Landsat scale. U-Net/SAM2 segmentation refines pixel-level boundaries for precise area/depth measurements, while comparative application to Dwarakeshwar (regulated, lease-aligned) versus Ken River (dispersed, illegal) reveals distinct patterns: stable footprints and seasonal cycles in the former versus shifting clusters, deep over-extraction, and temporary haul roads in the latter. This scalable framework supports governance monitoring and urban biodiversity impact assessment, directly extending your spectral exercise into automated, ONNX-deployable tools.
Identification: What We Look For
Sand mining alters landscapes in specific, repeatable ways.
- Vegetation clearance (NDVI)
- Bare Sand Exposure (BSI)
- Water-filled Excavation Pits
- Counter trend anomalies
- Object level features
Normalized Difference Vegetation Index (NDVI) measures photosynthetically active vegetation.
Mining removes riparian vegetation, causing measurable NDVI decline. In our case study, declines ≤ –0.08 between 2018–2025 were interpreted as vegetation clearance associated with extraction
Bare Soil Index (BSI) detects exposed mineral surfaces.
Mining increases exposed substrate, producing elevated BSI values. An increase ≥ 0.03 between temporal snapshots at riverbank locations is interpreted as increased bare surface exposure consistent with active or recent extraction.
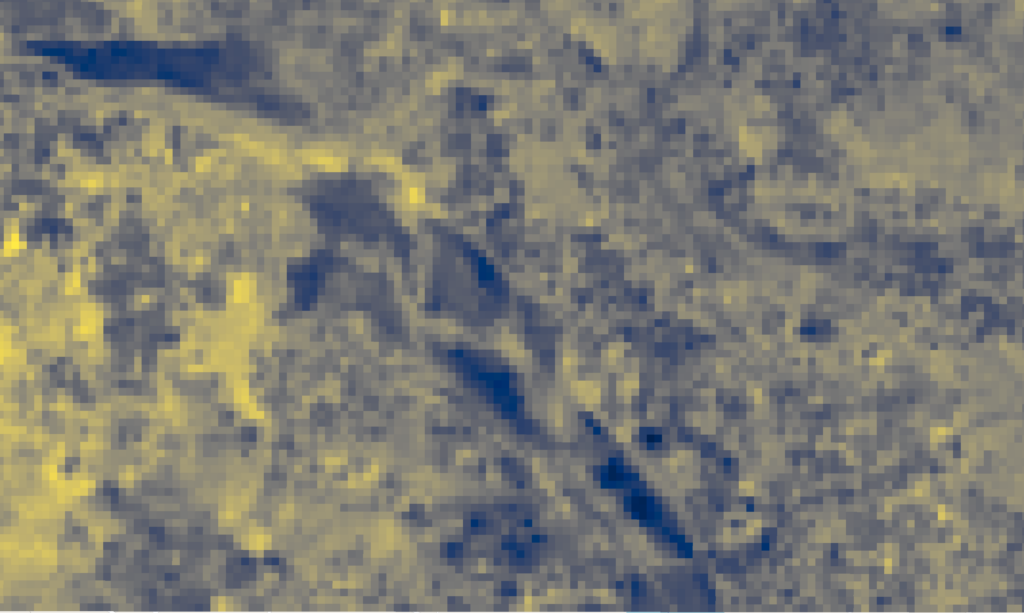
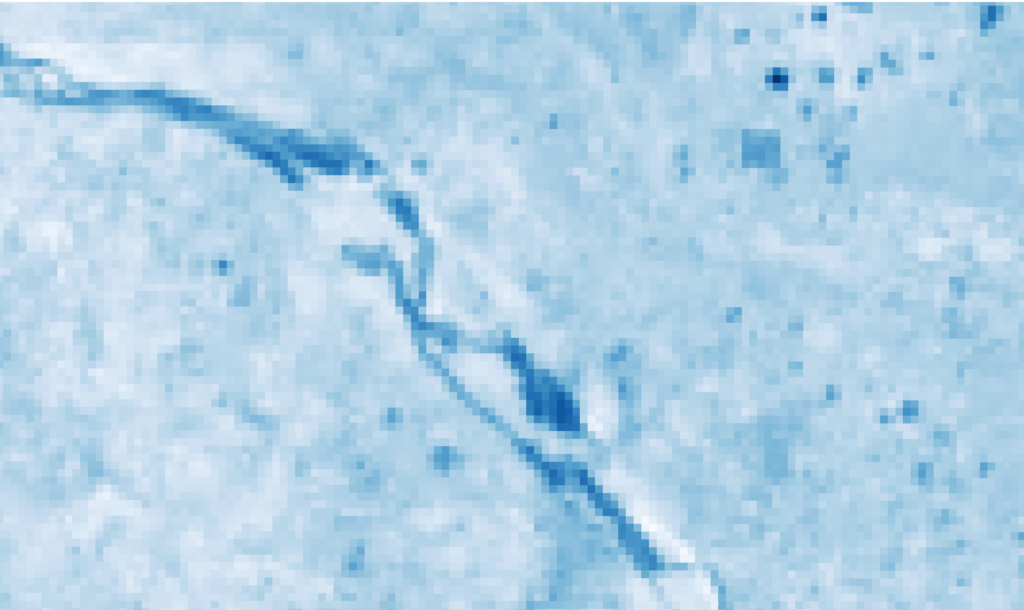
Modified Normalised Difference Water Index (MNDWI) isolates surface water while suppressing vegetation and built-up noise.
MNDWI detects surface water with high sensitivity, suppressing built-up and vegetation noise. In the context of sand mining, MNDWI is particularly important for identifying water-filled excavation pits — a characteristic post-extraction landscape feature.
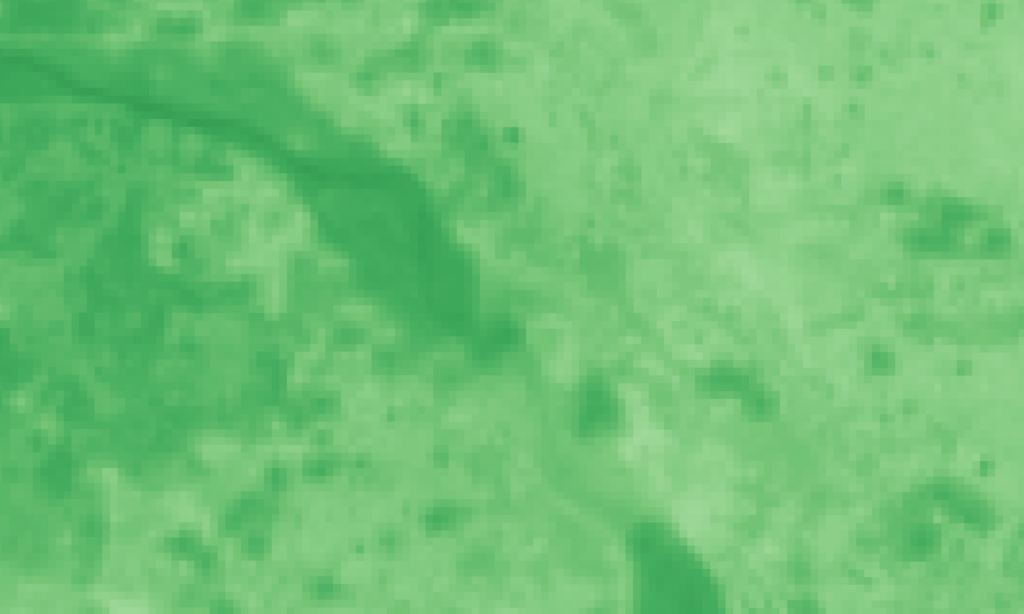
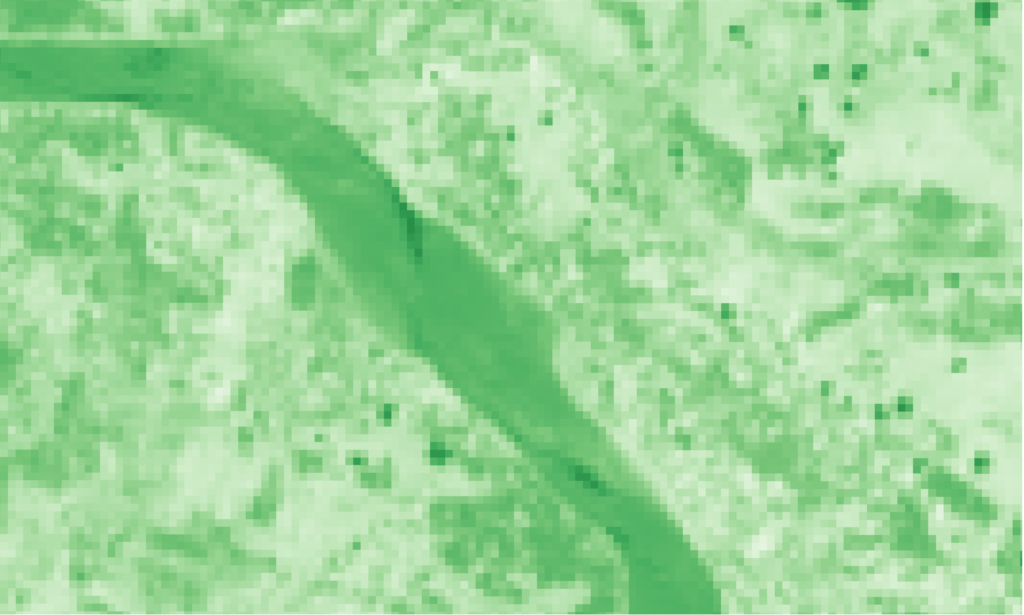
Change detection was performed by computing the pixel-wise difference between 2025 and 2018 index values for each of the four indices. Same-season imagery (October) was selected for both years to minimize phenological confounding effects. The use of Landsat Collection 2 Level 2 surface reflectance products, with consistent atmospheric correction applied across both dates, ensures that observed differences reflect real land surface changes rather than atmospheric artefacts.
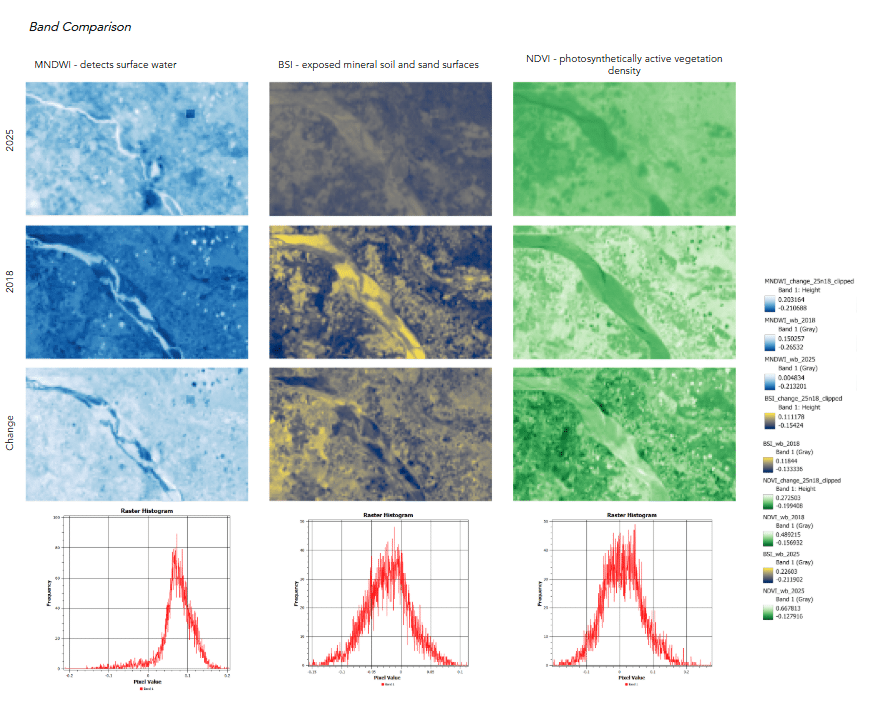
The overall landscape trend for the Dwarakeshwar study area between 2018 and 2025 showed net vegetation increase (positive NDVI skew) and net bare soil decrease (negative BSI skew), consistent with agricultural intensification and vegetation recovery across the broader landscape. Sand mining sites are therefore identified as counter-trend anomalies — pixels where NDVI declined while MNDWI increased — embedded within this general landscape recovery pattern.
Counter – Trend Anomalies
While the broader landscape showed agricultural recovery (↑ NDVI, ↓ BSI), mining areas behaved as counter-trend anomalies:
↓ NDVI ∧ ↑ BSI ∨ ↑ MNDWI (on previously dry land)
Mining does not always dominate the landscape signal—it often appears as embedded disruption within broader recovery patterns. The overall landscape trend for the Dwarakeshwar study area between 2018 and 2025 showed net vegetation increase (positive NDVI skew) and net bare soil decrease (negative BSI skew), consistent with agricultural intensification and vegetation recovery across the broader landscape. Sand mining sites are therefore identified as counter-trend anomalies — pixels where NDVI declined while MNDWI increased — embedded within this general landscape recovery pattern.
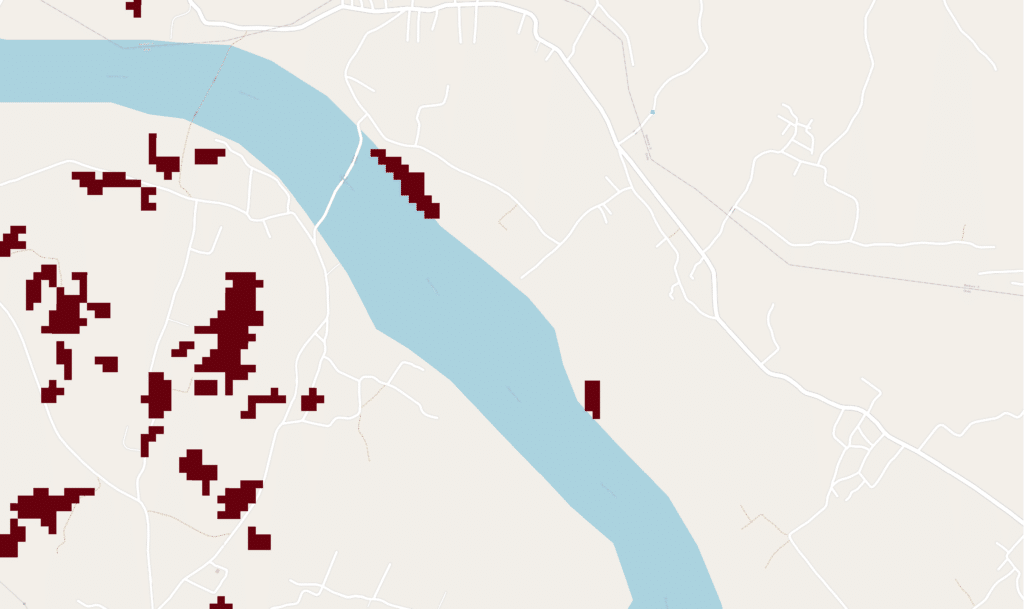
A binary mining disturbance mask was constructed by applying threshold criteria to the NDVI change and MNDWI change raster. The following expression was implemented in the QGIS Raster Calculator:
(NDVI_change < –0.08 AND BSI_change > 0.03) OR (MNDWI_change > 0.10)
The AND condition captures classic dry sand extraction signatures — simultaneous vegetation loss and bare soil increase. The OR condition independently captures water-filled pit formation on previously dry land. The NDVI threshold of –0.08 was selected to exceed background phenological variation while capturing genuine vegetation clearance. The MNDWI threshold of +0.10 targets the upper tail of the change distribution, excluding minor moisture fluctuations. These thresholds were validated against the landscape-wide distribution histograms of each change index.
A Sieve filter (minimum patch size: 4 pixels = 3,600 m²) was applied to the binary mask to remove isolated noise pixels. Patches smaller than 4 contiguous pixels are below the minimum mapping unit justifiable at 30m resolution and were excluded from further analysis.
Object level Features
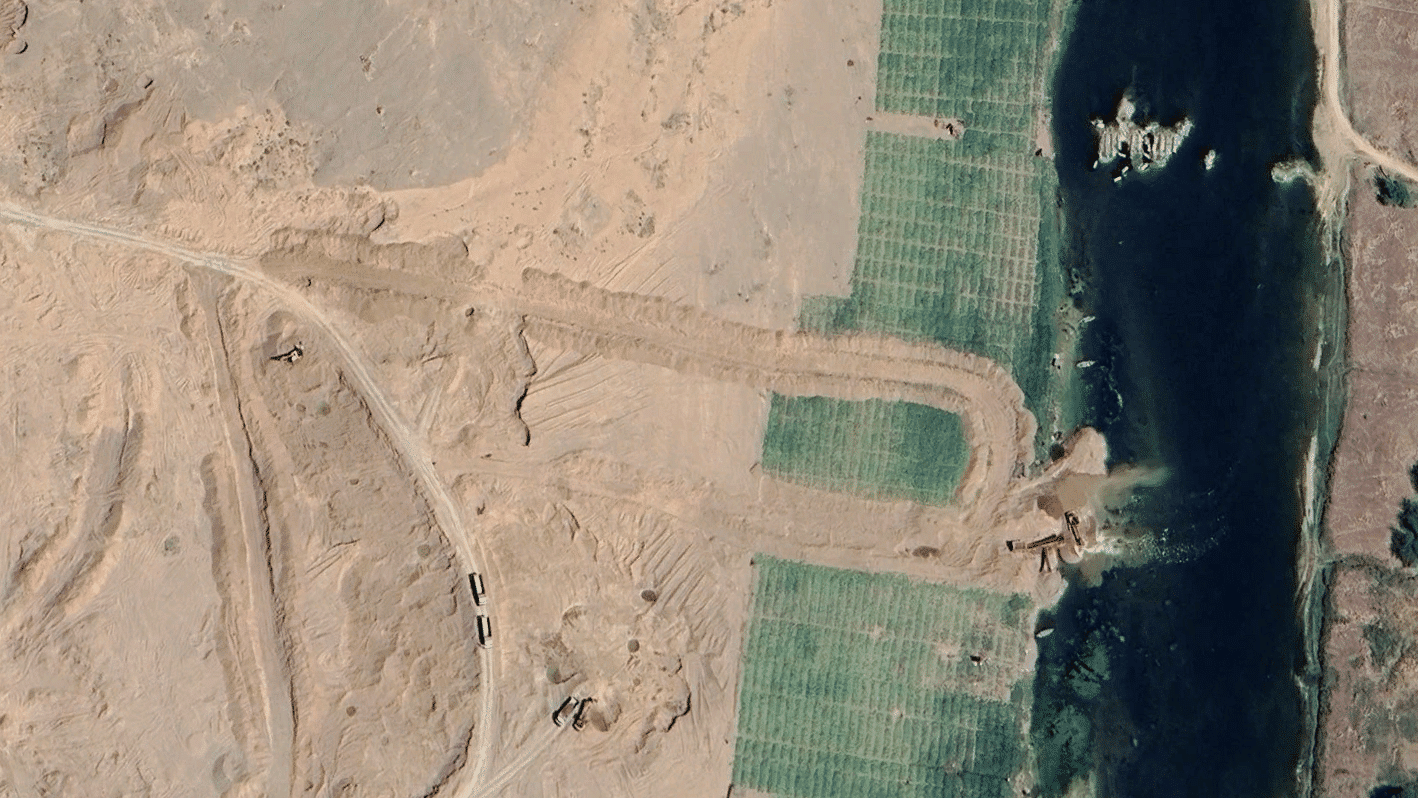
From high-resolution imagery, visible objects include:
- Excavation pits (10–100 m water bodies with sharp edges)
- Sand stockpiles (50–200 m light tan expanses)
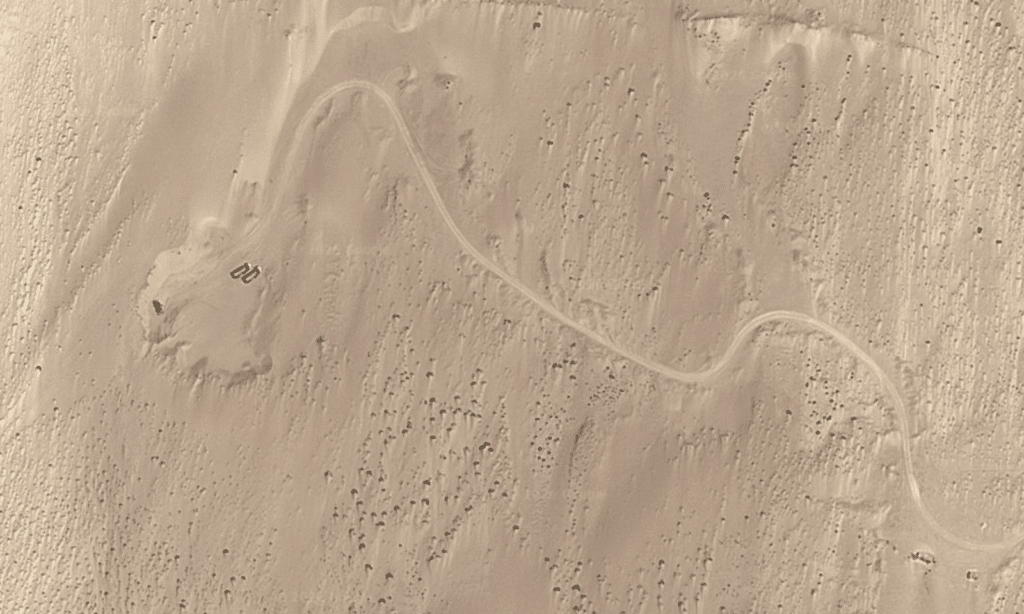
- Dirt roads radiating from river to pits
- Vehicle tracks and linear scars
- Trucks and heavy machinery
Next steps
After developing and validating a satellite-based and computer vision methodology to systematically monitor sand mining dynamics in the Dwarakeshwar River, the same analytical framework will be extended to the sites of illegal sand mines for example in Ken River, Chatkan meander, Banda, Uttar Pradesh, India to specifically examine patterns of unauthorized and illegal sand extraction.
In the Ken basin, the objective will be to detect unpermitted in-stream excavation, quantify spatial expansion of mining pits, assess deviations from regulated extraction depths, and monitor temporal shifts in river morphology that may indicate clandestine operations beyond approved lease boundaries.
The comparative application of the same satellite and computer-vision methodology to the Dwarakeshwar River and the Ken River may reveal the following distinctions:
- Regulatory Pattern – Lease-aligned, spatially regular extraction (Dwarakeshwar) versus dispersed, shifting, and unauthorized mining clusters (Ken).
- Morphological Impact – Controlled sediment removal with gradual channel adjustment versus deep pits and abrupt thalweg shifts from over-extraction.
- Temporal Activity – Seasonal, policy-compliant operations versus continuous or concealed extraction signatures.
- Riparian Effects – Localized bank disturbance versus extensive erosion and vegetation loss.
- Hydrological Change – Moderate hydrological alteration versus artificial pools and disrupted groundwater–surface interactions.
- Infrastructure Footprint – Stable, traceable access routes versus temporary haul roads and rapidly shifting machinery zones.
This comparison will help us distinguish regulated geomorphic modification from extractive destabilization linked to illegality, reinforcing remote sensing as a governance and ecological monitoring tool.
Build a model to identify illegal sand mining:
- Learn Legal Mining Signatures – Use satellite and computer vision to identify patterns of authorized extraction as a reference.
- Detect Deviations – Train the model to recognize spatial, temporal, and morphological anomalies that indicate unpermitted mining.
- Identify Infrastructure Cues – Teach the model to distinguish temporary haul roads, stockpiles, and machinery associated with illegal operations.
- Quantify Extraction Intensity – Calibrate thresholds for excavation depth and pit size to flag excessive or unregulated activity.
- Automate Monitoring – Create an algorithm that can scan river stretches continuously to highlight potential illegal mining zones.
Collectively, this approach transforms into building a scalable, evidence-based monitoring model targeting illegal sand mining.
By extending the validated satellite and computer-vision methodology, we can systematically detect and monitor illegal sand mining. The comparative analysis will highlight contrasts in regulatory compliance, morphological impact, temporal activity, riparian effects, hydrological change, and infrastructure patterns, enabling clear differentiation between legal and unauthorized extraction. Building on these insights, a predictive model can be developed to identify illegal mining by learning legal mining signatures, detecting deviations, recognizing temporary infrastructure, and quantifying extraction intensity. Once automated, this model can continuously monitor river stretches, providing a scalable, evidence-based tool for governance, ecological protection, and sustainable river management.
