
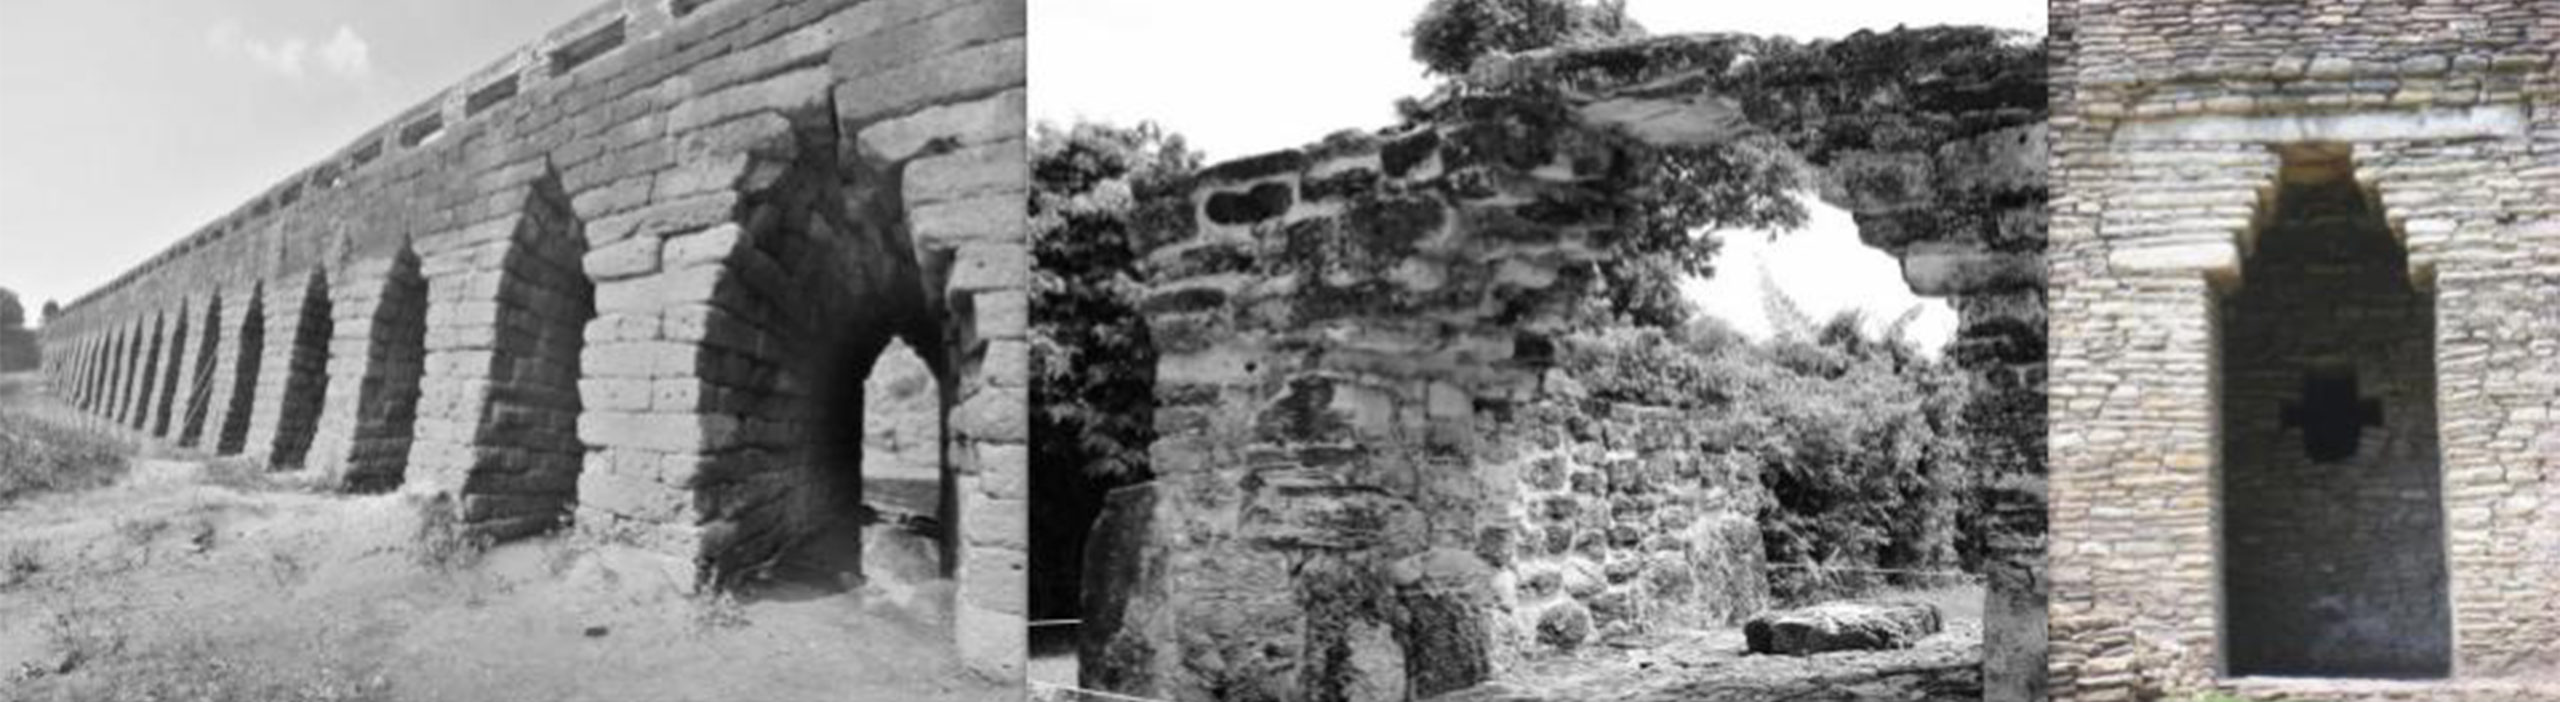
We decided to study how machine learning can help us to stack stones and build corbel arches. Corbel arches are a type of arch structure in which the arch is formed by successively projecting stones or bricks from each side until they meet at the center. The arch relies on the structural integrity of the stacked masonry to support the load above, and as such, the arch’s behavior is governed by the materials used and the geometry of the arch.
We defined a following problem:
- User wants to build an arch from a certain type of block, under certain load condition and achieving certain opening and we want to predict, number of blocks does the user need, and what will be resulting shape of the arch.
- • Based on the inputs of desired opening, width of the blocks, height and load case, the model would predict the number of blocks and the shape of the arch.
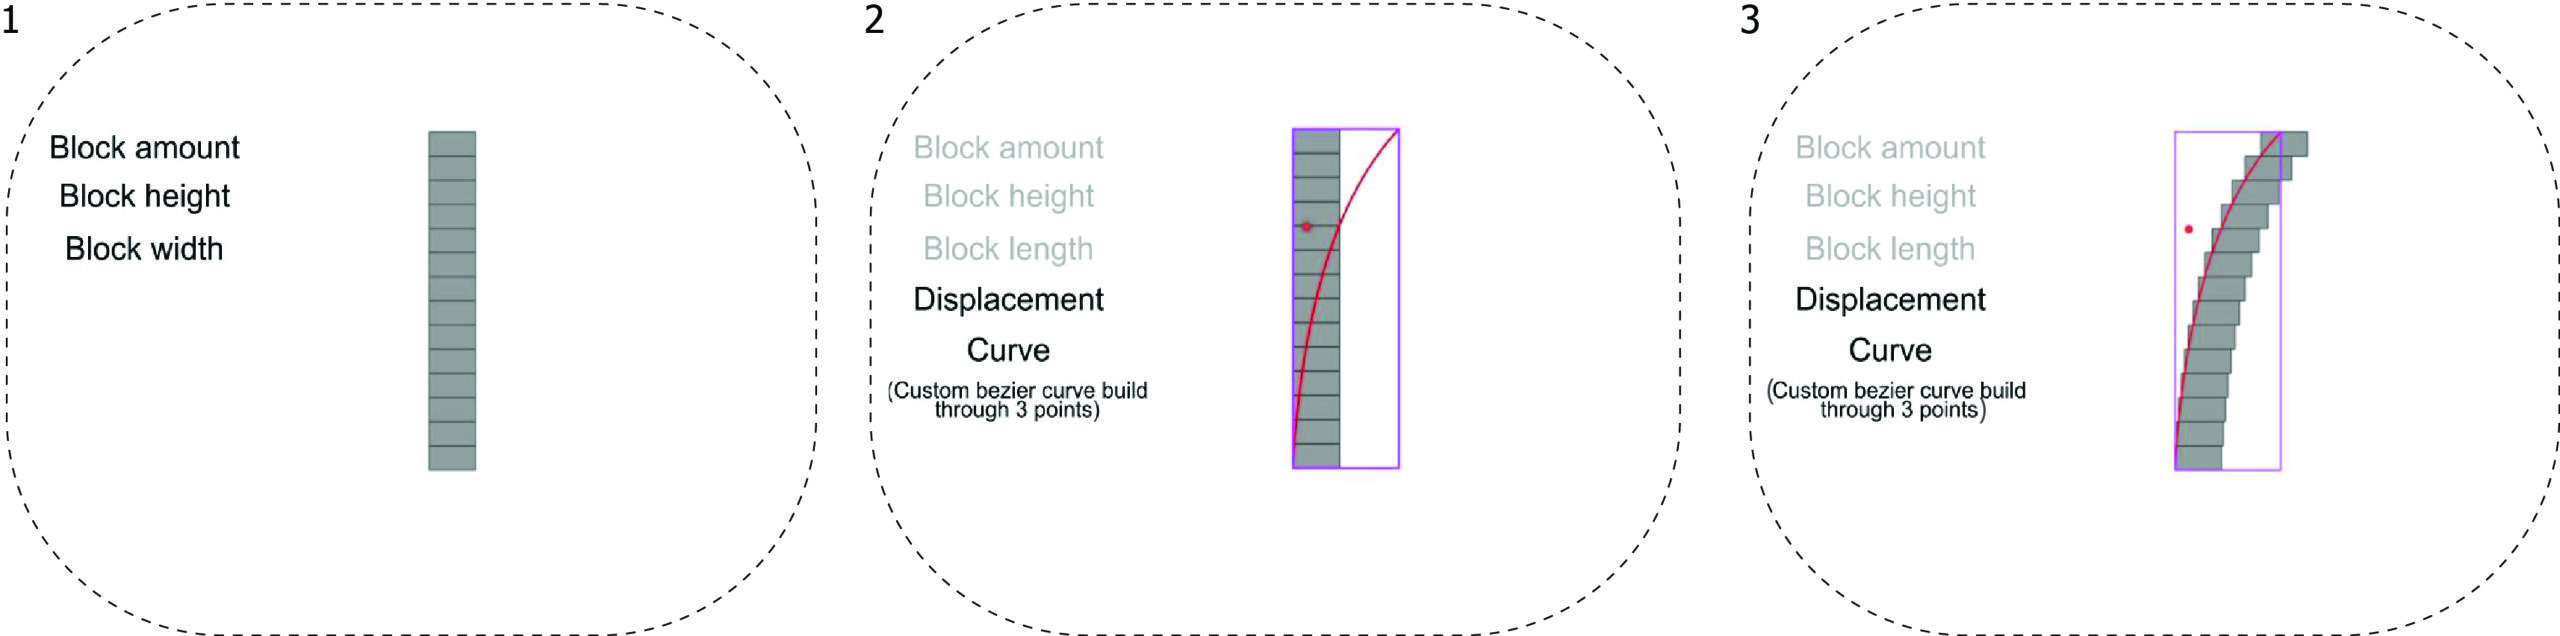
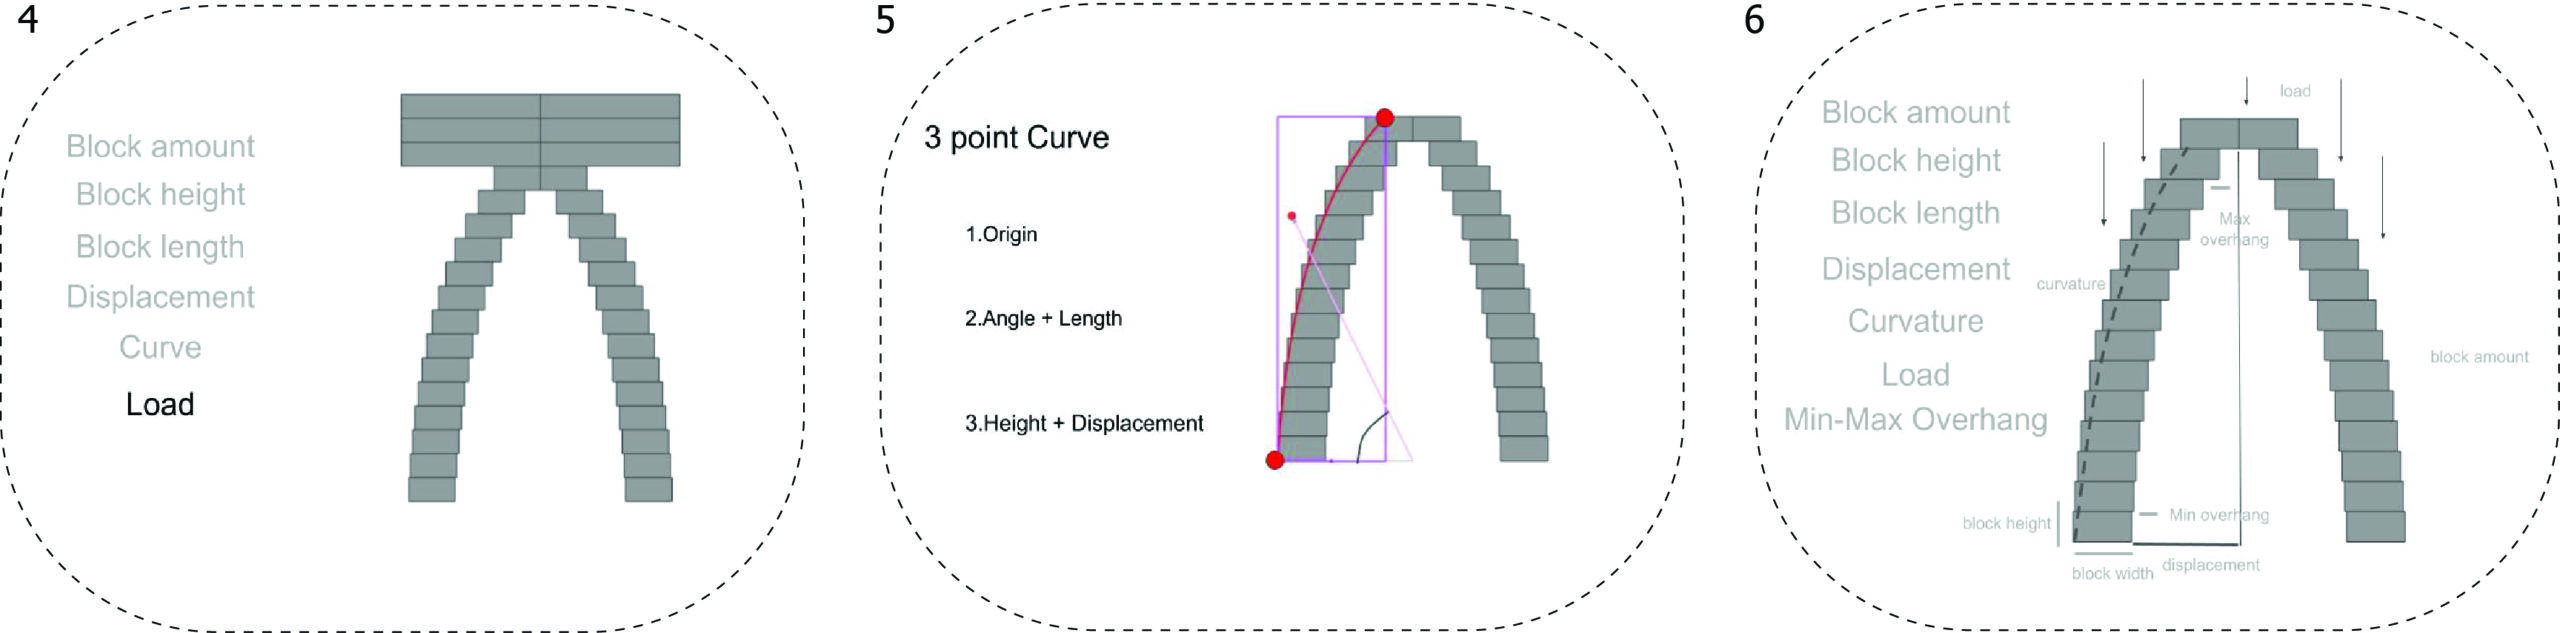
- We started defining what parameters do we have in a corbel arch:
- • An important part was to figure how we can reproduce our arch from prediction. This is why we encoded the position of the blocks by the Bézier curve. The curve consists of three points. Start and end are encoded from other parameters, while the middle point is encoded by the angle and length of the vector.
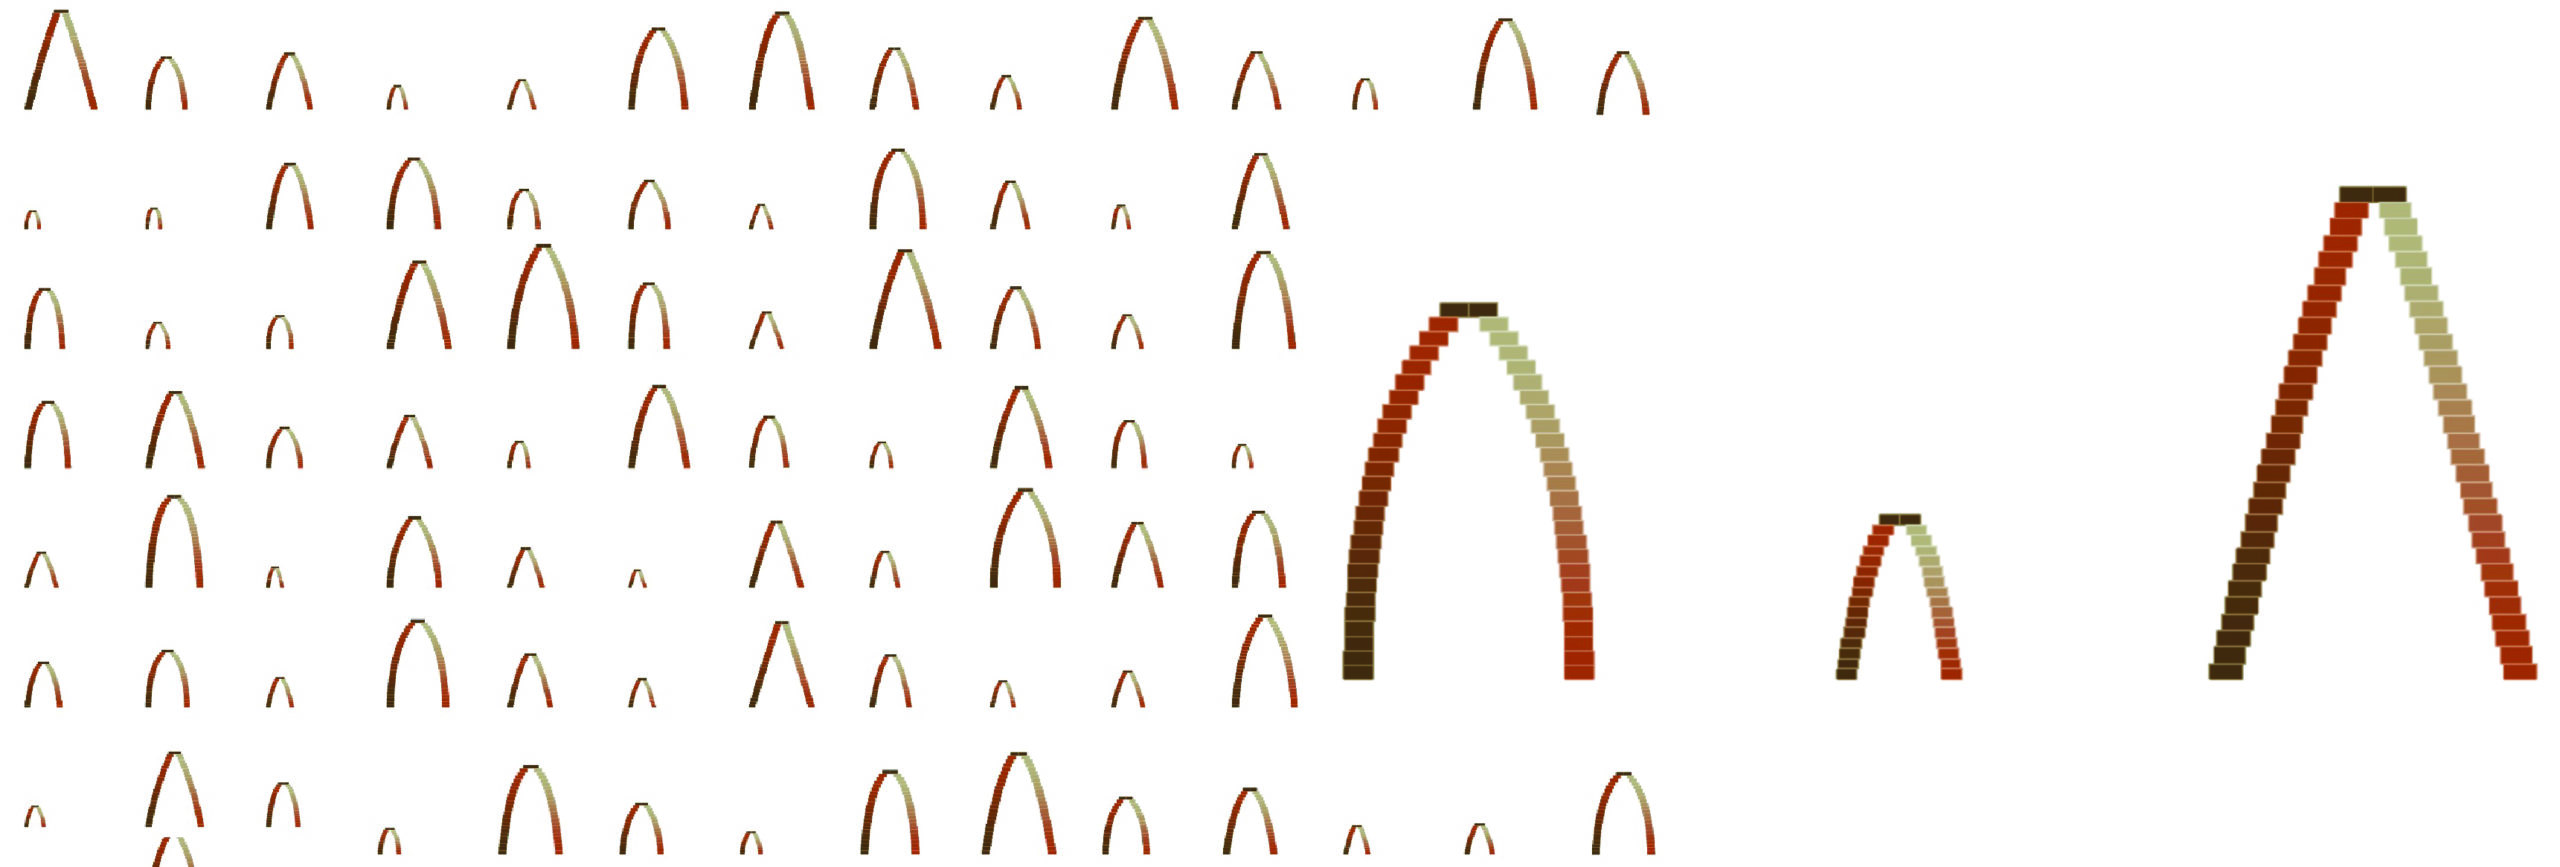
- The next step was to generate a dataset of different arches and test their stability. The simulation was done with the help of the PhysX plugin. For every random arch we were placing random amount of blocks on top to simulate different loads

PhysX/ Stability simulation
Classification
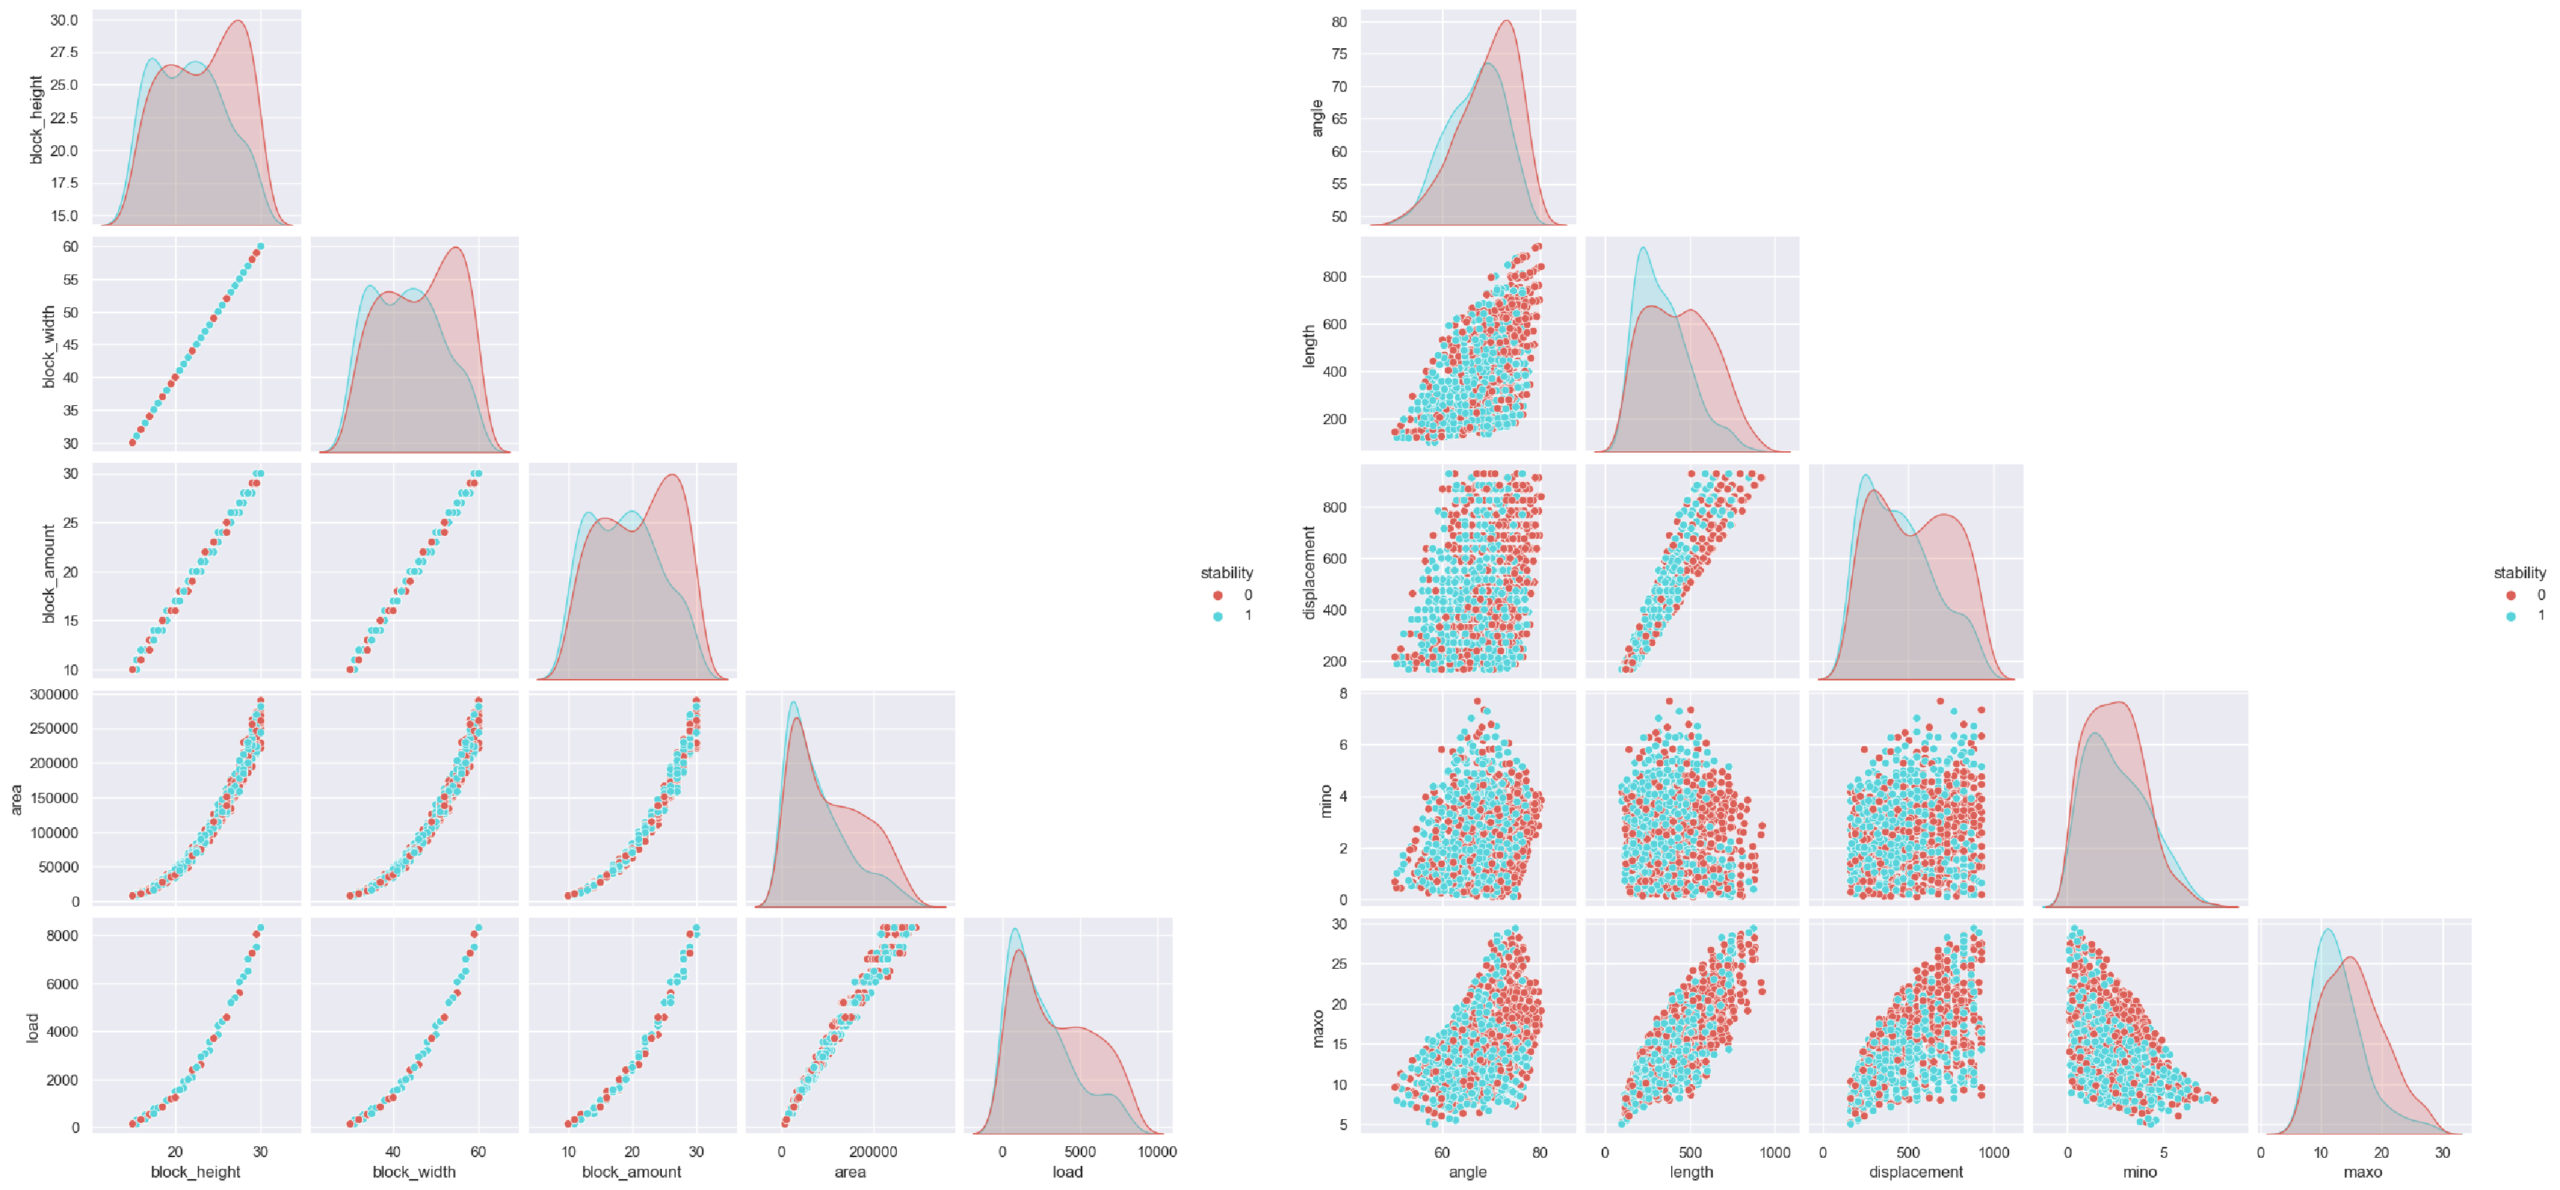
Initially, we employed classification models to categorize the arches into stable and unstable based on their stability. Out of the total of 1068 arches, 585 arches are stable(0), while 483 arches are classified as unstable(1). The distribution of the stable(0) and unstable( )1 arches are combined in the same clusters.

The entire dataset, block parameters as height, width, load – curve parameters angle, length, displacement from the shape of the curve and arch parameters area minimum overhang, maximum overhang, stability, block amount. The plot shows diverse relationships among the features, such as linear and polynomial trends, as well as visible patterns among the noisy correlations.
From a classification perspective, the representation of features exhibits a scattered mixture of stable and unstable arches.
Breaking down the information; block height, width, and amount which are block parameters have linear correlations, area from arch space and load are given polynomial relation, length, angle from curve parameters and minimum, maximum overhang from arch space gives noisy correlation with relative tendency.
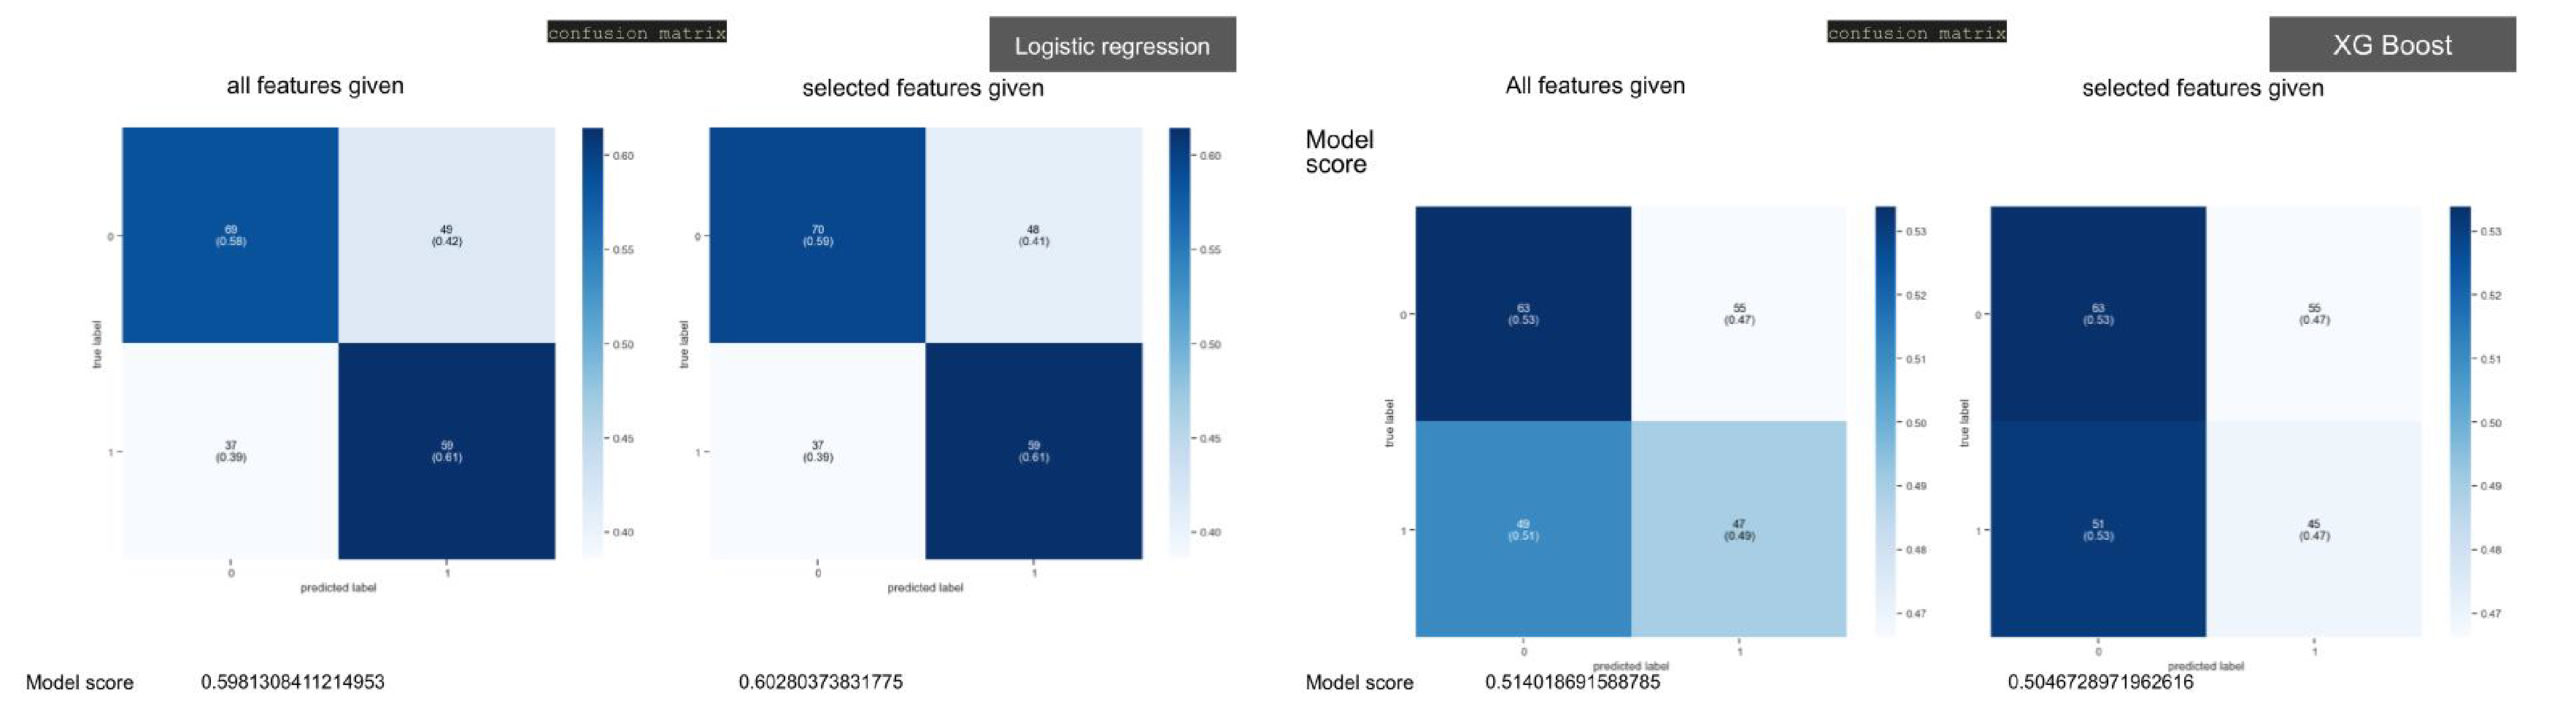
Even though the information looked indistinctive to extract from the defined features we applied shallow classification models.

With the all features on the dataset on the left and selected features combination which gives the highest model score on the right, the classification matrixes does not give fair accuracy with logistic regression. The same method classified with XGBoost had less accuracy to classify the arches. We tried ANN classification but haven’t got reasonable results.
Based on the analysis and results we could say that the dataset does not work to classify the arches we created. The reason could be the way we built the model or the features we selected.
Regression
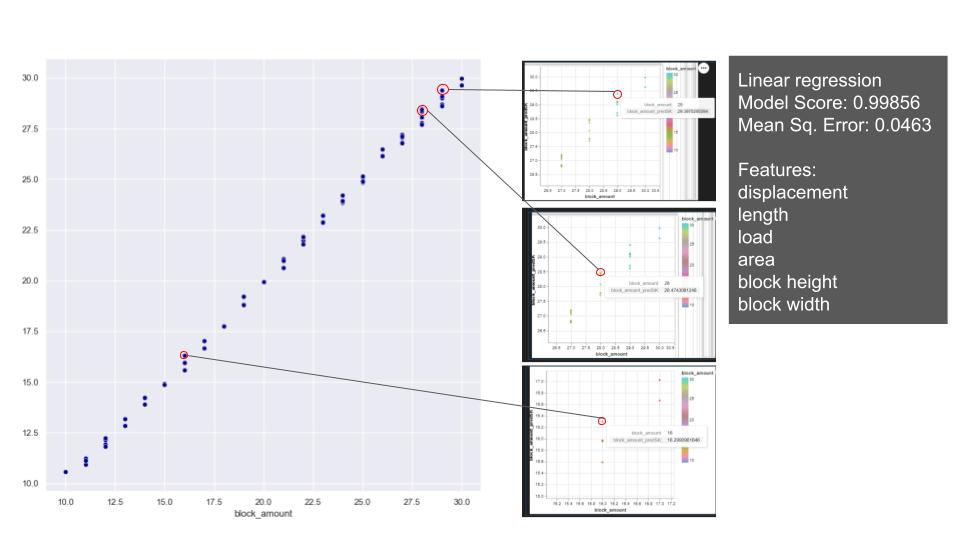
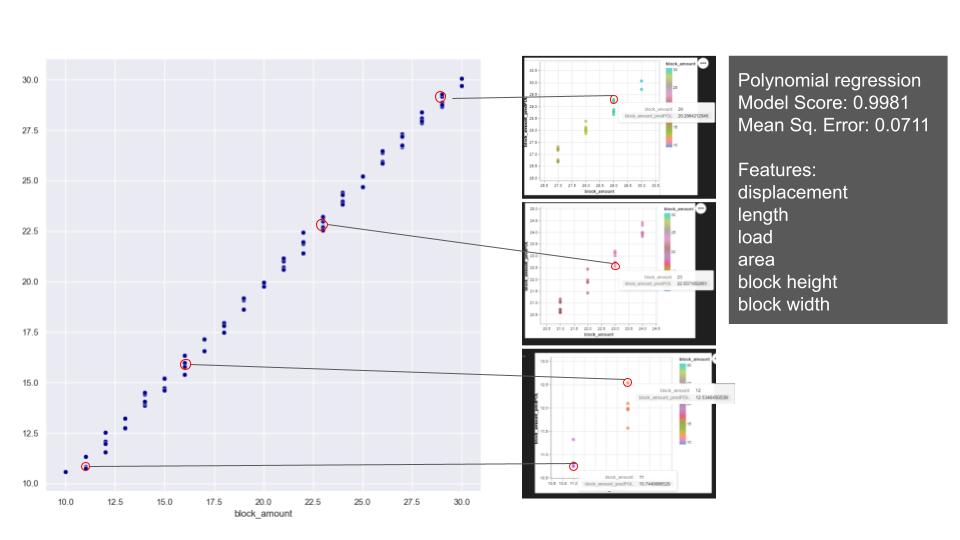
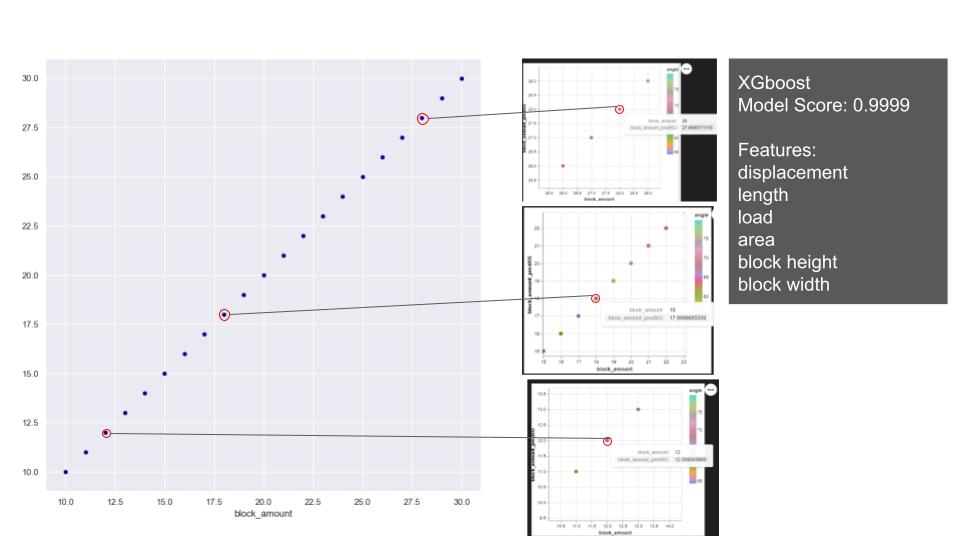
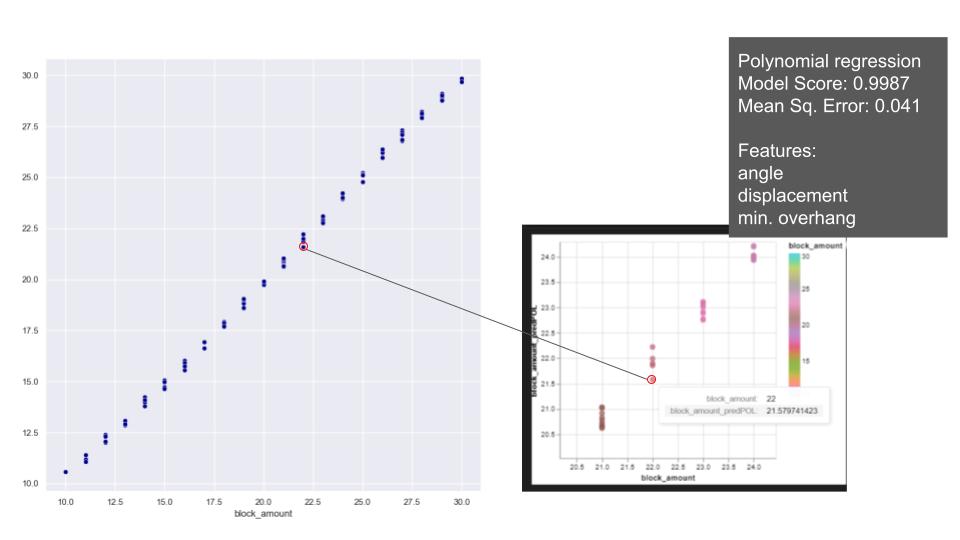
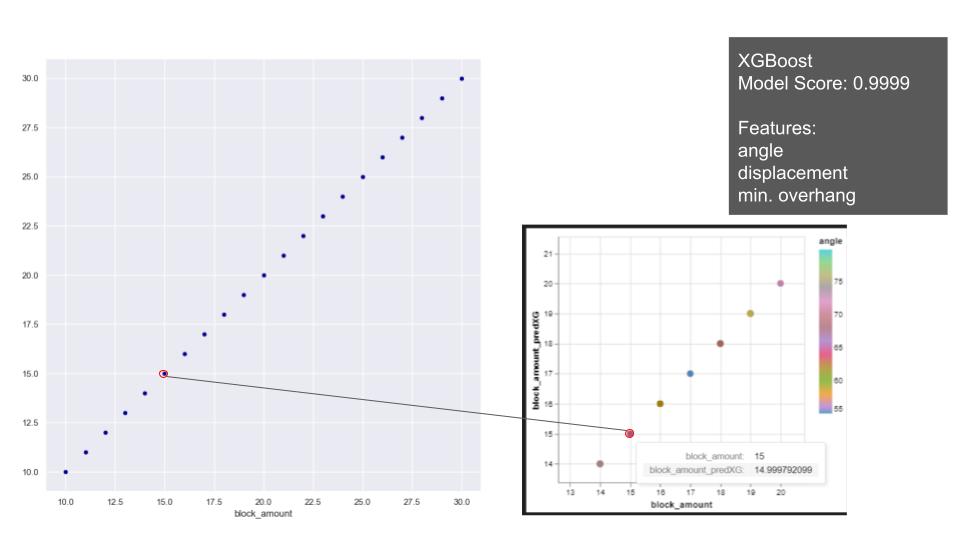
Later regression models were applied with stable arches dataset to predict the block amount. On the relations of the features in block amount, the overall distribution of block amount on the plots shows a consistent and gradual progression. Notably, we observe that all the features exhibit changes while maintaining consistent ratios with each other. Based on that, we applied linear and polynomial regression and XGBoost. With linear and polynomial related features, the linear regression achieves to predict the block amount close to test values. Since the model is predicting float numbers, it is hard to capture integer which we require for building an arch. Polynomial model also has a similar model score and relatively higher mean square error with the selected features. The reason for not achieving an exact number is related to integer and float relation/ requirement. But it does not exceed the prediction of more than one block error. XGBoost shows better performance and predicts the closest numbers.

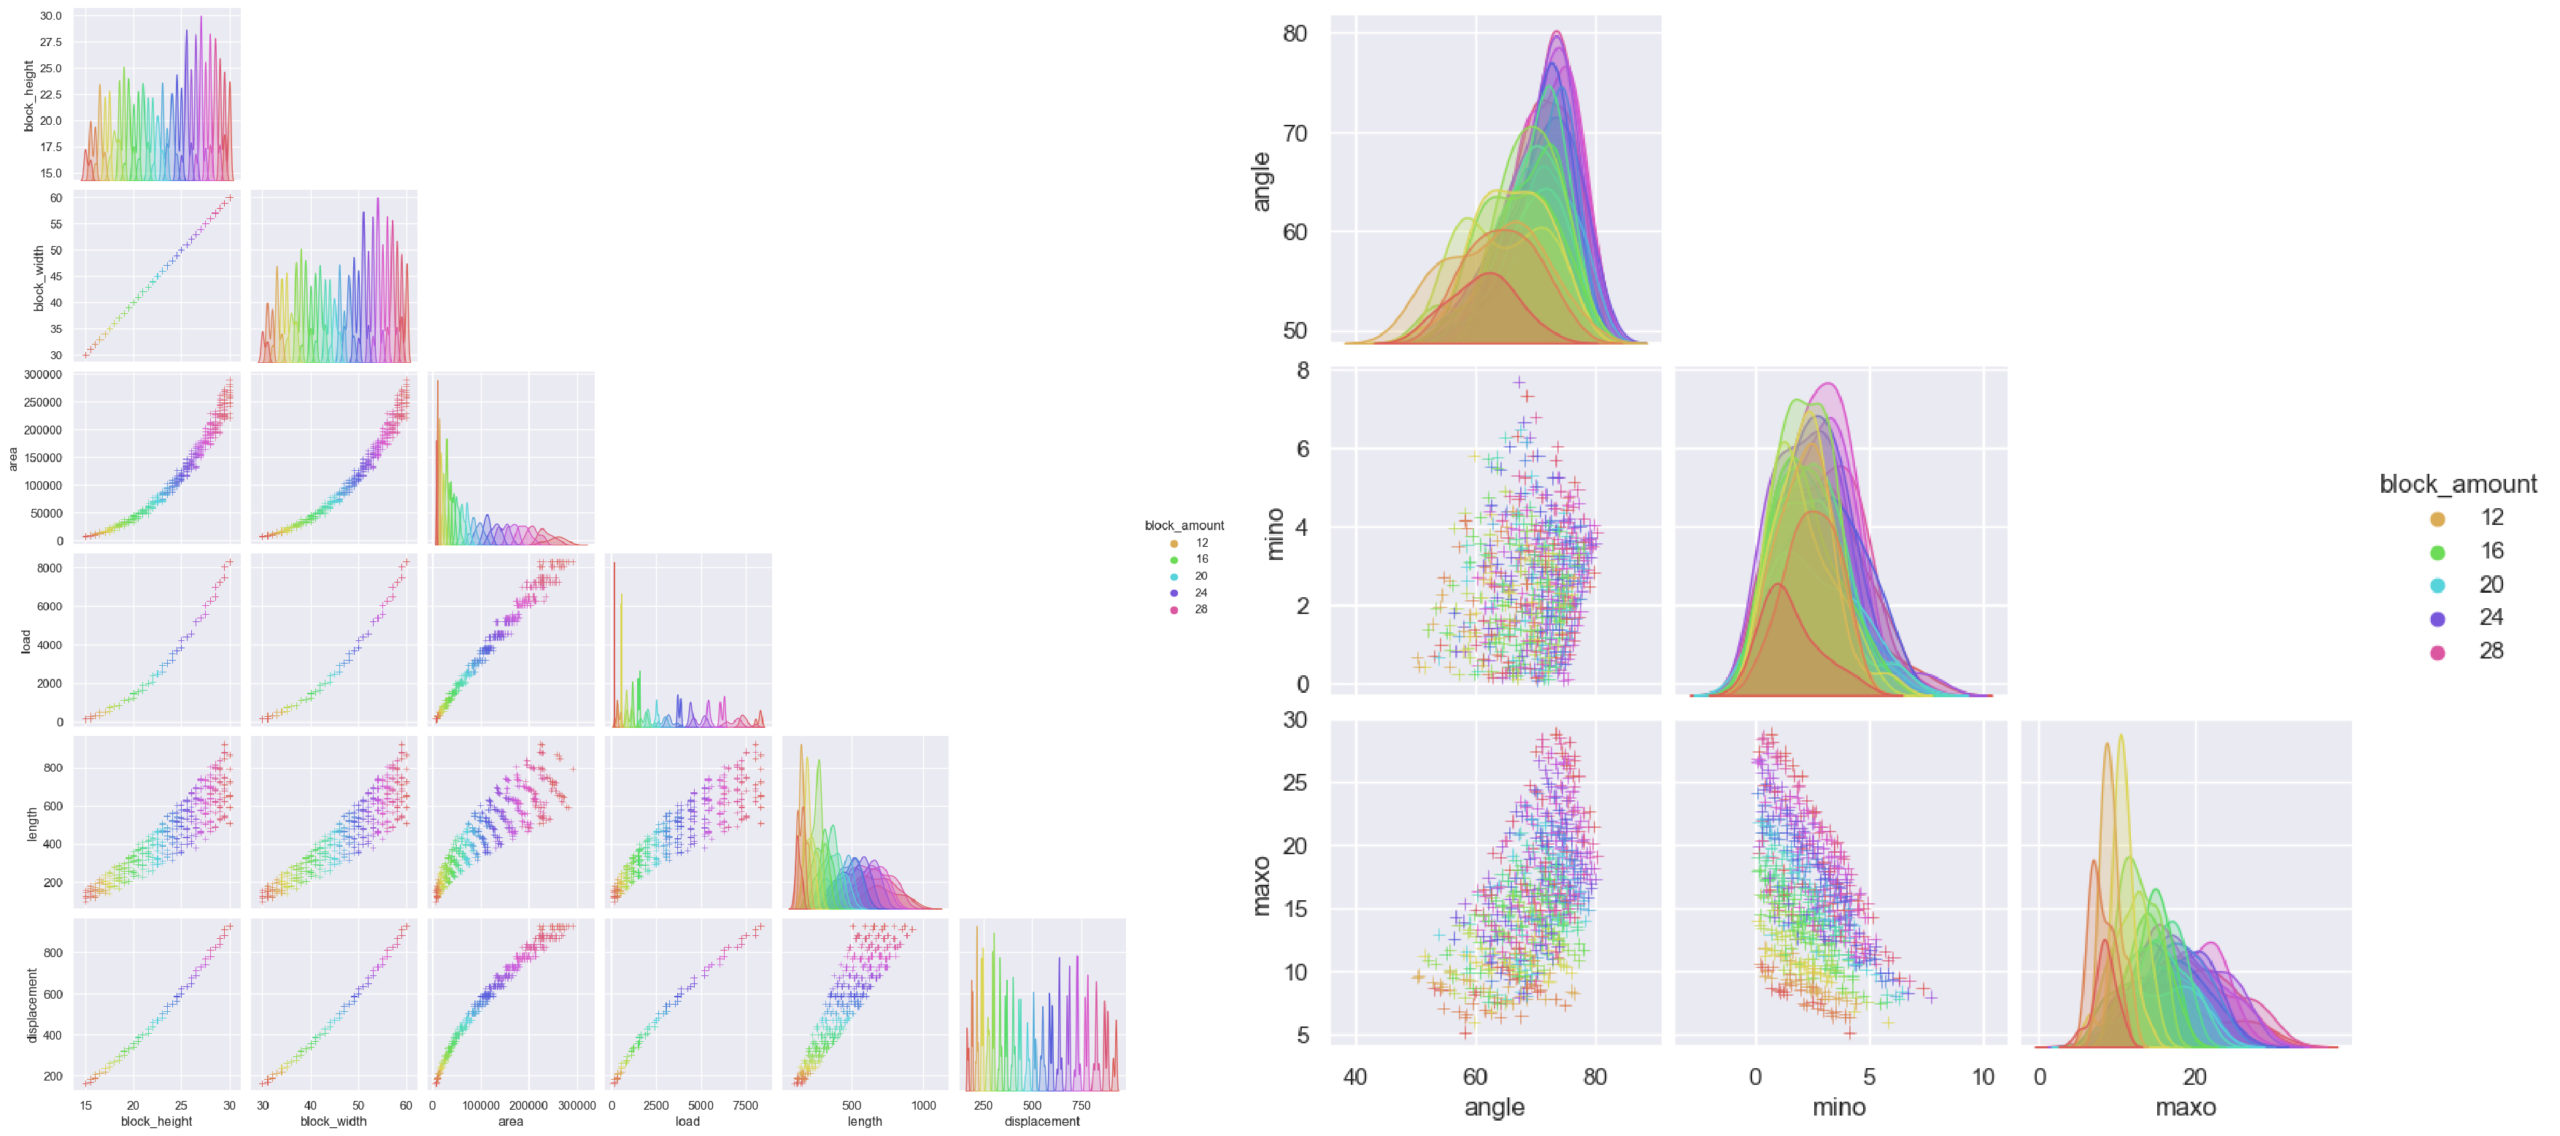
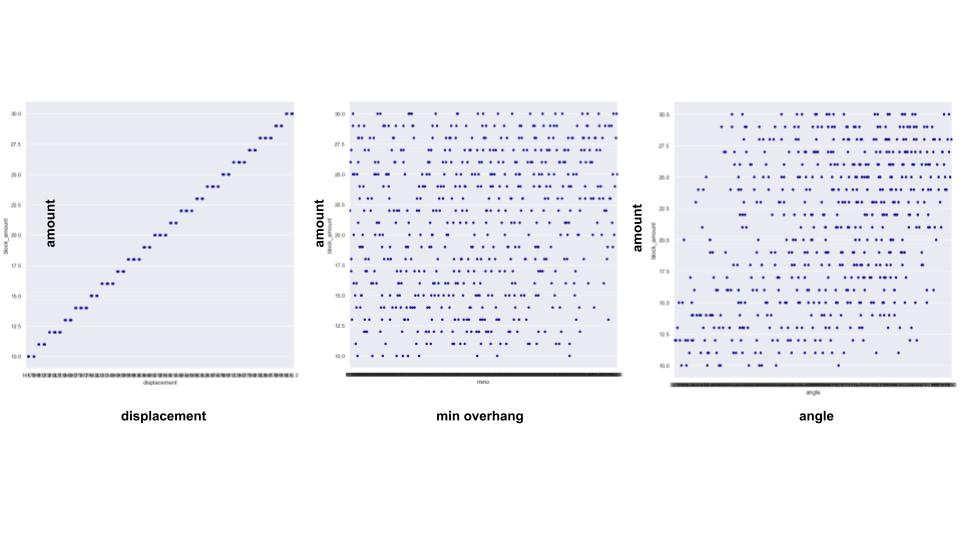
The linear correlations in the category of block amounts clearly shows the amount distribution is keeping the same form for all the features throughout the relation. The amount distribution shows scattered variations in relation to the angle, indicating no clear pattern or trend.
PCA Analysis
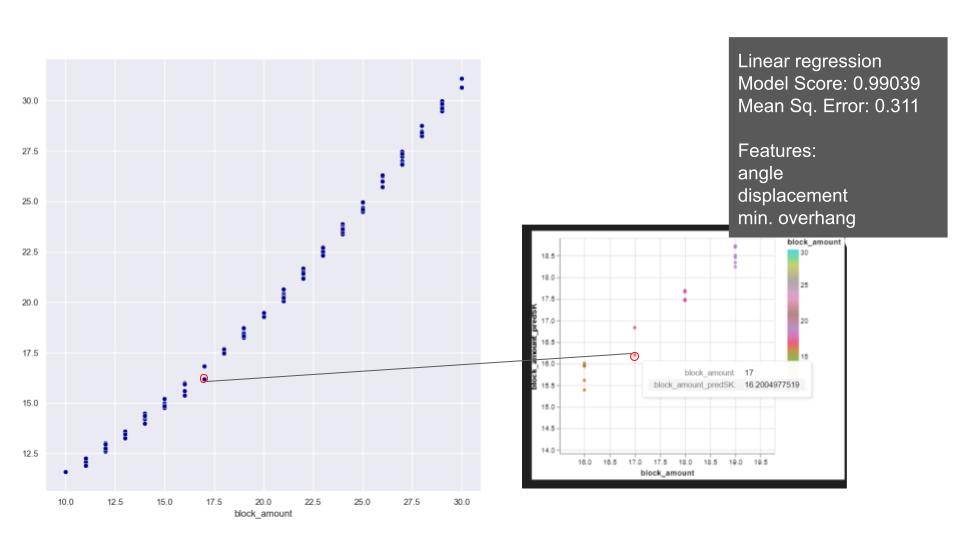
Later PCA analysis were conducted to examine the impact of features on predicting block amount. Notably, the first three features selected for this analysis, displacement, minimum overhang, and angle from curve parameters, differ from those utilized in the initial training.

This time, PCA features were used in shallow learning models we used before. With linear regression, even though it gives higher mean square error compared to first training, still the prediction does not exceed more than 1 block error. Polynomial regression model performed similar to first training keeping high prediction value on block amount, and XGBoost model was also successful to predict the block amount as in the first training.
Due to the utilization of a parametric model in creating our arches, the features exhibit relationships, and the models demonstrate a high degree of success in capturing even the presence of noisy correlations.
ANN Regression
Through ANN regression, our objective is to predict three features, with two of them related to the curve and the other feature representing the block amount.
The defined problem is if the user has a certain type of block and knows the opening of the arch they want to build, What shape of curve could be achieved with how many blocks.
We trained block height, block width, area, load and displacement to predict angle and length for the shape of the curve and required number of blocks for the desired curve shape.
To tackle this, compact Neural Network with 59 parameters was employes, leveraging a dataset of 585 stable arches for training and analysis.
The model was integrated back into Grasshopper to construct the arches, using the trained variables as manually given inputs. During the rebuilding process, we ensured that the inputs provided to the hops component were within the dataset’s domain. By utilizing the predicted variables, we successfully reconstructed the arches.
Looking ahead, for future work, we aim to apply stability simulation to the constructed arches to observe the entire problem solving..
