
Thermal Comfort Index Prediction // Definition
OBJECTIVE: predicting thermal comfort in air-conditioned residential buildings using machine learning algorithms.
What is indoor thermal comfort?
Thermal comfort is “That condition of mind that expresses satisfaction with the thermal environment” (ISO 7730) People may feel that their surroundings are warm, cold or simply comfortable depending on the thermal state of the surroundings, and, equally importantly, physiological and psychological factors.
Lack of comfort due to the last factors cannot be alleviated by cooling or heating a building, but addressing physiological factors can improve thermal sensation for better.
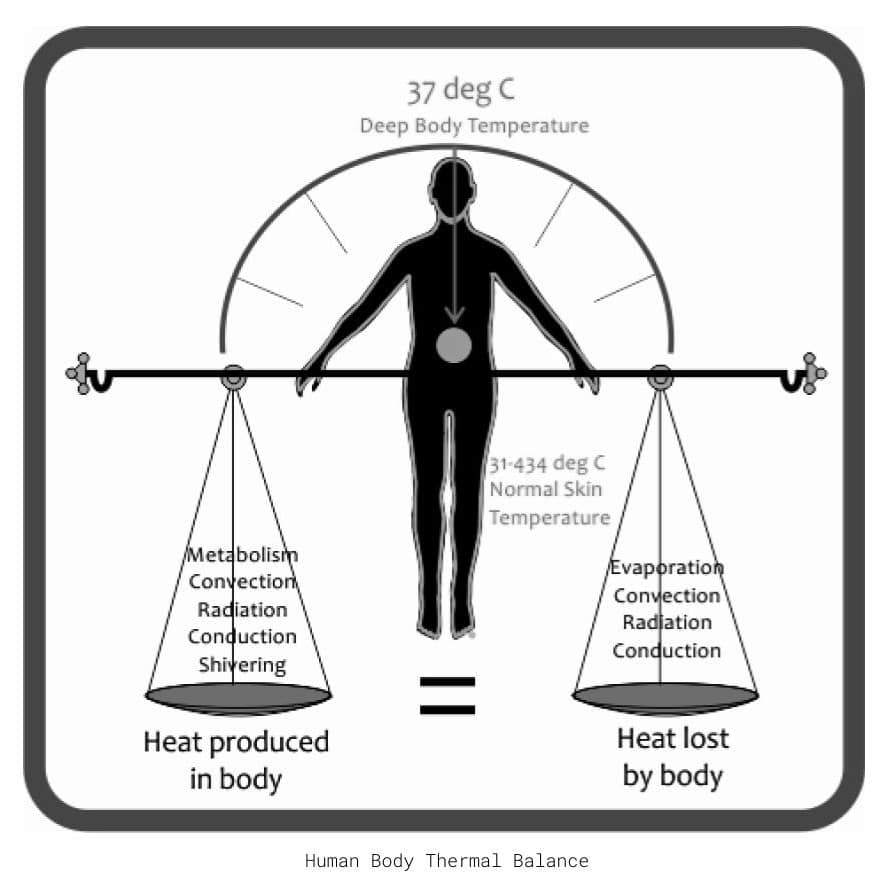
We have developed a methodology to predict thermal comfort using the Predicted Mean Vote (PMV) index, derived from a thermal balance equation that accounts for heat generation and exchanges between the human body and its environment.
We have developed a methodology to predict thermal comfort using the Predicted Mean Vote (PMV) index, derived from a thermal balance equation that accounts for heat generation and exchanges between the human body and its environment.
PMV INDEX : Predicted Mean Vote index
Definition: index that predicts the mean value of thermal sensation votes of a large group
of persons, expressed on a seven-point scale.
PMV index quantifies human perception of temperature on a scale from -3
(very cold) to +3 (very hot).
PMV close to 0 (neutral), meaning that most people will feel comfortable (95%).
Calculation Method developed by Fanger (1982) and adapted in ISO Standard 7730:
PMV = (0,303e-2,100*M + 0,028)*[(M–W)- H – Ec – Cres – Eres]
where:
M – the metabolic rate, in Watt per square meter (W/m2);
W – the effective mechanical power, in Watt per square meter (W/m2);
H – the sensitive heat losses;
Ec – the heat exchange by evaporation on the skin;
Cres – heat exchange by convection in breathing;
Eres – the evaporative heat exchange in breathing.
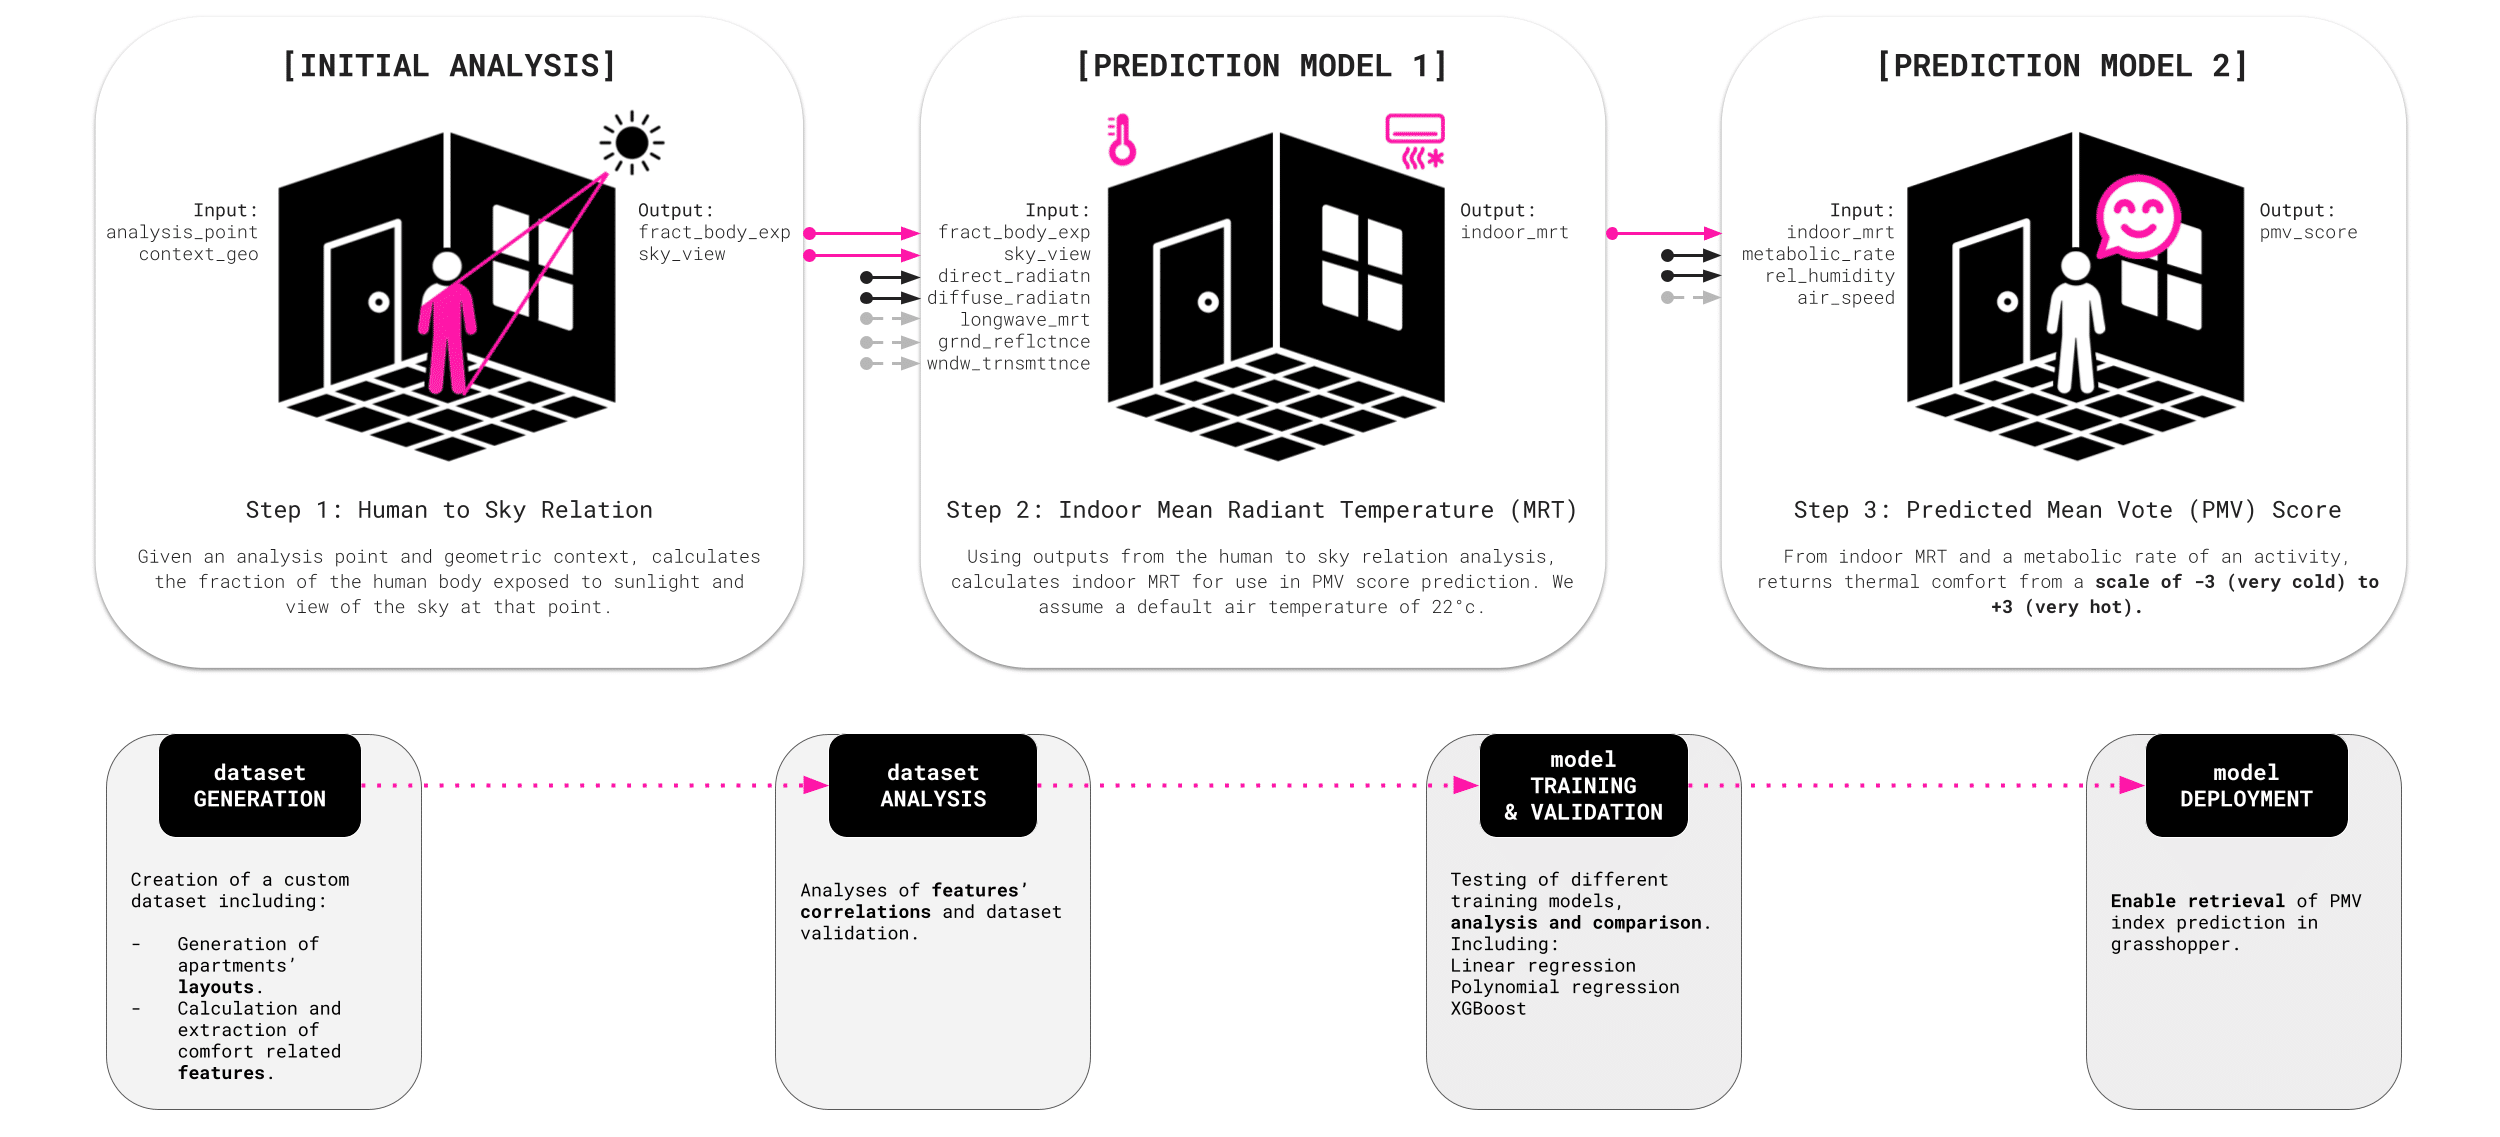
Thermal Comfort Index Prediction // Methodology
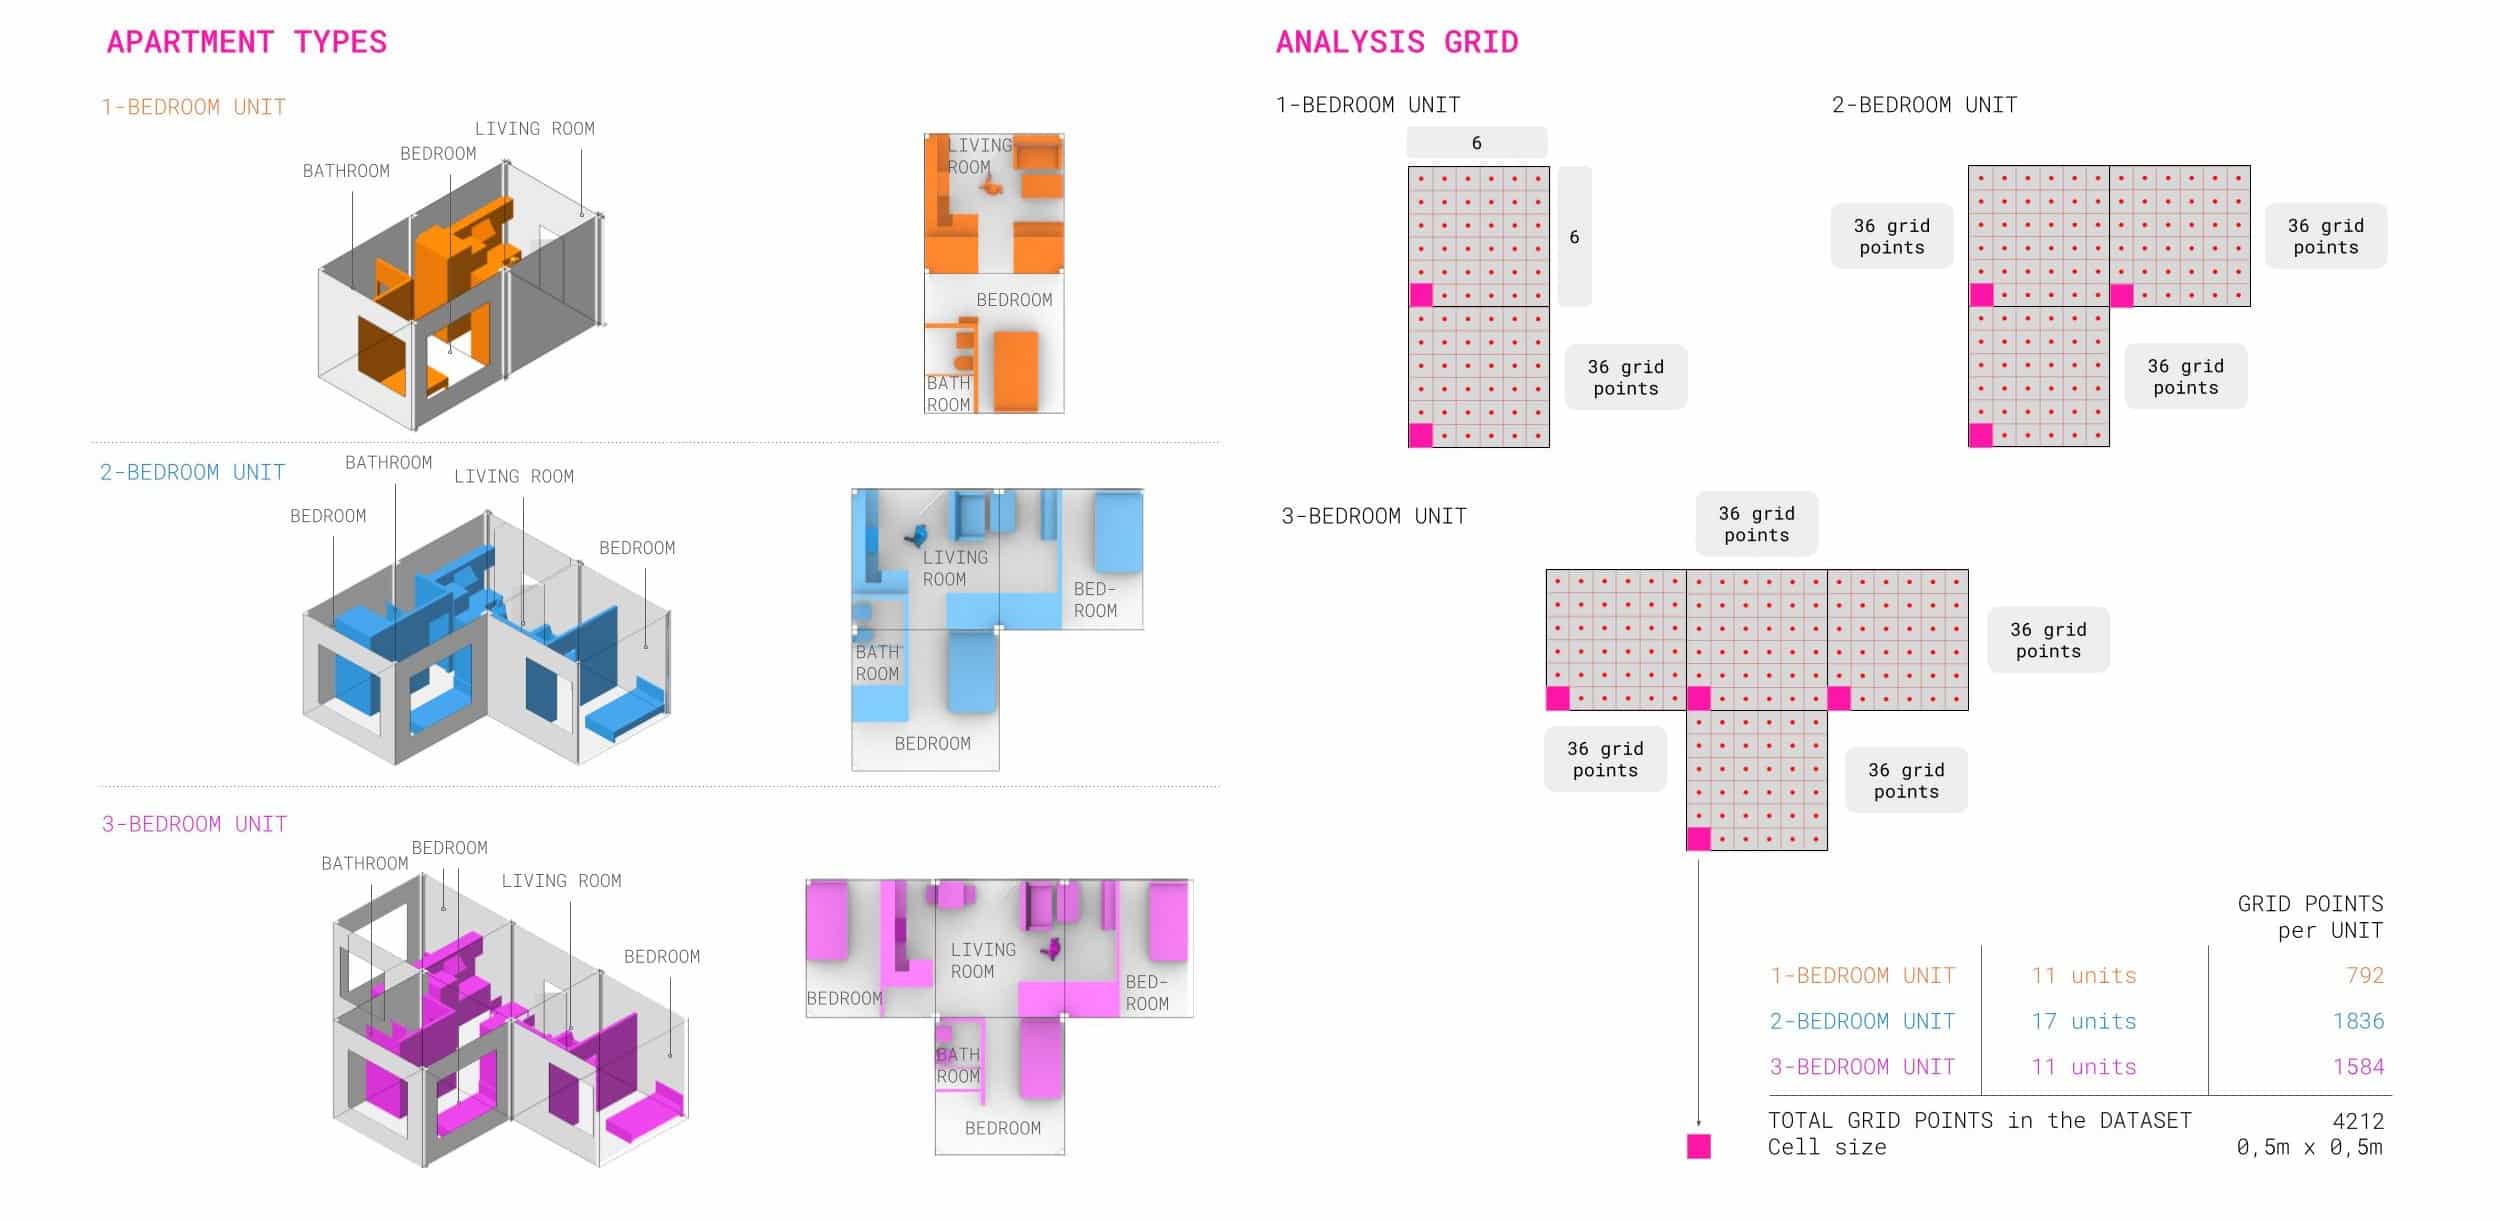
Dataset Generation // Analysis Geometry
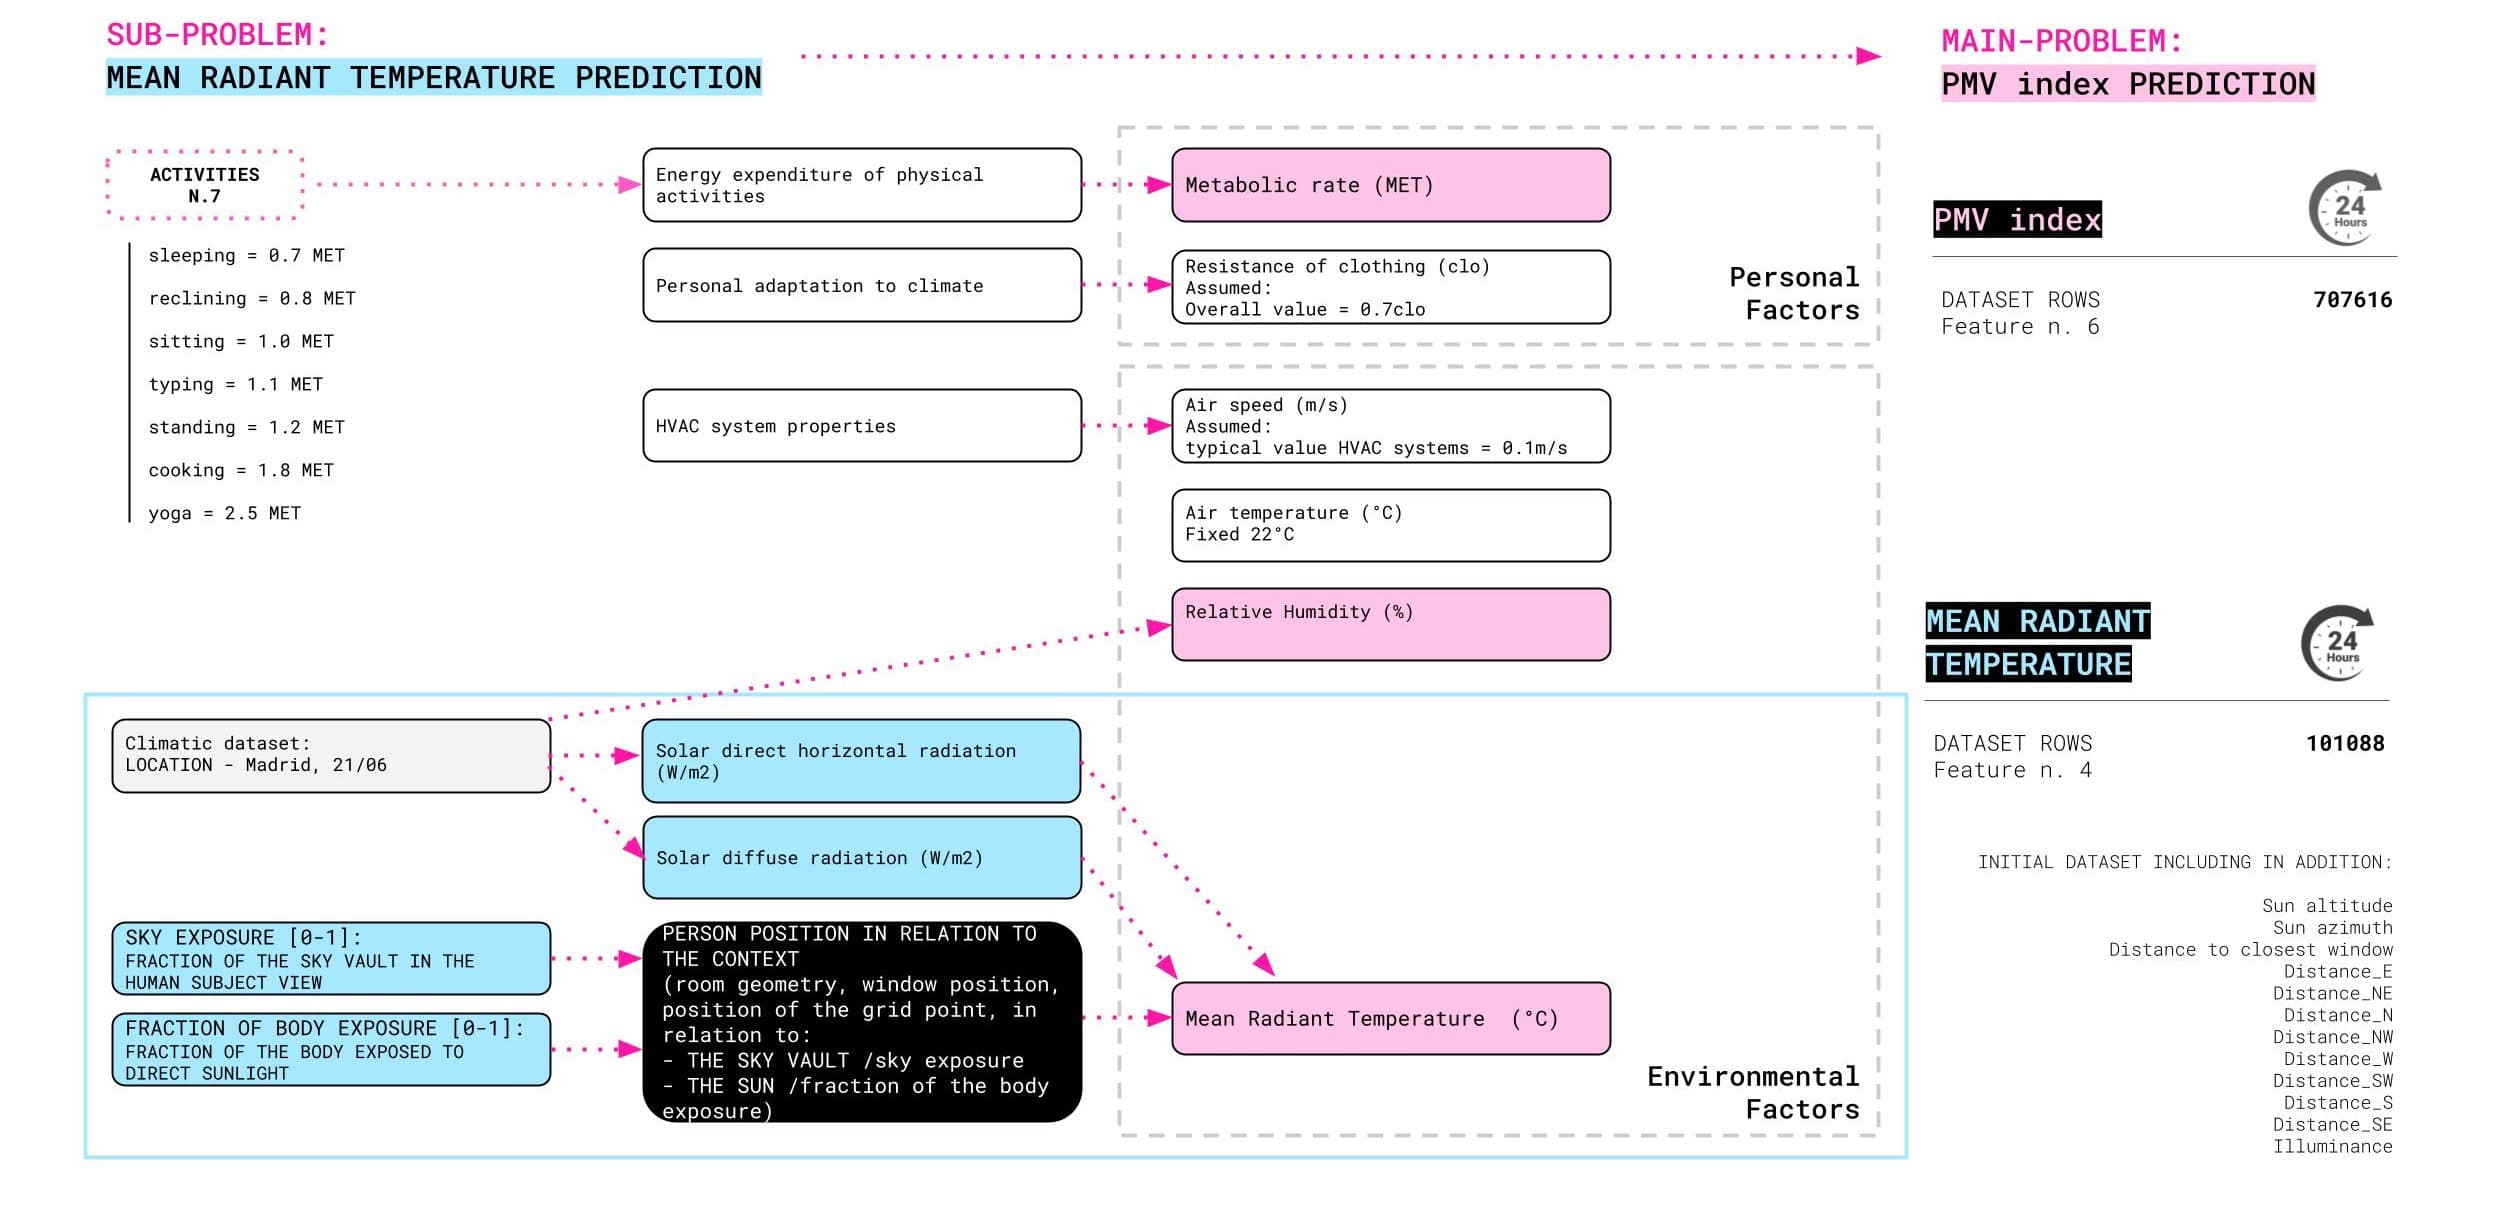
Dataset Generation // Features
MRT Model: Dataset Validation // Features
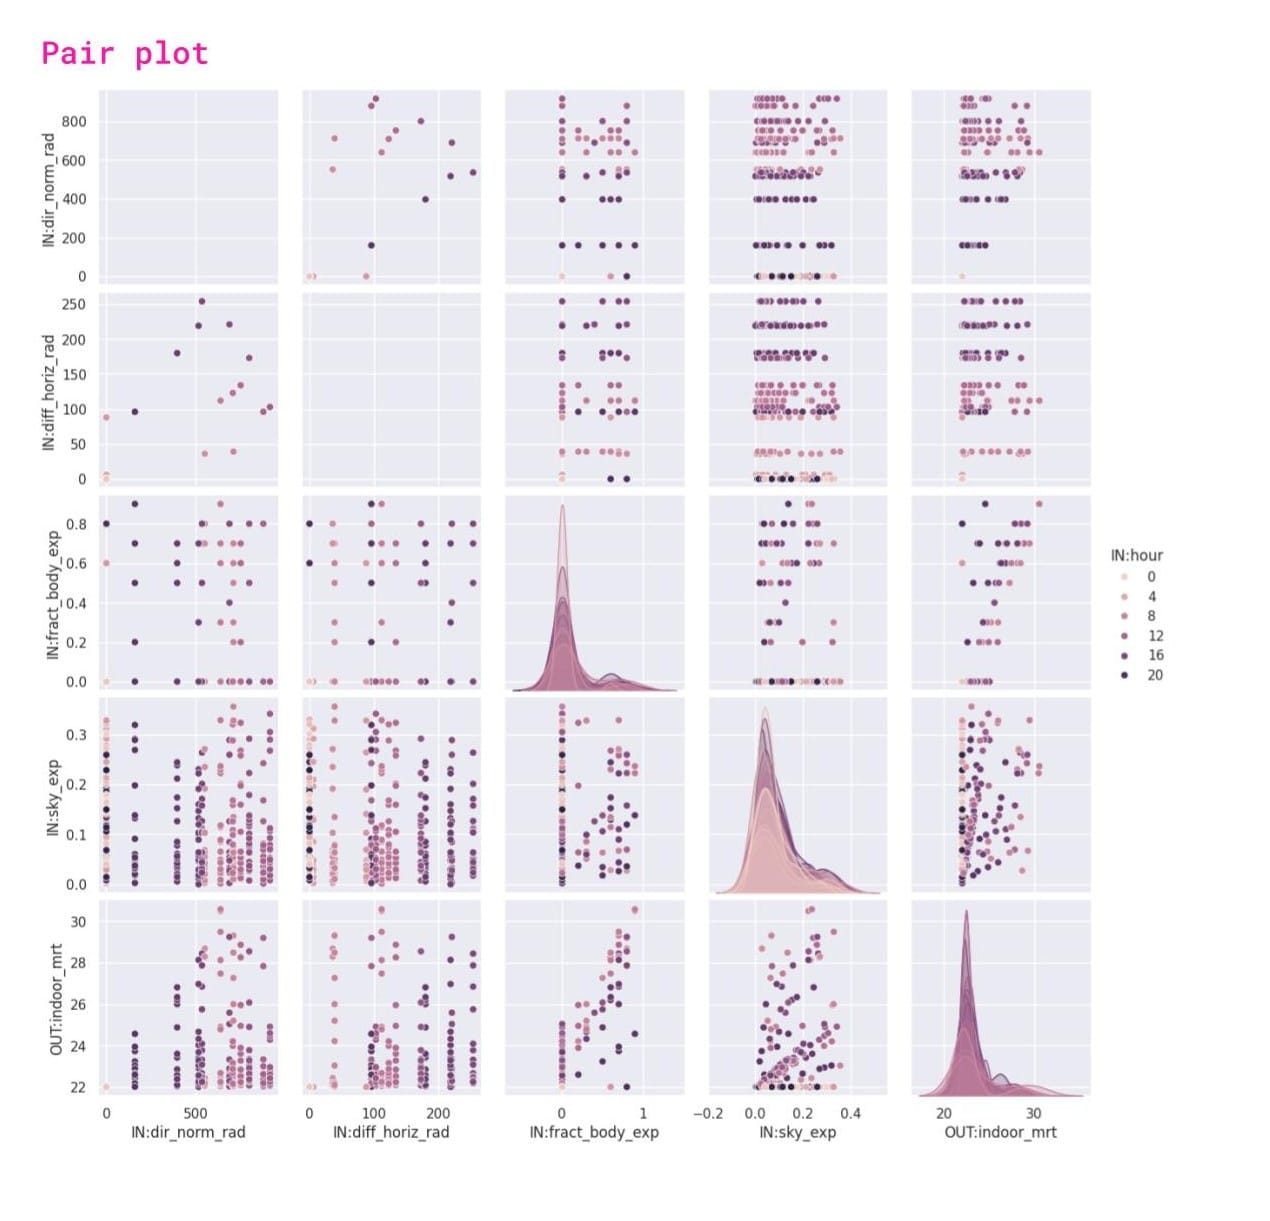
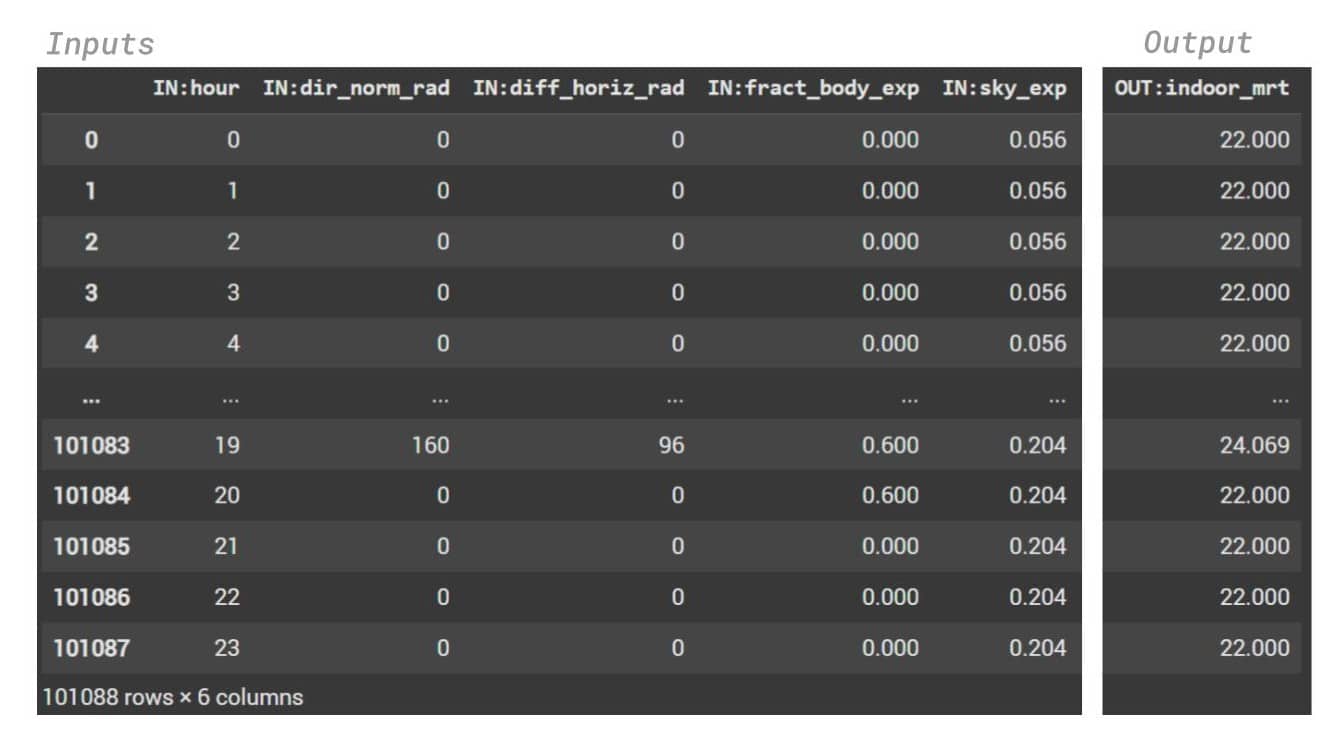
Prediction of Mean Radiant Temperature (indoor_mrt) based on 5 input values:
- Hour
- Direct Normal Radiation
- Diffuse Horizontal Radiation
- Fraction of Body Exposed to Sunlight
- Sky Exposure
Outputs:
- Color-coded points highlight that throughout the day Mean Radiant Temperature varies, in particular it increases reaching the highest values at around 12pm-4pm.
- There is a correlation between Indoor Mean Radiant Temperature and Direct Normal Radiation: an higher direct radiation tends to lead to higher MRT values.
- A greater sky exposure results in higher Indoor Mean Radiant Temperature.
- An higher value in Fraction of Body Exposed results in an higher Indoor Mean Radiant Temperature, in particular between 8am and 4pm.
MRT Model: Dataset Validation // Features
Prediction of Mean Radiant Temperature (indoor_mrt) based on 5 input values:
- Hour
- Direct Normal Radiation
- Diffuse Horizontal Radiation
- Fraction of Body Exposed to Sunlight
- Sky Exposure
Correlation Matrix
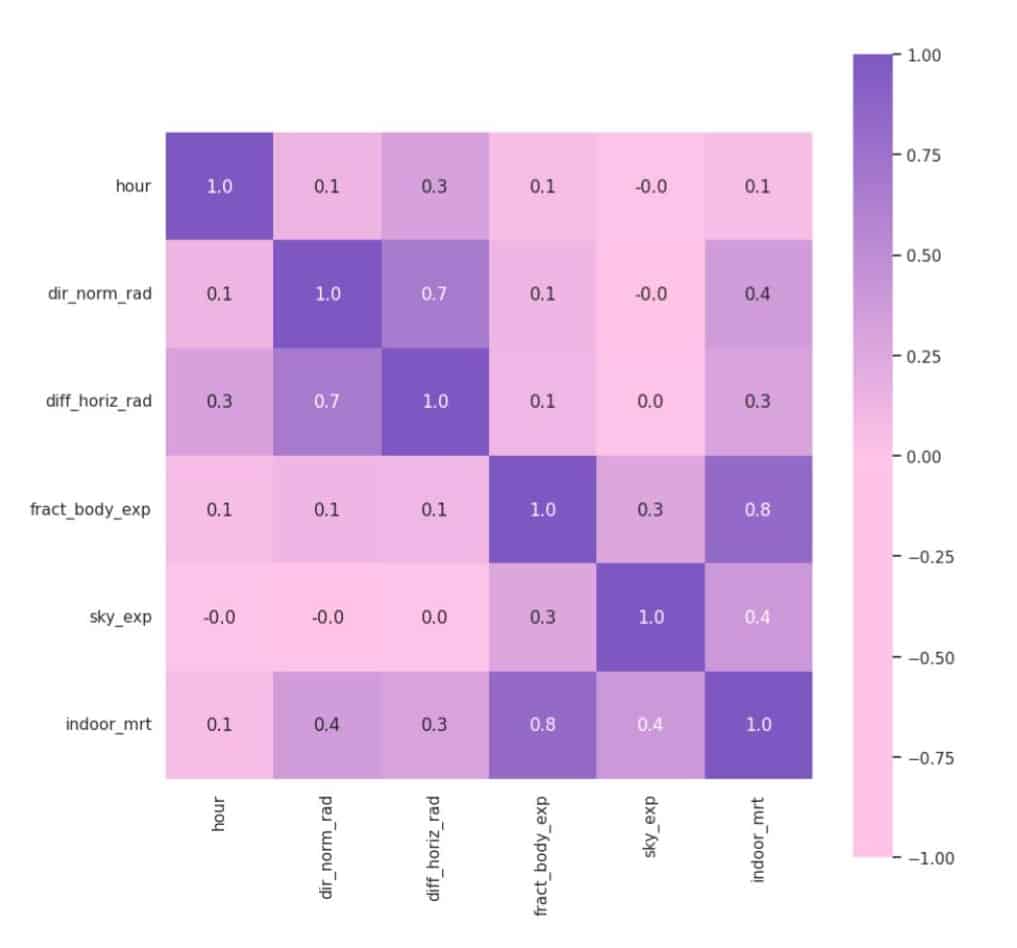
The heatmap highlights a strong correlation between MRT and the fraction of body exposure, reinforcing the impact of human positioning within a well-lit area.
Correlation Matrix
The heatmap highlights a strong correlation between MRT and the fraction of body exposure, reinforcing the impact of human positioning within a well-lit area.
It shows a weaker correlation of MRT with Sky Exposure: greater sky exposure leads to higher MRT.
The correlation matrix also shows that, as expected, direct normal radiation and diffuse horizontal radiation increase together. The both are positively related to MRT, which increases when they increase.
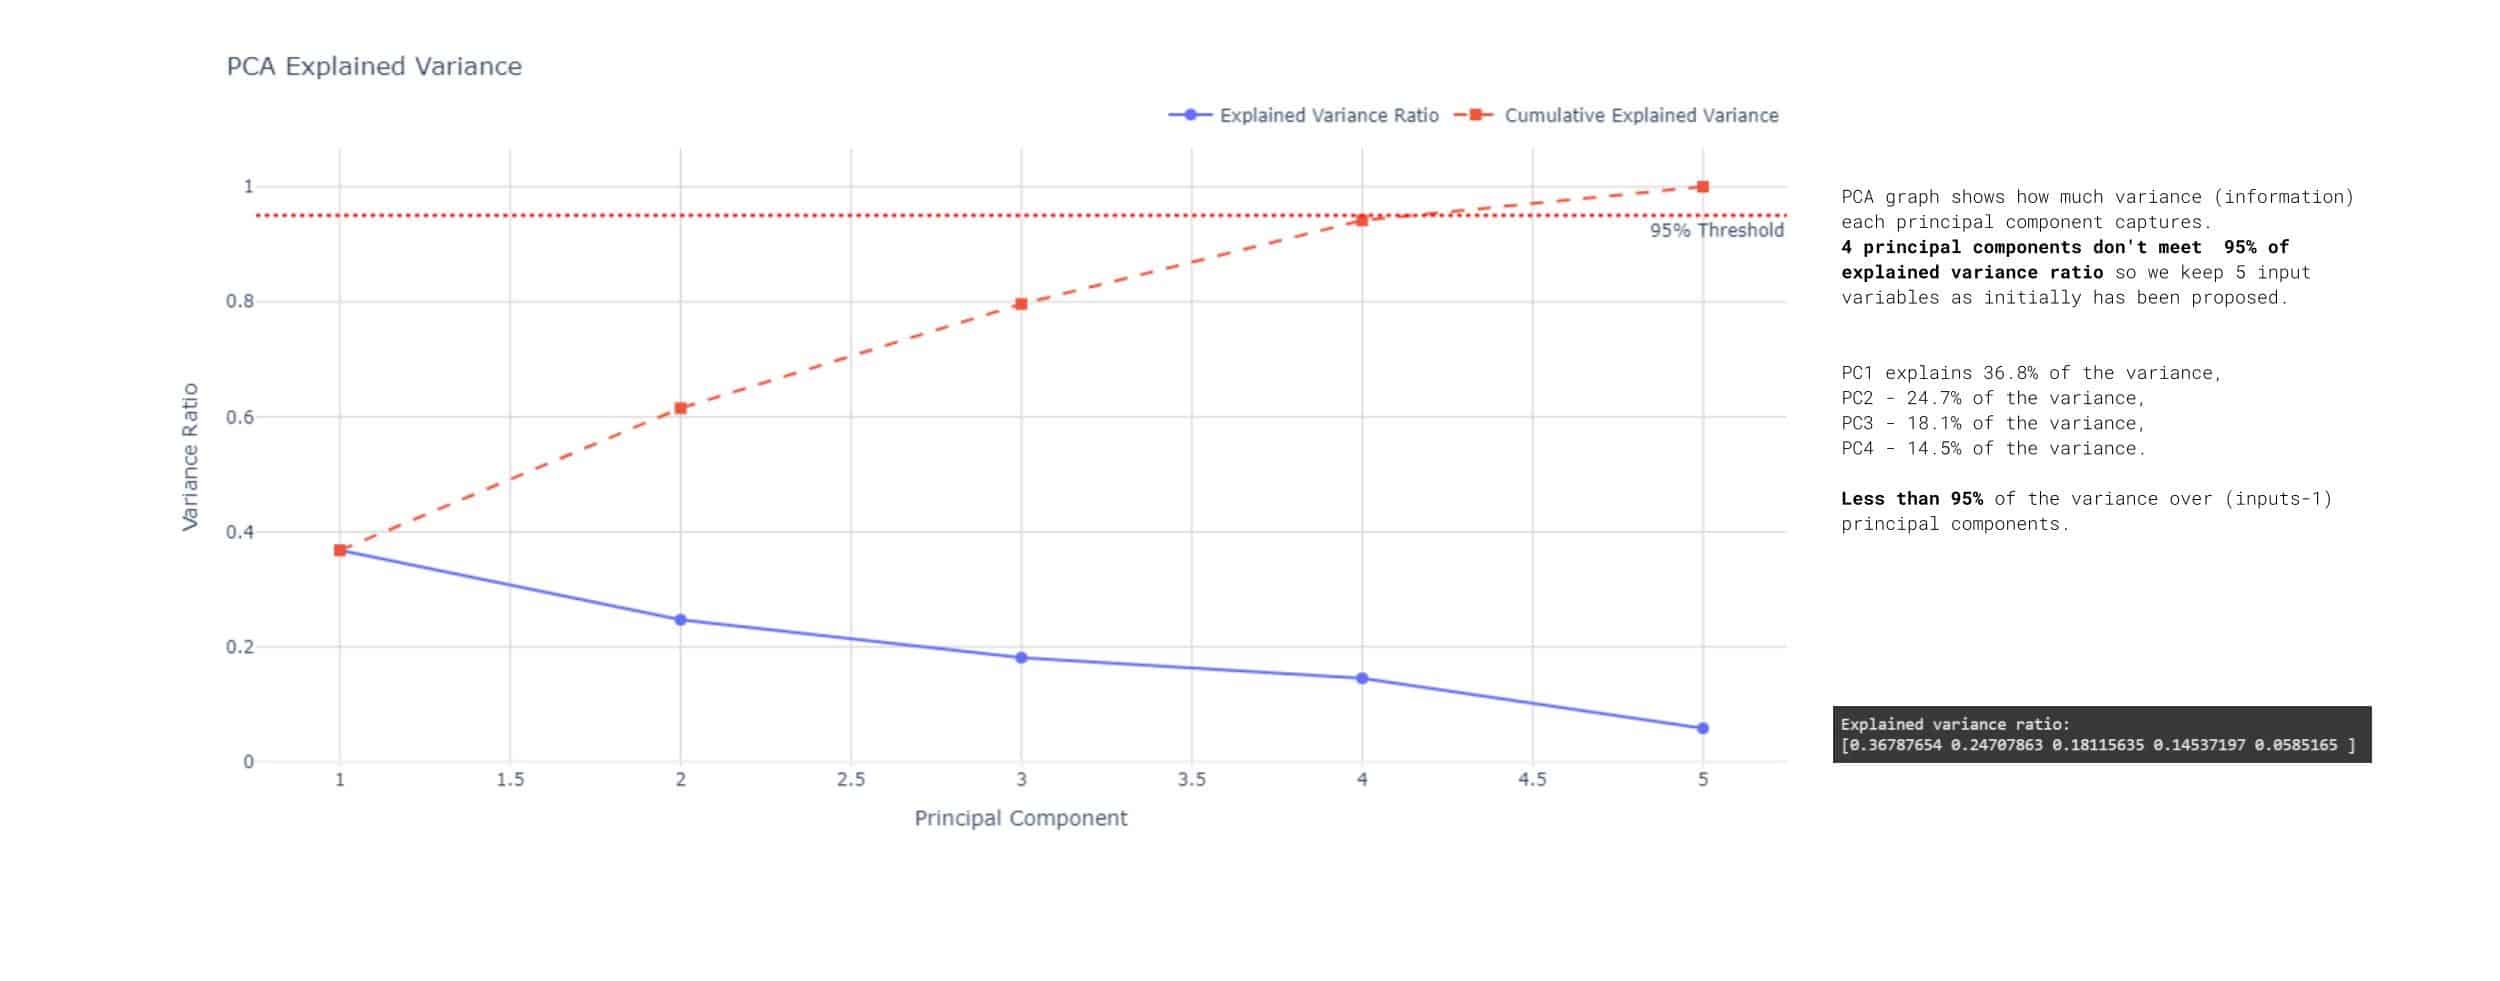
MRT Model: Training // PCA
MRT Model: Training // Shallow Learning
MRT Model: Training // Deep Learning
MRT Model: Training // MODEL COMPARISON
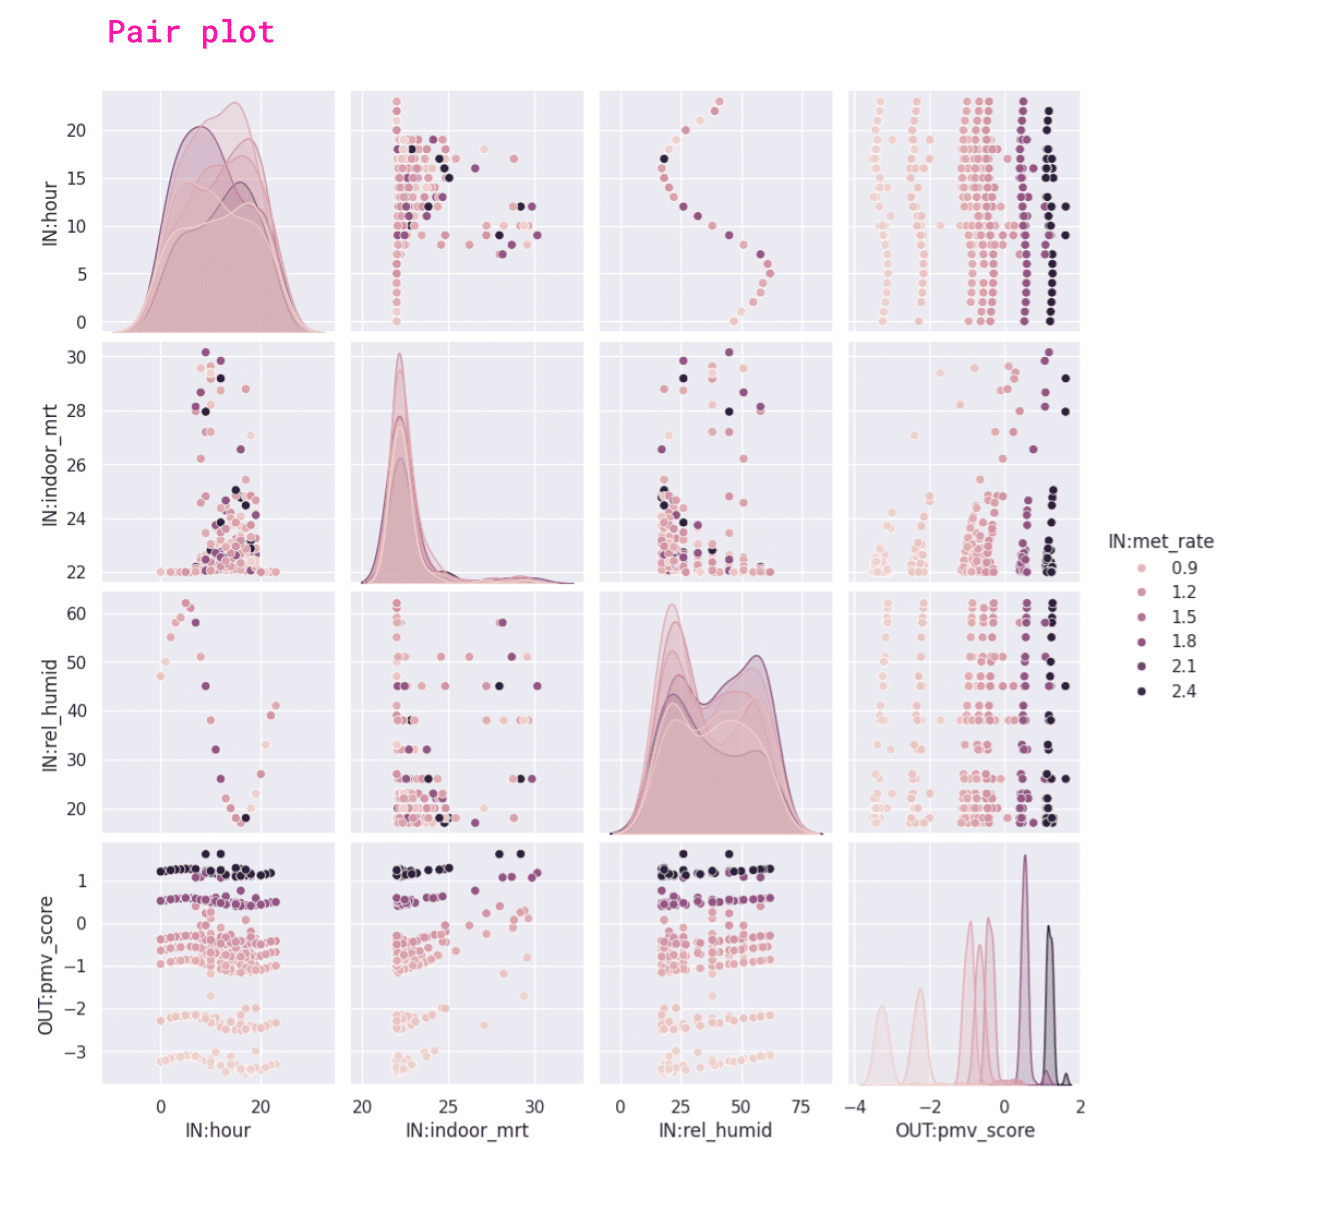
PMV Model: Dataset Validation // Features
Prediction of Predicted Mean Vote score (pmv_score) based on 4 input values:
- Hour
- Metabolic Rate
- Indoor Mean Radiant Temperature (predicted before)
- Relative Humidity
Outputs:
- A higher metabolic rate results in higher PMV values:
higher metabolic activities—like exercising or performing physically demanding tasks—generate more body heat, lead to a warmer thermal sensation represented through a higher PMV index.
- A higher indoor Mean Radiant Temperature, which accounts for heat radiating from surrounding surfaces such as walls, floors, and ceilings, tends to result in higher PMV values indicating a warmer perceived environment.
PMV Model: Dataset Validation // Features
Prediction of Predicted Mean Vote score (pmv_score) based on 4 input values:
- Hour,
- Metabolic Rate,
- Indoor Mean Radiant Temperature (predicted before),
- Relative Humidity
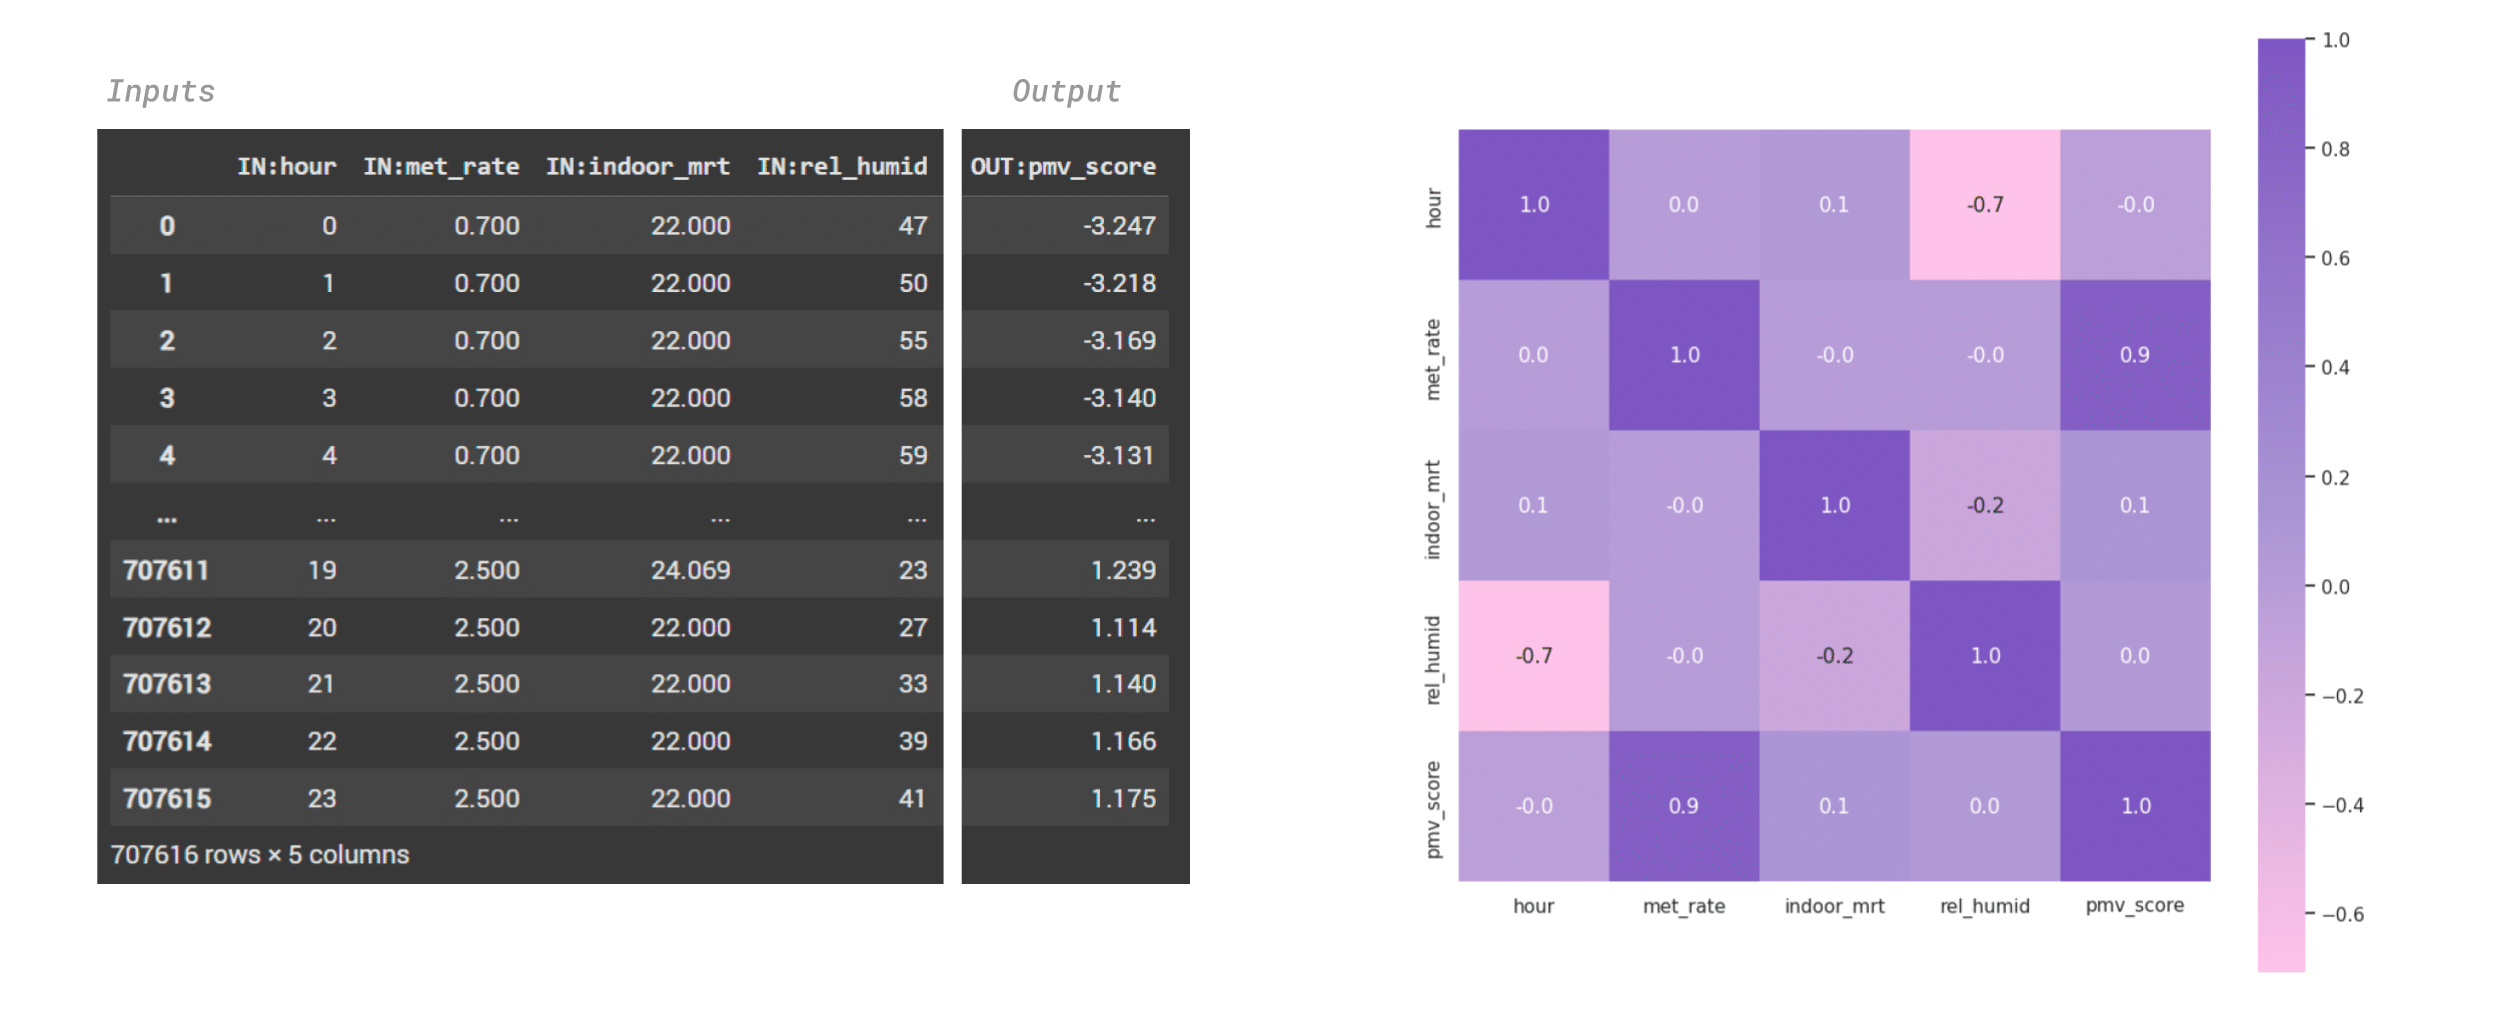
Correlation Matrix
The heatmap shows no perfect linear relationships between features.
Hour and relative humidity have possible negative correlation:.
The output value PMV score has a strong correlation with metabolic rate:
It confirms what shown in the pair plots, higher metabolic activities—like exercising or performing physically demanding tasks—generate more body heat, lead to a higher PMV score and a warmer thermal sensation.
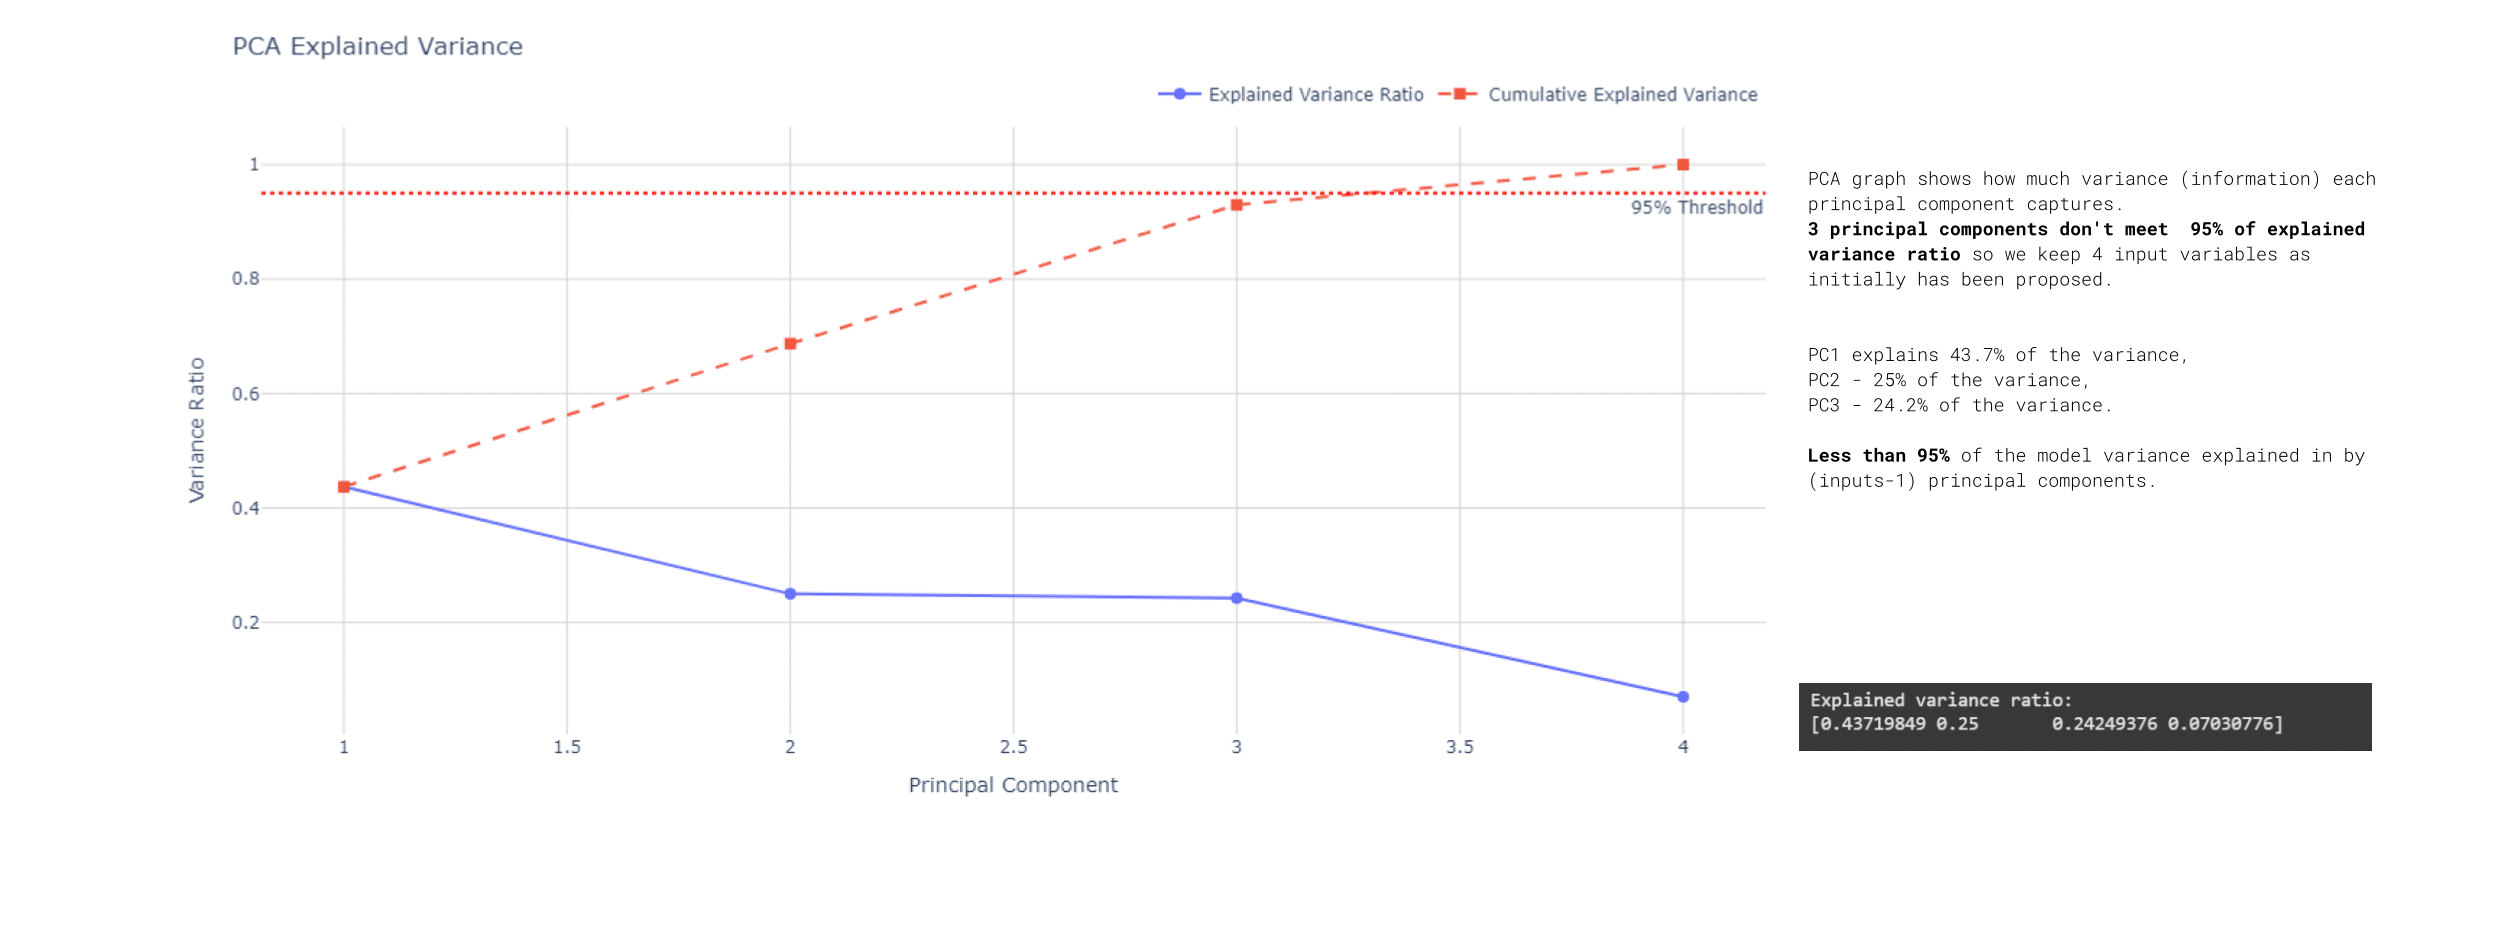
PMV Model: Training // PCA
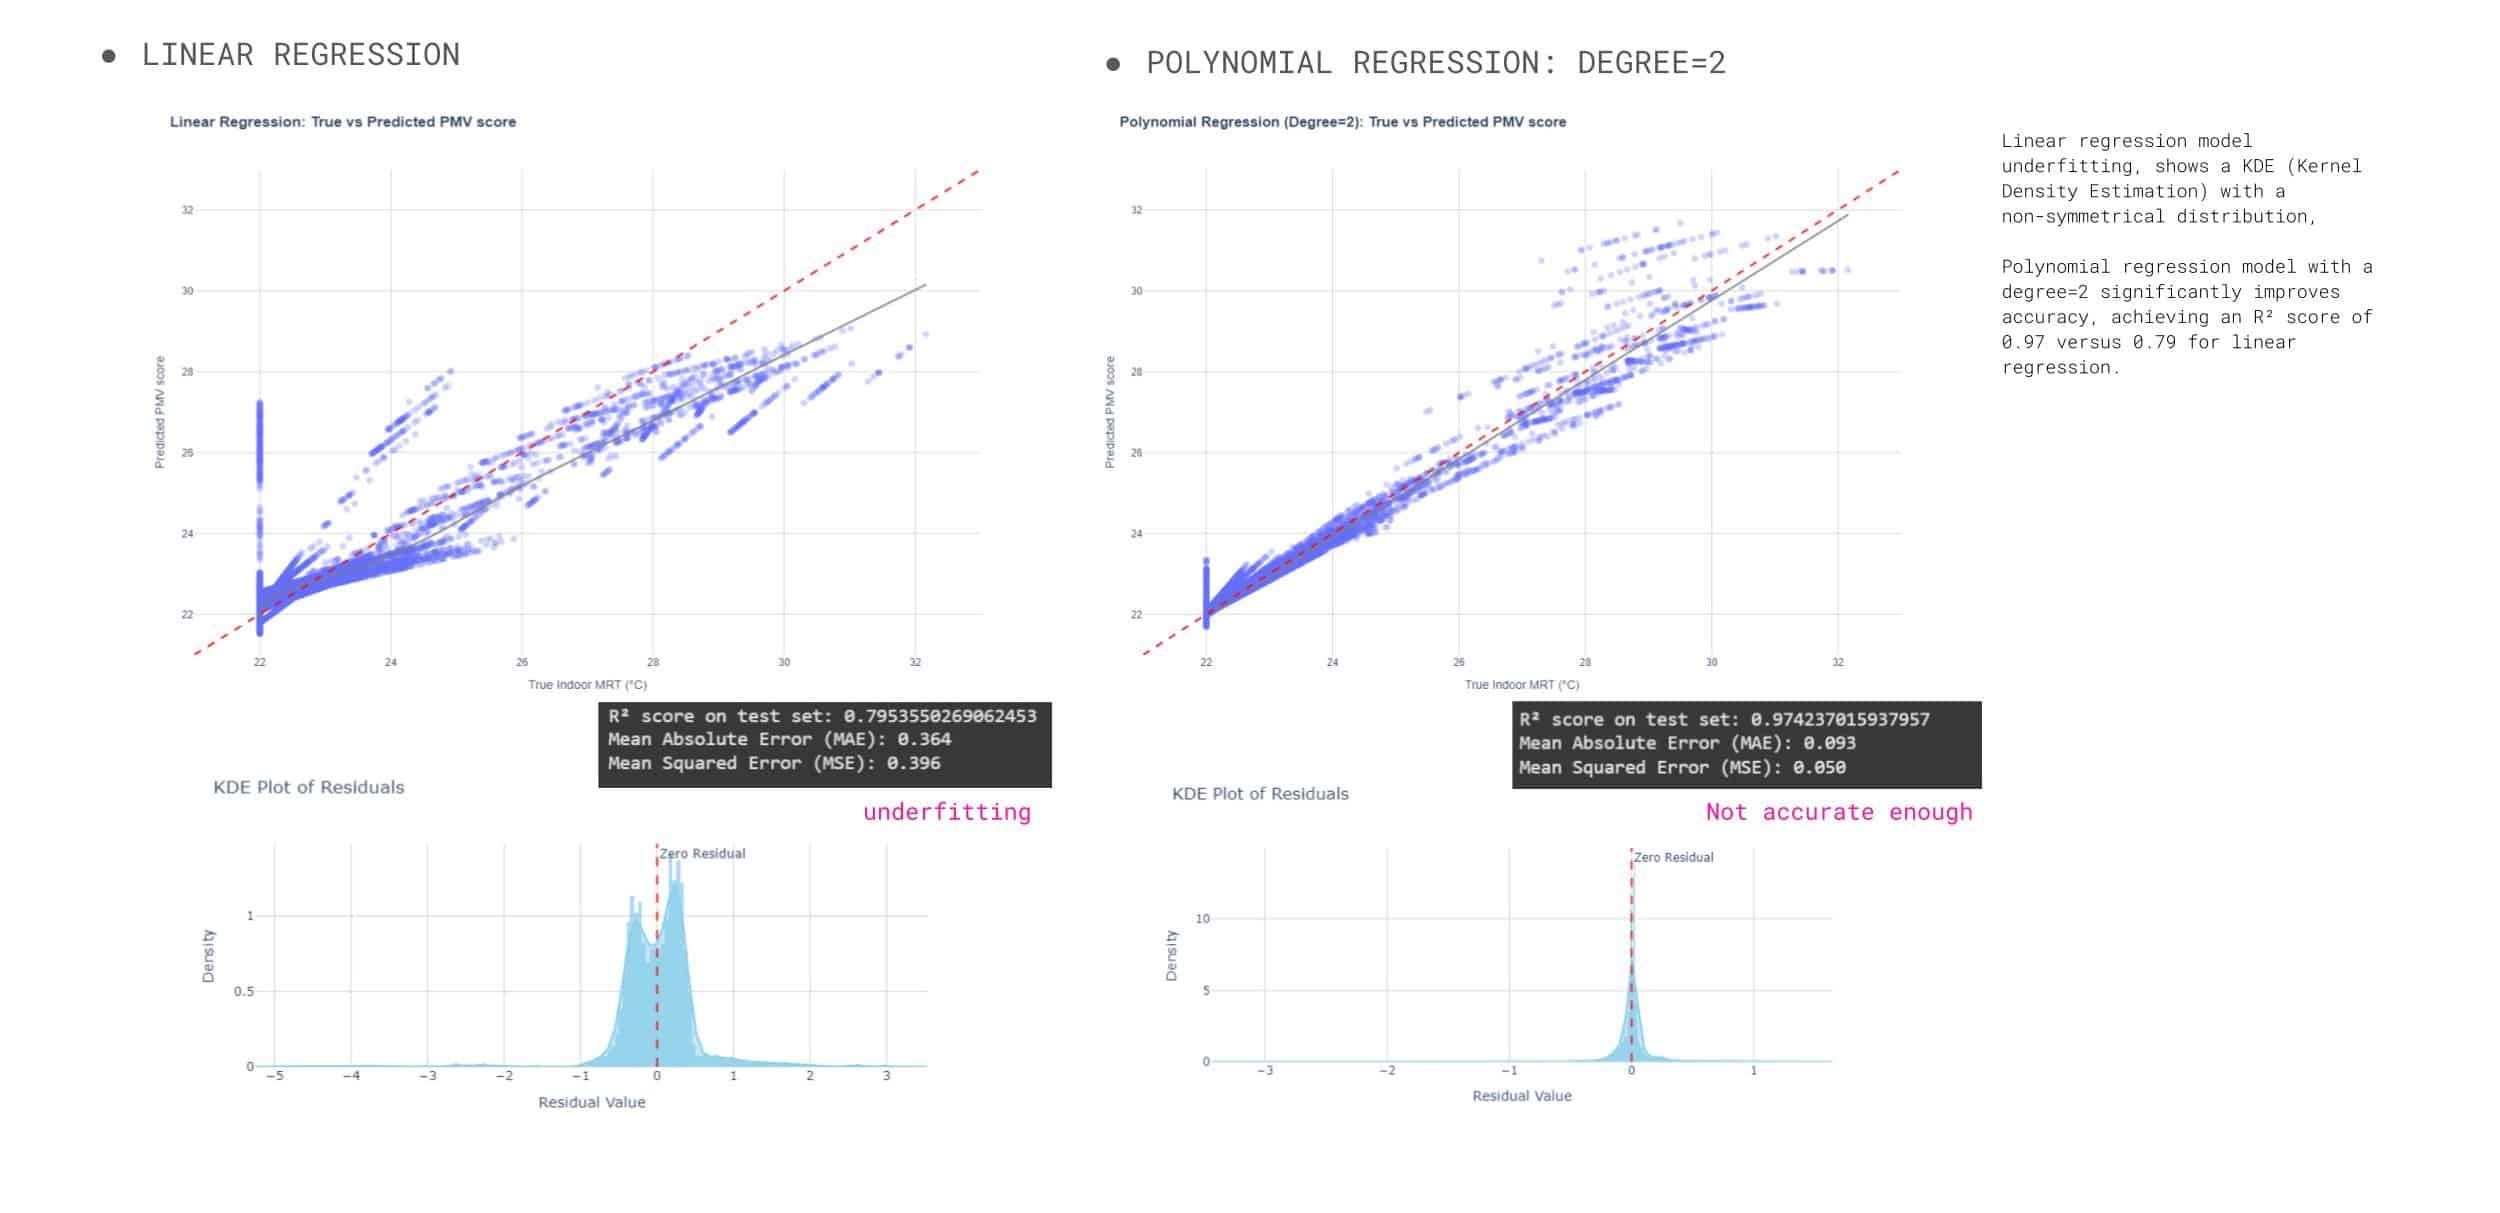
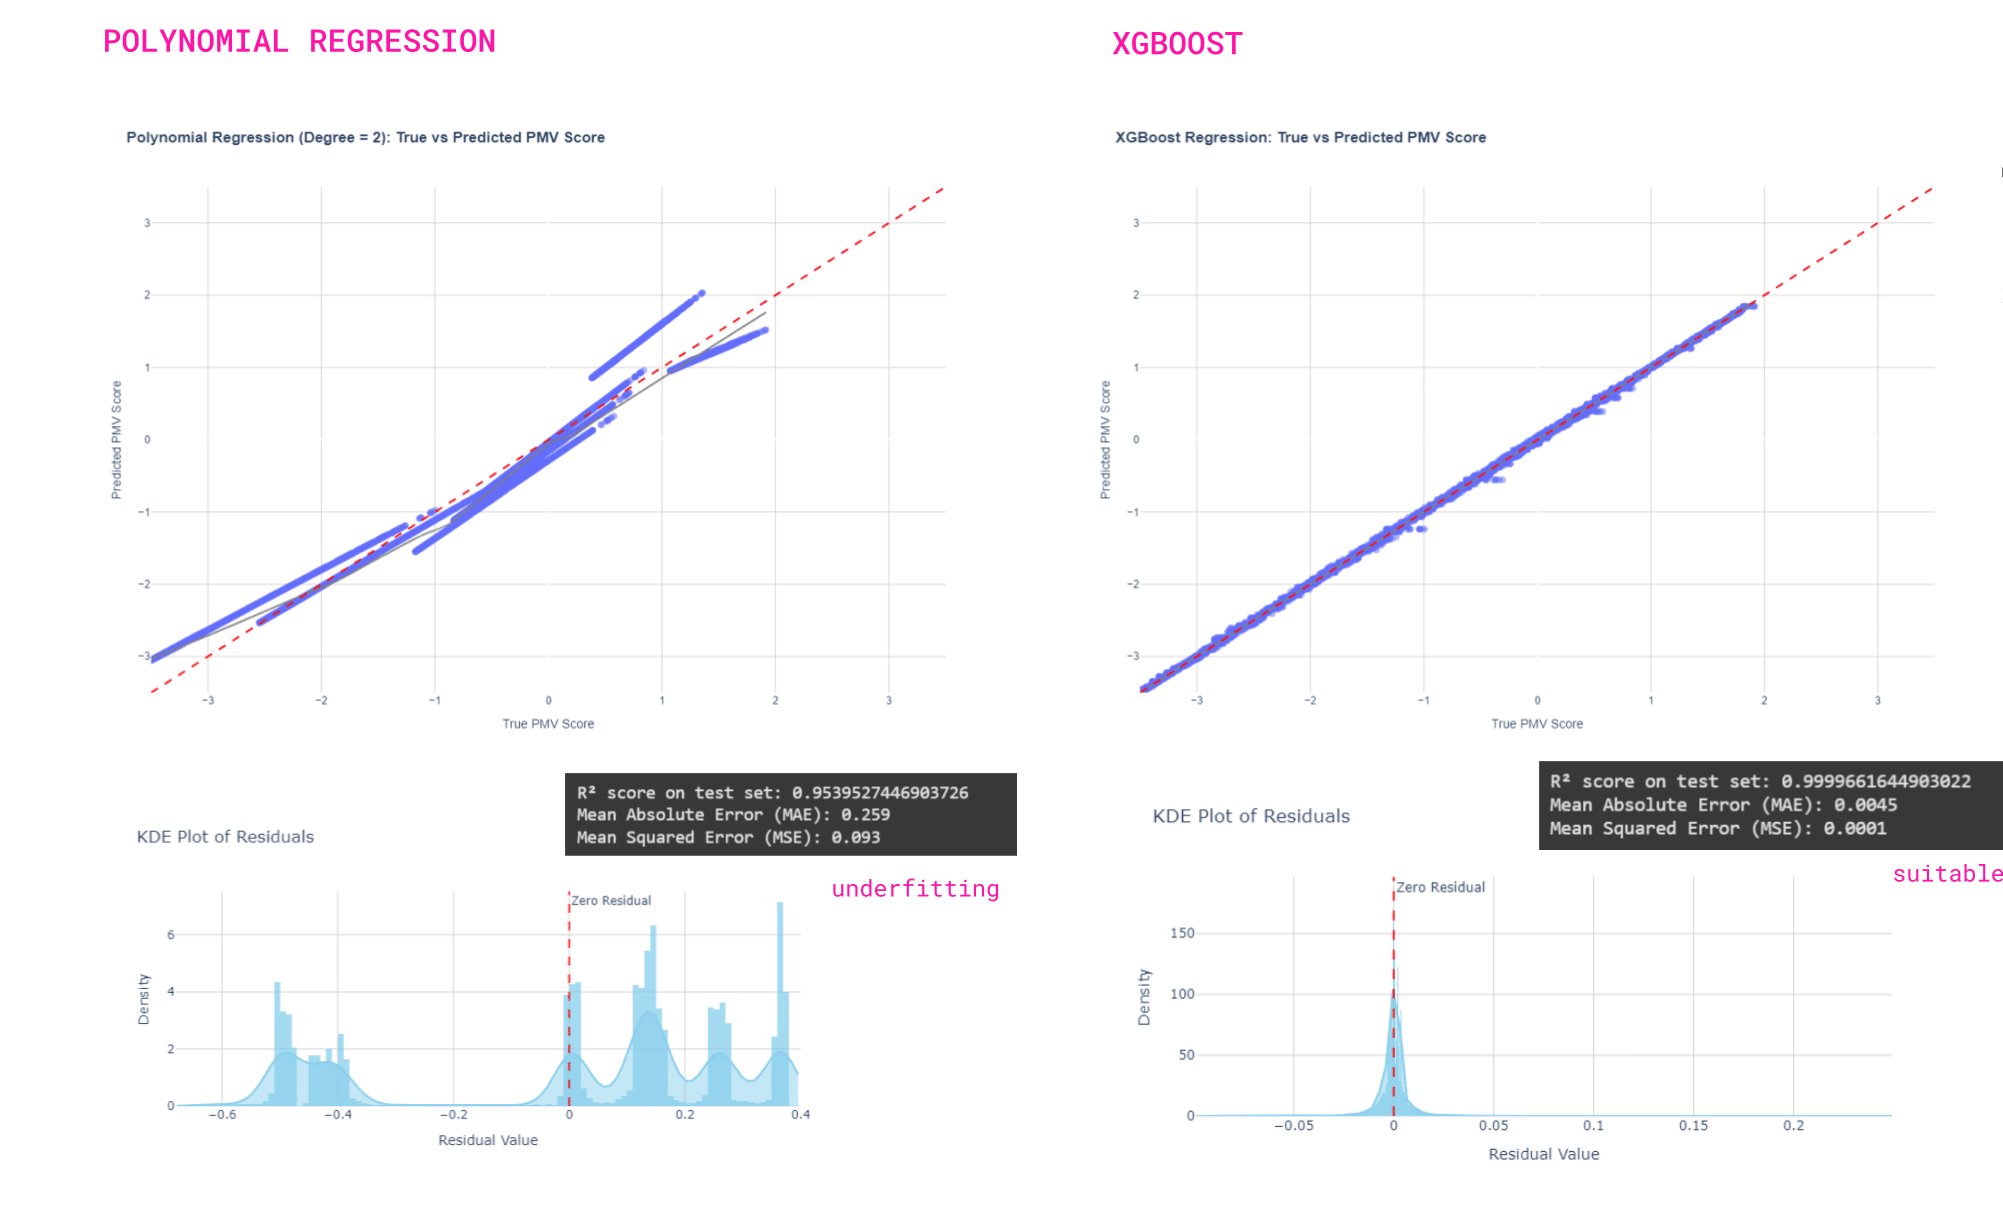
PMV Model: Training // Shallow Learning
KDE shows asymmetric residuals with multiple peaks for polynomial regression model, indicating poor performance across the prediction range.
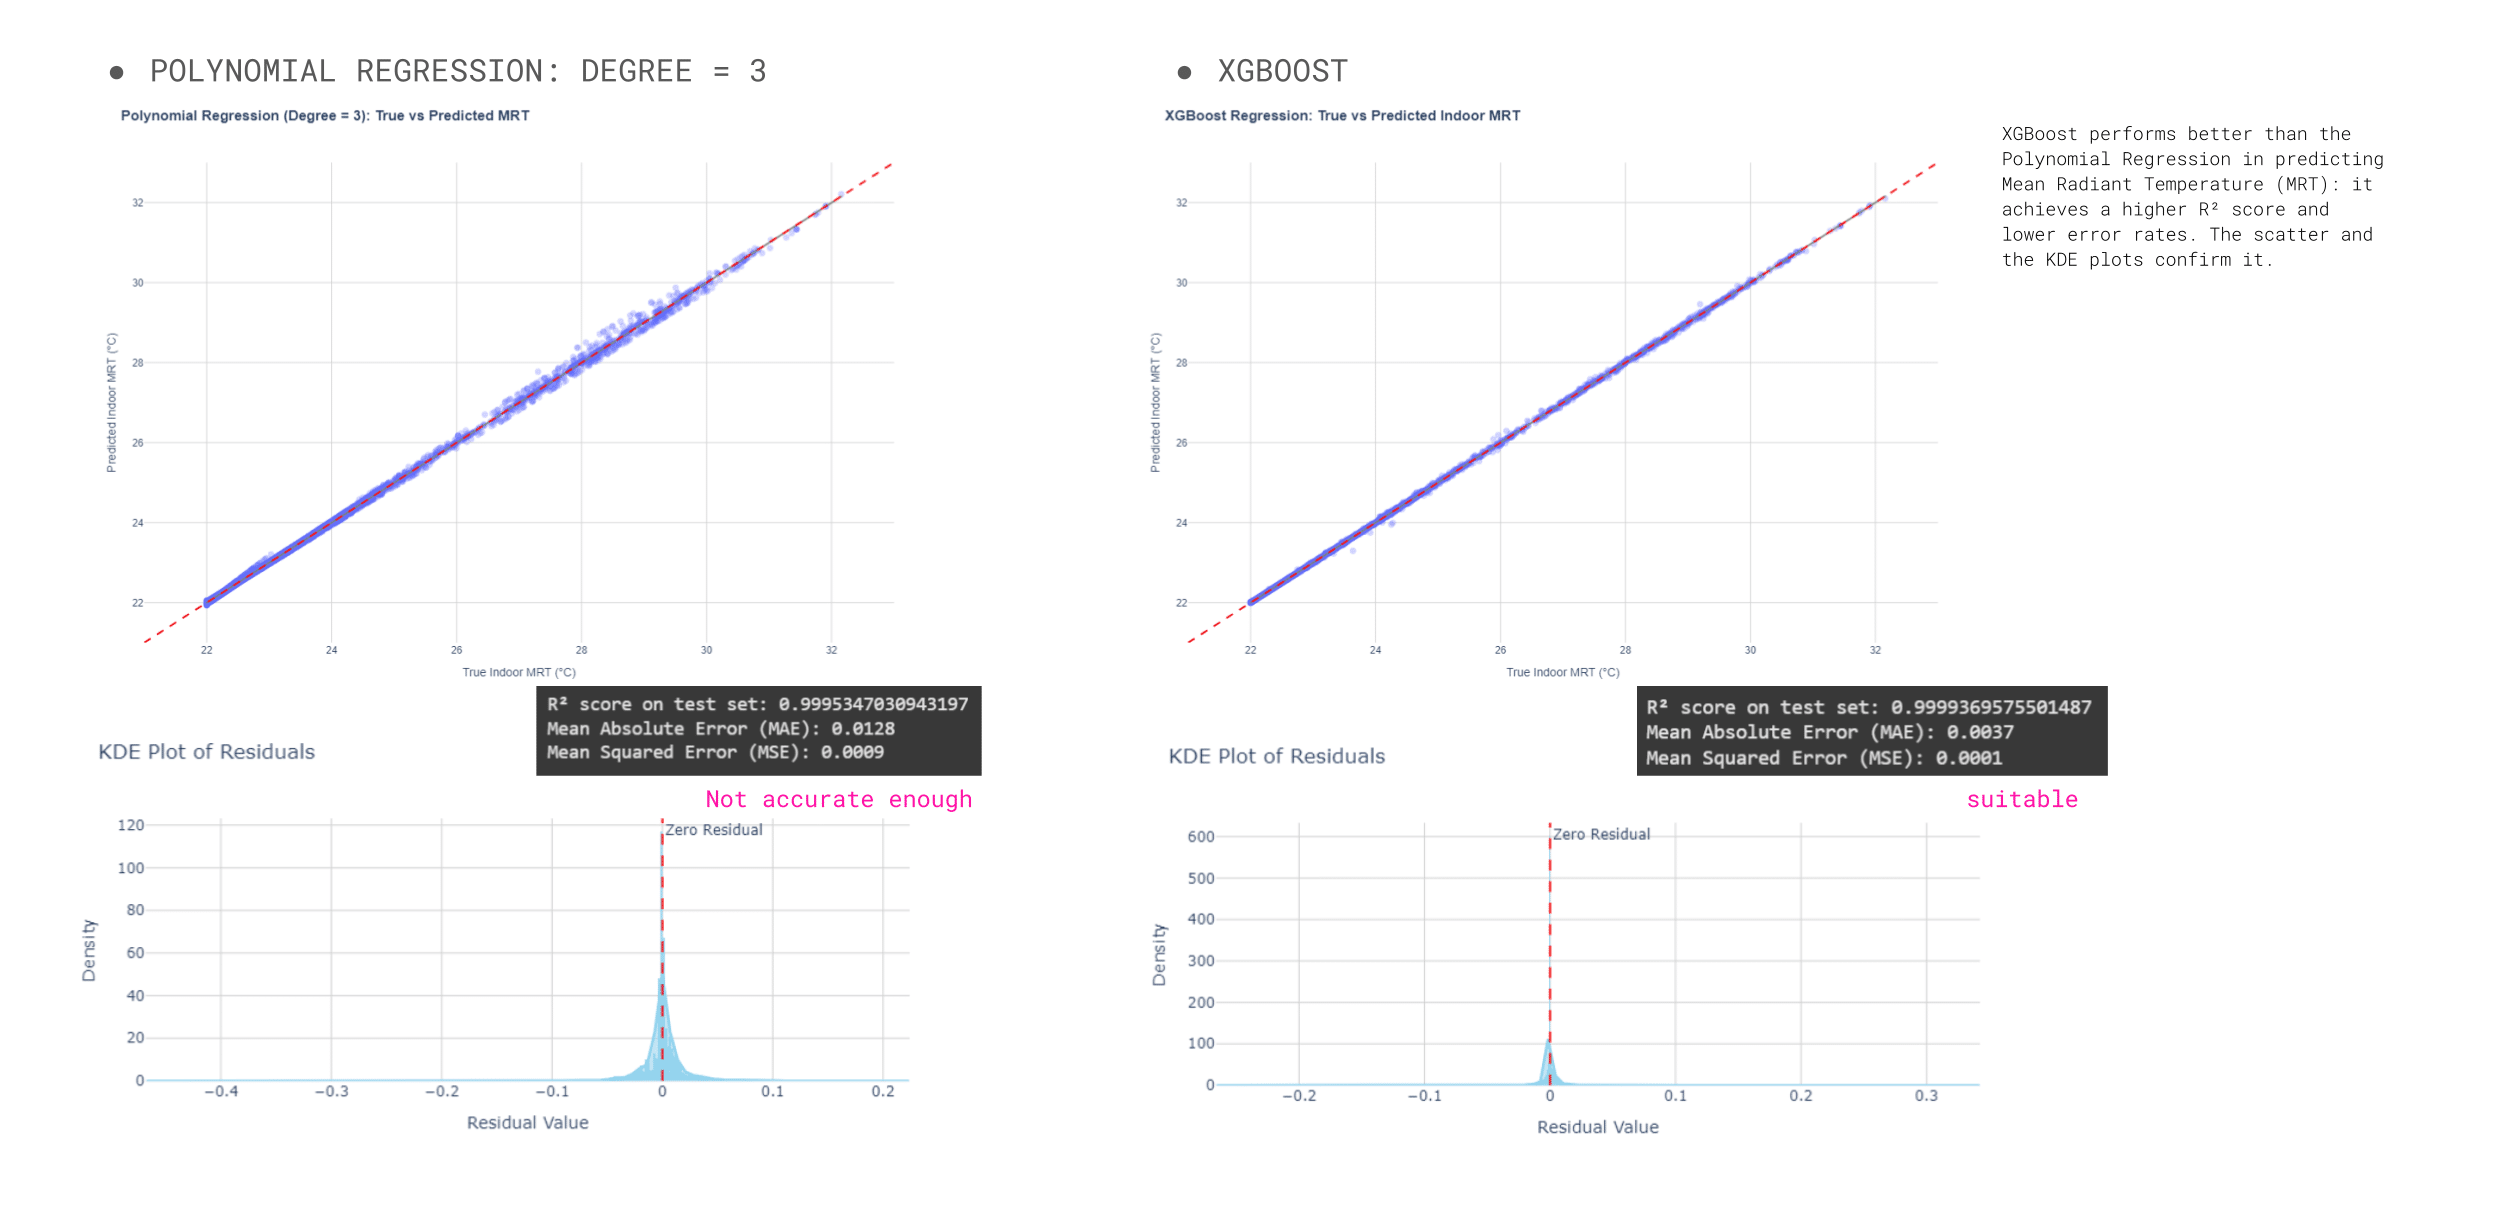
XGBoost gives good results: R²=99.99%, low MAE and low MSE, symmetric residuals tightly centered around zero.
PMV Model: Training // SHAP Analysis
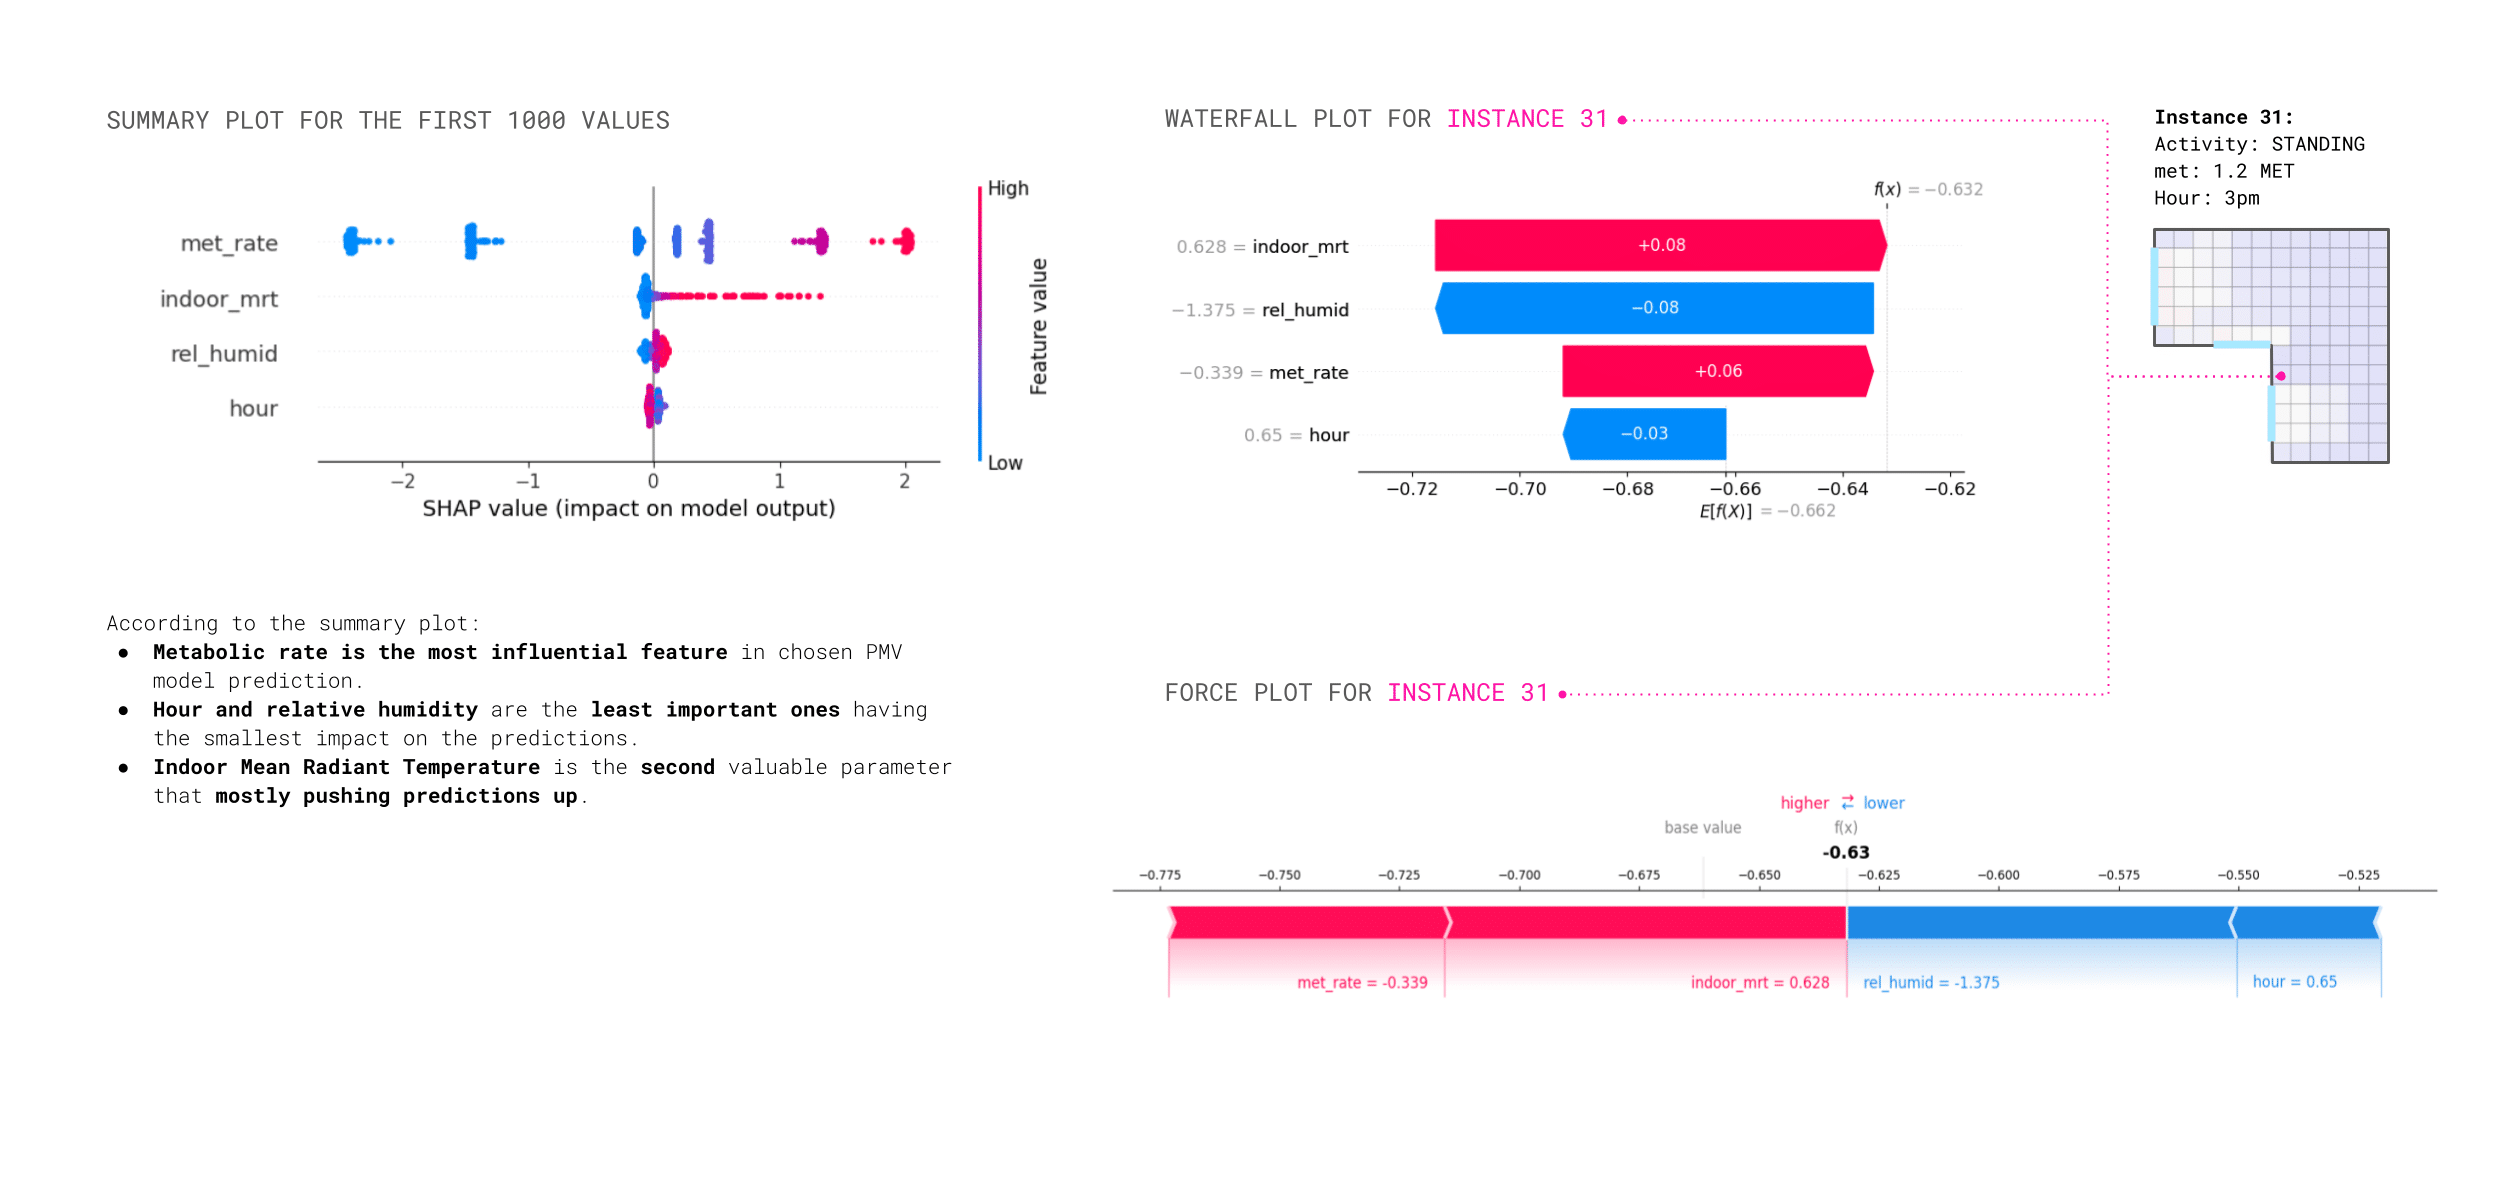
Model Deployment // Output
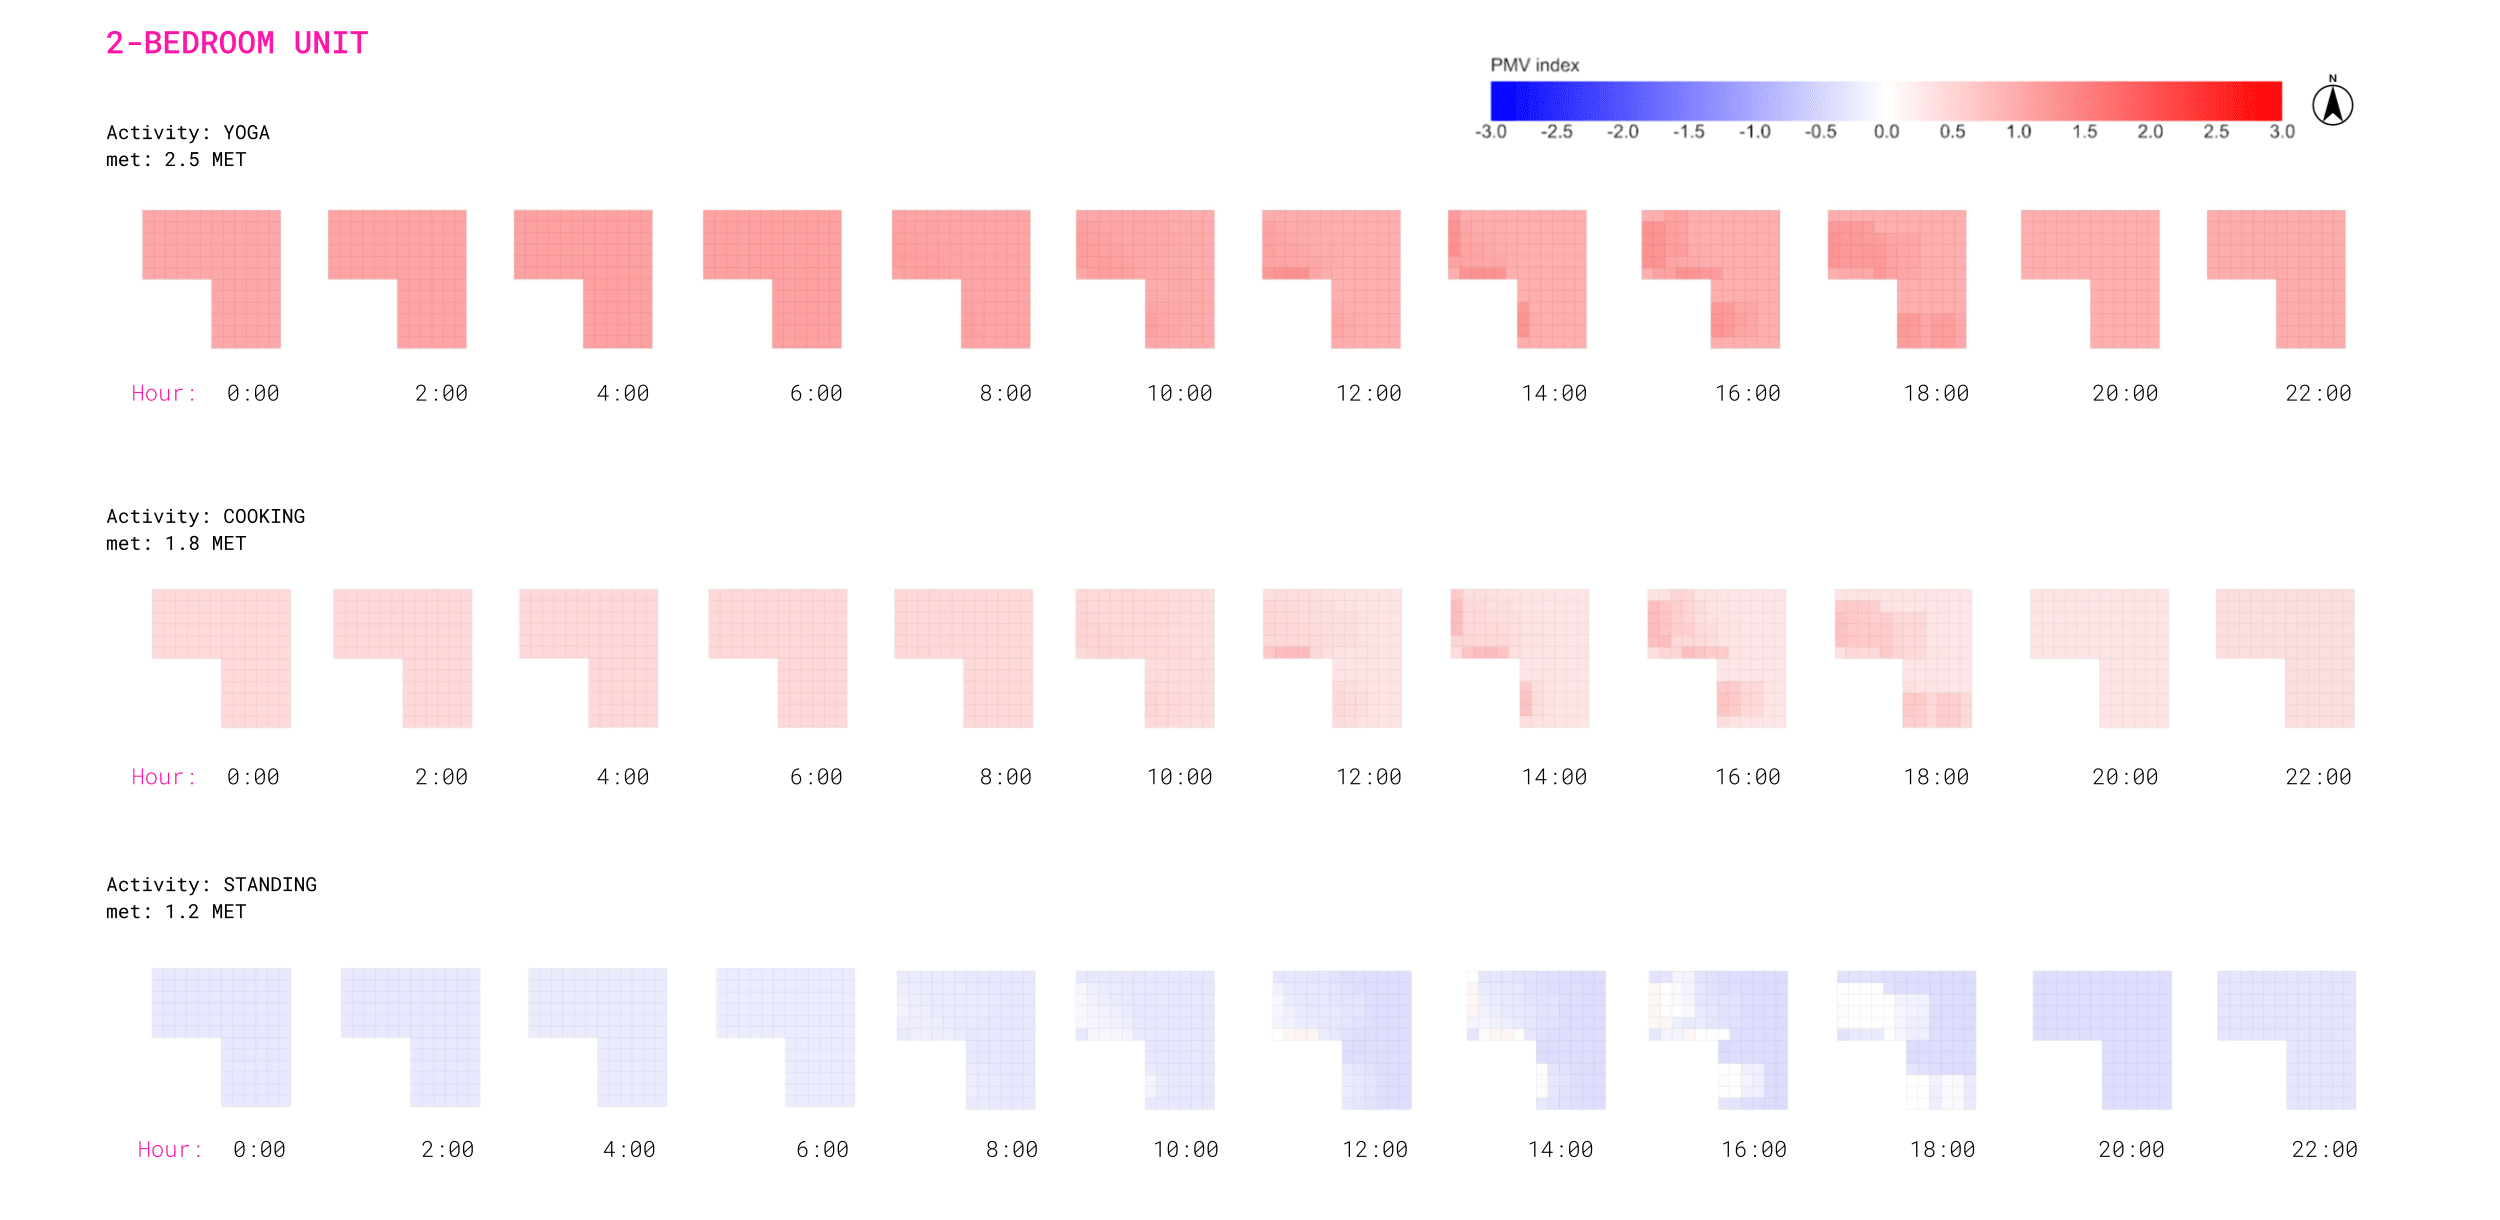
For use downstream, we normalise the range of PMV scores per activity to suggest the most and least comfortable spots.
However if the sun is down (8pm-6am), all areas are marked as suitable.
Conclusions // Model Limitations
LOCATION SPECIFIC TRAINING
The model was trained using weather data from a Madrid EPW file. This means predictions are reliable only for present-day design in Madrid, and not applicable to other climates.
SEASONAL DATA RESTRICTION
Training was limited to hourly data from the summer solstice to resolve computational bottlenecks. As a result, predictions are not balanced for winter or shoulder seasons, where comfort dynamics differ significantly.
MODEL ASSUMPTIONS
PMV calculations do not take adaptive comfort measures into account, such as occupant ability to open windows. As a result we assume a mechanical ventilation system that attempts to maintain indoor air temperature to be at or above 22°c at an air speed of 0.1m/s. This approach limits the influence of occupant behaviour and thermal autonomy.
Fanger’s PMV/PPD model reference person is always a 35 year old male of height 1.75m and 75kg. This assumption cannot be modified.
NEED FOR CONSOLIDATION
We developed three models for PMV analysis: Human body exposure to sunlight, indoor MRT, and PMV score. Due to challenges encoding spatial relationships, we couldn’t build a functional ‘Human to Sky’ model with our dataset generation method and relied on initial analysis instead.
Given more time, we could have consolidated our MRT and PMV models into one model, and compared performances.
…NEXT STEPS
Train on multiple EPW files
Location as an input
Evaluate performance across climates
Expand dataset to include hour-by-hour full year data
at least winter solstice and equinoxes
Seasonality as a feature (stratify model training)
Modelling different setpoint strategies such as night setback or demand-controlled ventilation
Mixed mode comfort model, perhaps stratified
Find a way to encode spatial data with reference to fraction of body exposed to sunlight to create an additional surrogate model for Ladybug ‘Human to Sky Relation’ analysis
Consolidate all three working models into one
Bibliography
Research Background
- ASHRAE Standard 55 American Society of Heating, Refrigerating and Air-Conditioning Engineers (ASHRAE). ASHRAE Standard 55: Thermal Environmental Conditions for Human Occupancy. Atlanta, GA: ASHRAE, 2023.
- ISO 7726:1998. Ergonomics of the thermal environment – Instruments for measuring physical quantities. International Organization for Standardization, Geneva, Switzerland.
- ISO 7730 International Organization for Standardization (ISO). ISO 7730: Ergonomics of the thermal environment – Analytical determination and interpretation of thermal comfort using calculation of the PMV and PPD indices and local thermal comfort criteria. Geneva: ISO, 2005.
- ISO 8996 International Organization for Standardization (ISO). ISO 8996: Ergonomics of the thermal environment – Estimation of metabolic rate. Geneva: ISO, 2004.
- ISO 9920 International Organization for Standardization (ISO). ISO 9920: Ergonomics of the thermal environment – Estimation of the thermal insulation and evaporative resistance of a clothing ensemble. Geneva: ISO, 2007.
- European Committee for Standardization (CEN). EN 15251: Indoor environmental input parameters for design and assessment of energy performance of buildings addressing indoor air quality, thermal environment, lighting and acoustics. Brussels: CEN, 2007.
- Thermal Insight: Optimizing Indoor Analysis. A project of Iaac, Institute for Advanced Architecture of Catalonia developed at Master in Advanced Computation for Architecture & Design in 2023-24 by Students: Manolya Nielsen, Hetal Bharwanu, Agustin Salas, under the supervision of Faculty: Angelos Chronis, Vasiliki Fragkia, Stanislava Fedorova.
- Haghirad, Maedeh, Heidari, Shahin, & Hosseini, Hojat. Advancing Personal Thermal Comfort Prediction: A Data-Driven Framework Integrating Environmental and Occupant Dynamics Using Machine Learning. SSRN, 2024. Available at SSRN.
- Qavidel Fard, Z., Zomorodian, Z. S., & Korsavi, S. S. Application of Machine Learning in Thermal Comfort Studies: A Review of Methods, Performance and Challenges. Energy and Buildings, 256, 2022. Available at Elsevier or ScienceGate.
- Park, Kyung-Yong, & Woo, Deok-Oh. PMV Dimension Reduction Utilizing Feature Selection Method: Comparison Study on Machine Learning Models. Energies, 16(5), 2023. Available at MDPI.
- Fanger, P. O. Thermal Comfort. Analysis and Application in Environment Engineering. McGraw Hill Book Company, New York, 1982.
