
From Jakarta to Data: Automating the Perfect View with VenueAnalyst
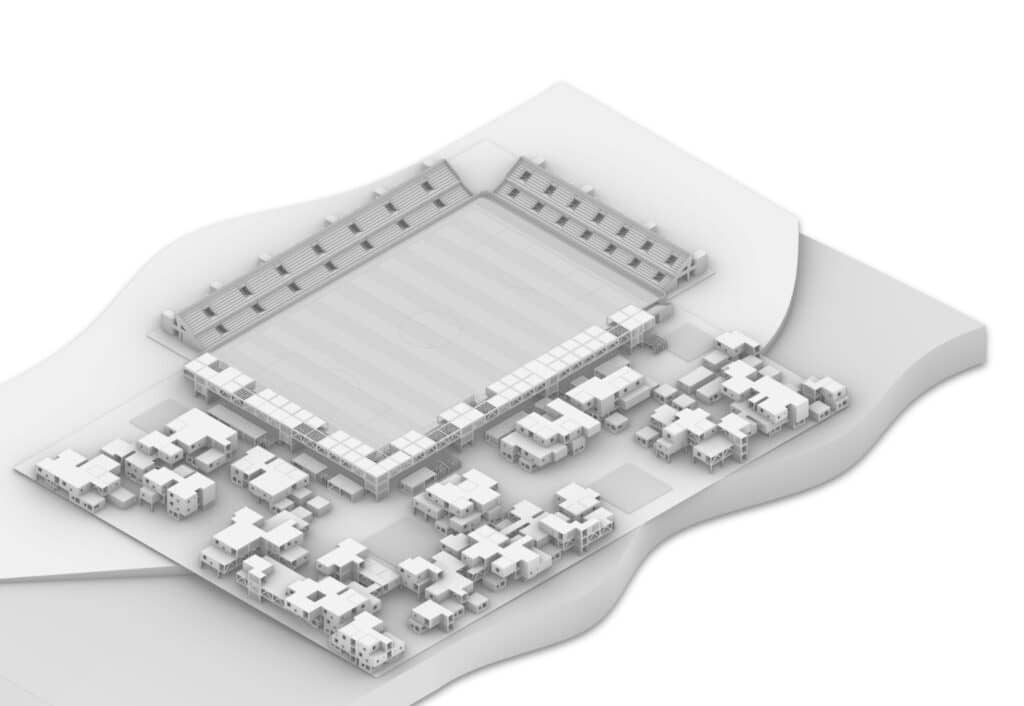
What started as a design studio project for a floating, flood-resistant stadium in Jakarta quickly evolved into a computational challenge: How do we prove a stadium actually works for the fans? While many architects focus on generating new forms from scratch, the reality of the industry is often about analyzing and retrofitting existing venues.
In modern sports architecture, the “C-Value” is the definitive metric for fan experience. However, calculating this clearance across thousands of seats traditionally requires heavy local processing and manual oversight.
VenueAnalyst bridges this gap by transforming complex parametric logic into a cloud-based web application.
The Heart of the Analysis: The C-Value
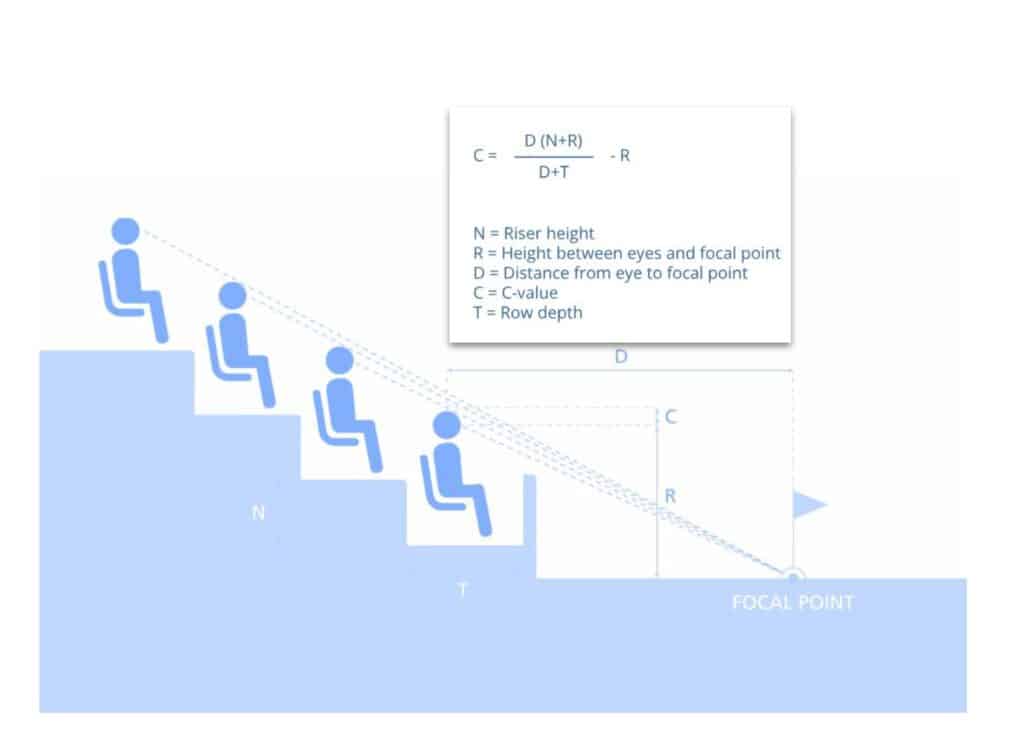
The C-Value is the vertical clearance between a spectator’s eyes and the sightline of the person sitting directly in front of them. It is the definitive metric for “quality of view.” Following FIFA and international standards, we aim for the “sweet spot” of 120mm for an excellent experience. Anything below 60mm? You’re essentially paying to watch the back of someone’s head
The Tech Stack: From Rhino to the Web
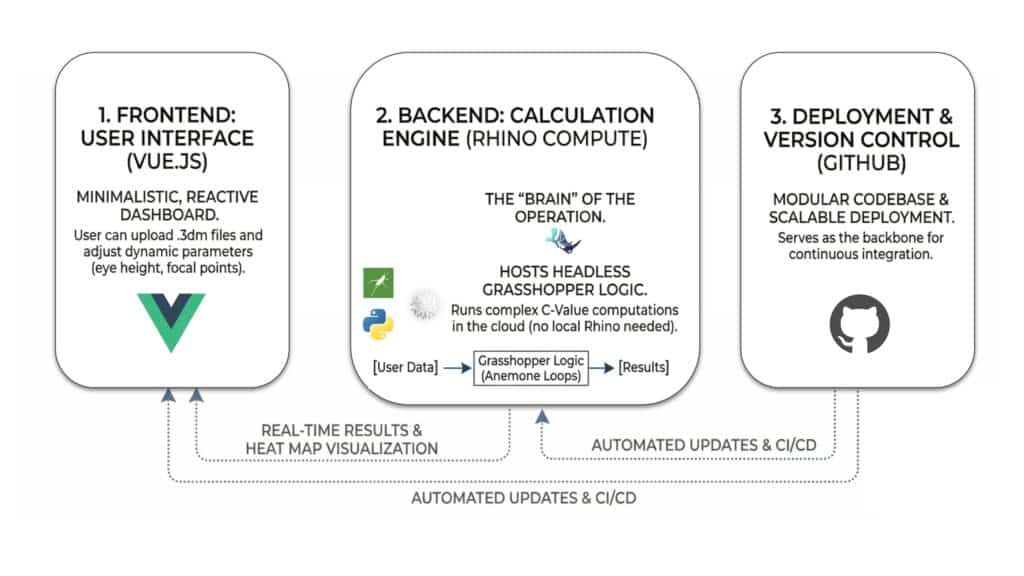
To make VenueAnalyst accessible and scalable, the project utilizes a modern AEC tech stack:
- Vue.js: The frontend framework used to build a clean, minimalistic user interface. It allows users to upload
.3dmfiles and adjust parameters—like eye height and focal points through a reactive dashboard. - Rhino Compute: The “brain” of the operation. By hosting the Grasshopper logic on a headless server via Rhino Compute, we can run complex
C-Value calculations in the cloud without requiring the user to own or open Rhino. - GitHub: Serving as the version control and deployment backbone, ensuring the codebase is modular and scalable.
Solving the Computational Bottleneck
Building a tool that can analyze thousands of seats across complex, non-uniform geometry required more than just standard Grasshopper components.
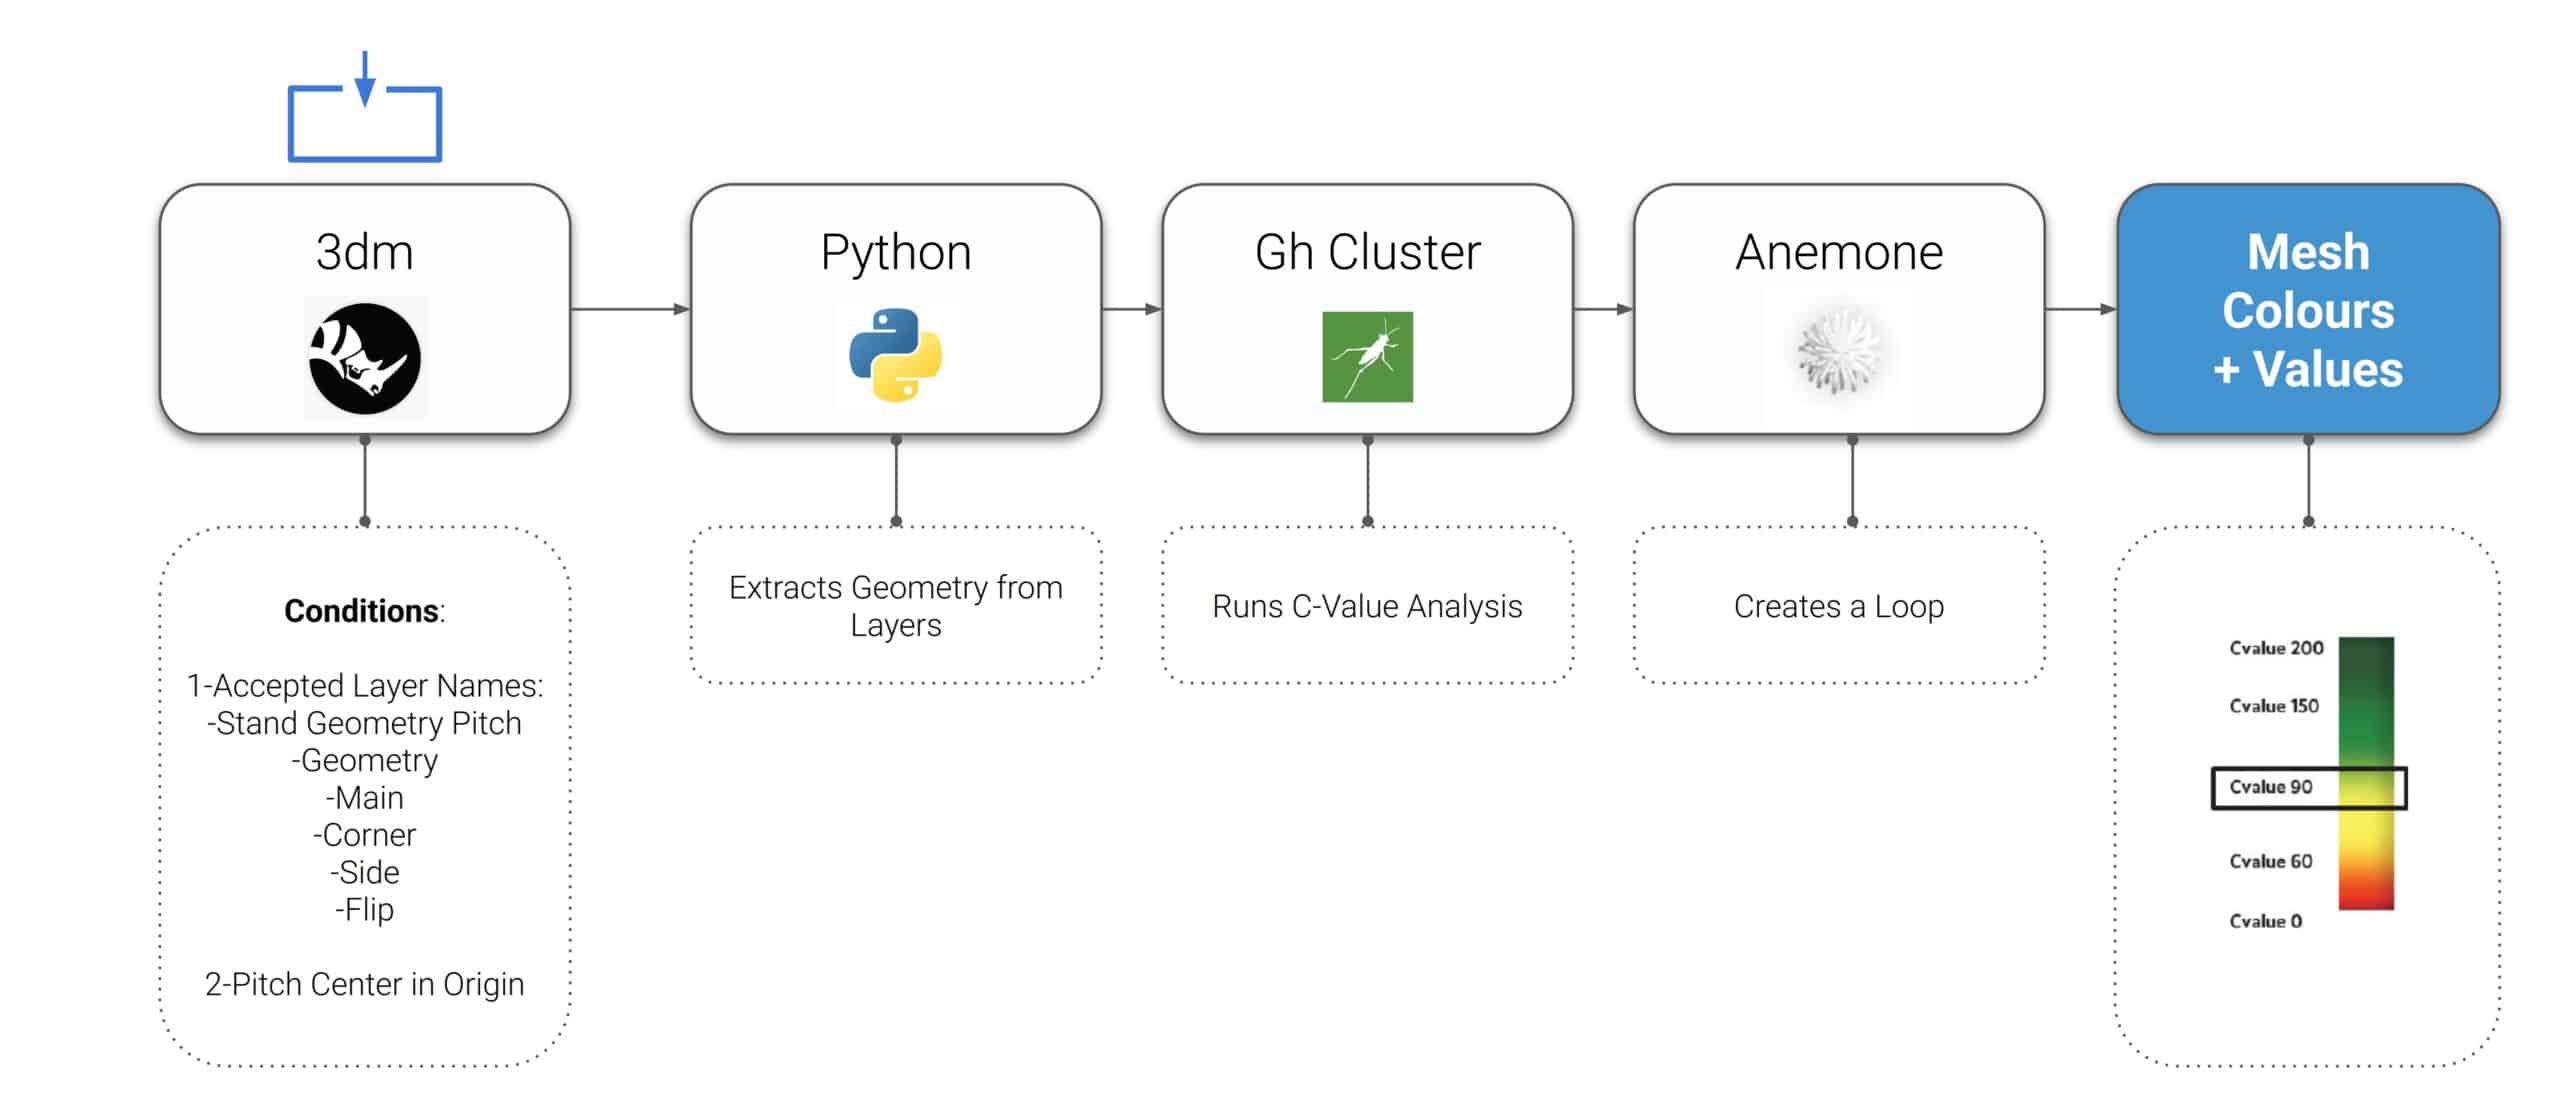
The technical workflow for VenueAnalyst relies on a “Triple Threat” of computational logic:
- Python Geometry Extraction: The app uses a custom Python script to automatically sort through Rhino files, hunting for specific layers—like “Main,” “Side,” and “Corner”, to ensure the right geometry is fed into the analysis pipeline.
- Custom C-Value Clusters: We developed a specialized cluster that calculates real-time sightlines relative to dynamic focal points, whether the venue is hosting Basketball, Tennis, or Boxing.
- The Anemone Loop (The Secret Sauce): Processing an entire stadium at once is a massive computational drain that can crash standard scripts. To solve this, VenueAnalyst utilizes an Anemone loop. This allows the script to cycle through the stadium stand-by-stand, sequentially calculating data and stitching it back together into a single, unified heat map.
Data Visualization: From Math to Heat Maps
The final output is a high-fidelity C-Value Heat Map. By translating raw numerical clearance data into a color-coded mesh, architects can instantly identify “Poor” (under 60mm) versus “Excellent” (over 90mm) sightlines. By combining the parametric power of Grasshopper with the accessibility of Vue.js and Rhino Compute, VenueAnalyst provides a blueprint for the future of data-driven venue design.
At the Bottom find an Explicative Video and Demo of the Application:
