
Innovation is a buzzword these days, and everyone seems to be talking about it. However, truly understanding it is a different ball game. Take the Global Innovation Index by the World Intellectual Property Organization (WIPO), for example. It’s a massive framework that pulls data from top-tier organizations worldwide, scoring countries on 100+ indicators. It’s a solid way to quantify innovation.

Now, imagine you’ve got an Excel file with data for 100+ indicators for every country in the world. Sounds overwhelming, right? This is where Python comes in handy, especially with libraries like pandas and visualization tools like Plotly or Contextily. They can turn this massive task into something quite manageable. The first step is importing this Excel file into a DataFrame to make sense of it.
Sorting Info for a General Score and Displaying it in a Bar Chart
Let’s say we’re looking at the EU countries. Python can dig out the general score from this DataFrame and whip it up into a dynamic bar chart. The cool thing about this chart is its interactivity – you can zoom in on the countries you’re interested in, like the top 5, bottom 5, or even a random selection.
Visualizing the Main Indicators for the Total Score
Countries can be visualized in different ways. One approach is to use the sorted bar chart and include the main indicators that make up the general score. Drag and select a country, say Sweden, and the graph will show just those indicators. This is super useful for zooming in on data, like the first two countries, for instance. You can also visualize these main indicators using a pie chart.
Zooming in on Spain for Detailed Analysis
Focusing on Spain, you can plot each main indicator on a rose chart. Plus, you can compare Spain’s performance to the EU average to identify areas needing improvement. Where Spain is falling short, a bar chart with all the sub-indicators can be created to pinpoint intervention areas. This kind of visualization helps zero in on where targeted support is necessary.
Which Country to Learn From?
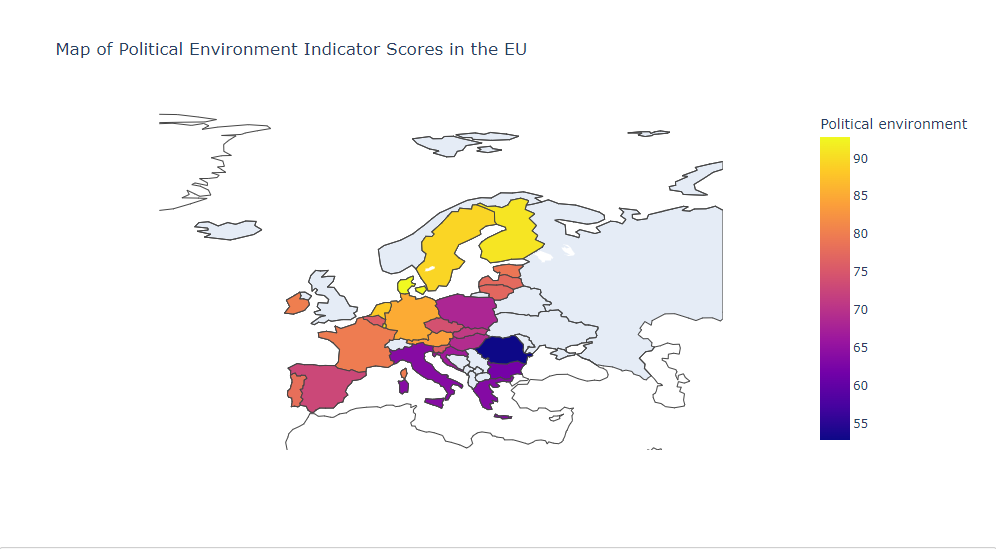
Another neat trick is plotting the desired indicators on an EU map. This helps policymakers see which countries are acing certain indicators, allowing them to reach out and learn from these best practices. The example below shows the Political Environment indicator for all EU countries.
Conclusion
In conclusion, a bit of Python can make big data more tangible and understandable, especially for students in City and Technology. These dynamic visualizations can be shared online, making it easier for the public to get involved in decision-making processes.
