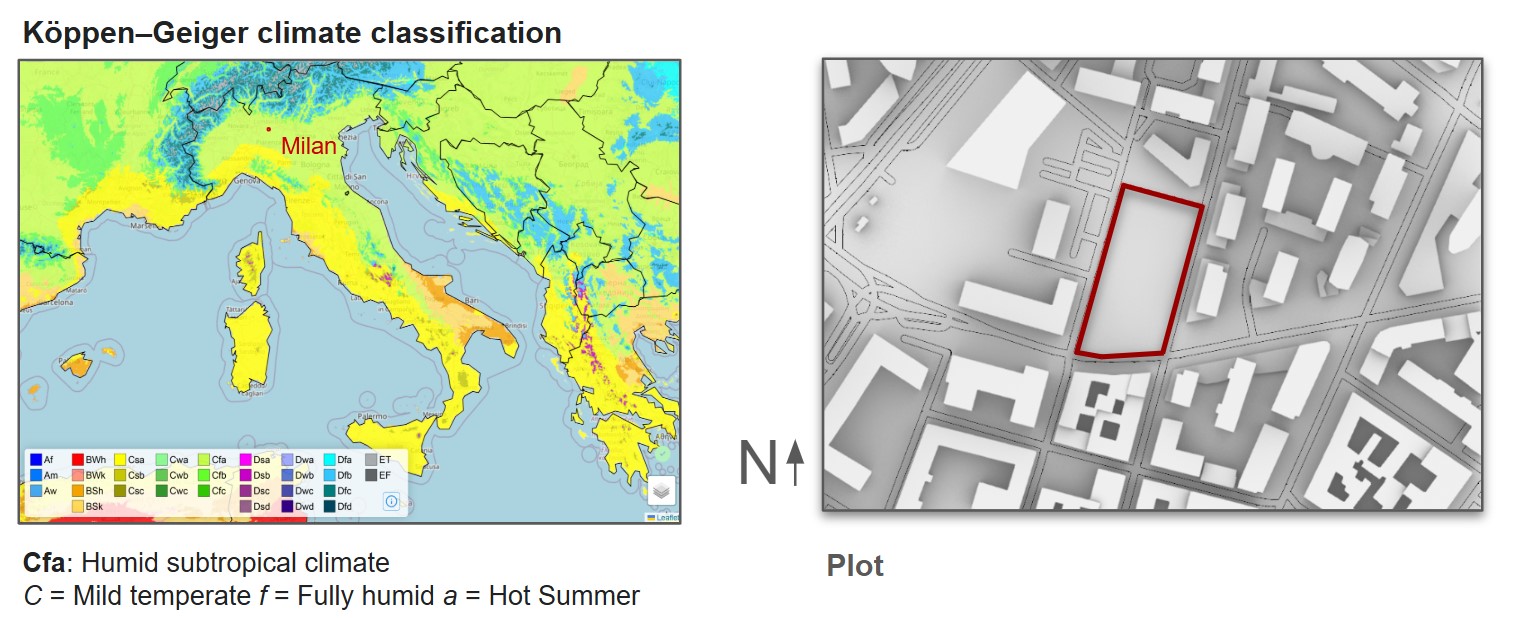
LOCATION
City: Milan
Climatic cat.: Zone E, 2 404 DD – by ENEA National Agency
Coordinates: 45°28′01″N 9°11′24″E
Altitude: 120 m s.l.m.
Characteristics:
Hot summers and cold winters. Local exceptions to the humid subtropical climate model are to be expected.
Protected from both cold winds and mild winds.
High humidity, given the alluvial nature of the plain.
Plot area: 5500 m²
CLIMATE ANALYSIS

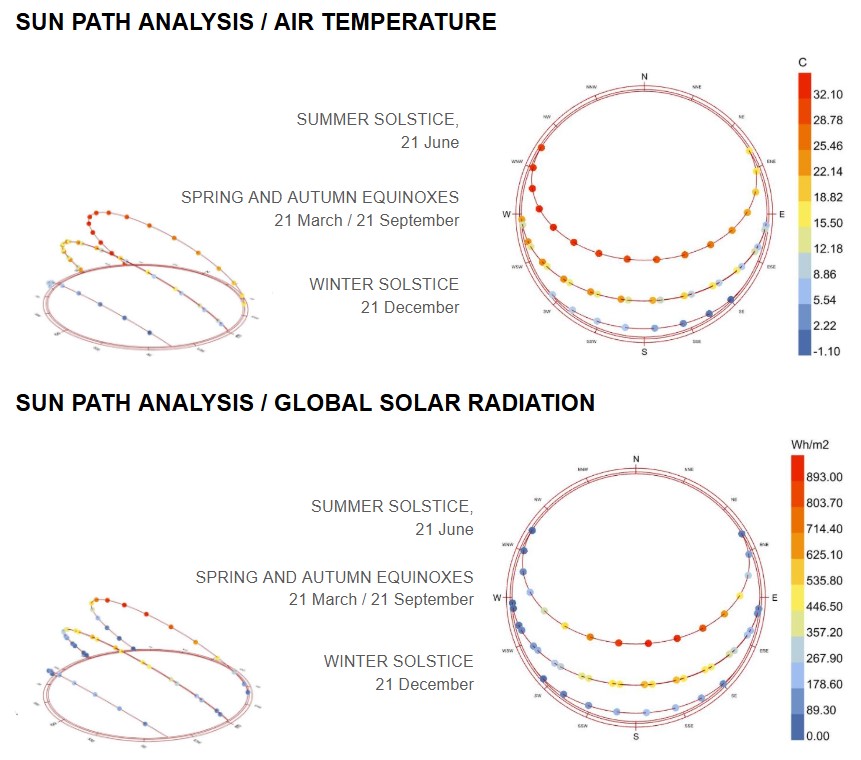
The main climate parameters considered in the analyses are:
- The yearly temperatures go from -5 degrees in winter, to 35 degrees in summer.
- A high Relative humidity, especially in autumn and winter.
- A maximum horizontal solar radiation is about 500W/m2.
- A low Wind speed throughout the year, with peaks of 9 to 12 m/s SE.
The followings can be deduced to inform the environmental design in Milan:
- Solar radiation should be limited in summer, while solar gain should be favored in spring and autumn.
- Sun hours should be maximized in winter.
- To be consider passive cooling strategies in SPRING and AUTUMN
ENVIRONMENTAL SIMULATIONS
GEOMETRY AND CONTEXT
The object of our design are two towers, with the represented predefined parameters. The optimization strategies will modify the shape of the building, the Shading offset, Window count and position.

Input:
- Base outline T1 & T2
Fixed parameters:
- GFA total project
- Fillet radius
- Window opening
- Floor height
Variables:
- Rotation base
- Ratio GFA
- Shading offset
- Window count
- Position
SOLAR RADIATION AND SUN HOURS
WORKFLOW

OPTIMIZATION: RELATIVE POSITION
We defined an initial shape and generated another shape with the optimization for solar radiation and sun hours, obtained through rotation of the base and modifying the GFA.

OPTIMIZATION: SHADING
The effect of horizontal overhangs on solar radiation and sun hours in their worst case scenarios was evaluated.

RESULTS
Position: Shading from the context and within the same project building can be rapidly improved in early stage of design with intuitive strategies.
Rotation: Asymmetric buildings
Horizontal shadings:
- Very effective for South/South-East/South-West exposures
- Not effective for East and West exposures.
- Minimizing solar gains in summer bring to very low percentage of average sunlight hours in winter.
- No shading is required on the north exposure for solar heat gains.
THERMAL COMFORT
WORKFLOW

OPTIMISATION
UTCI ANALYSIS
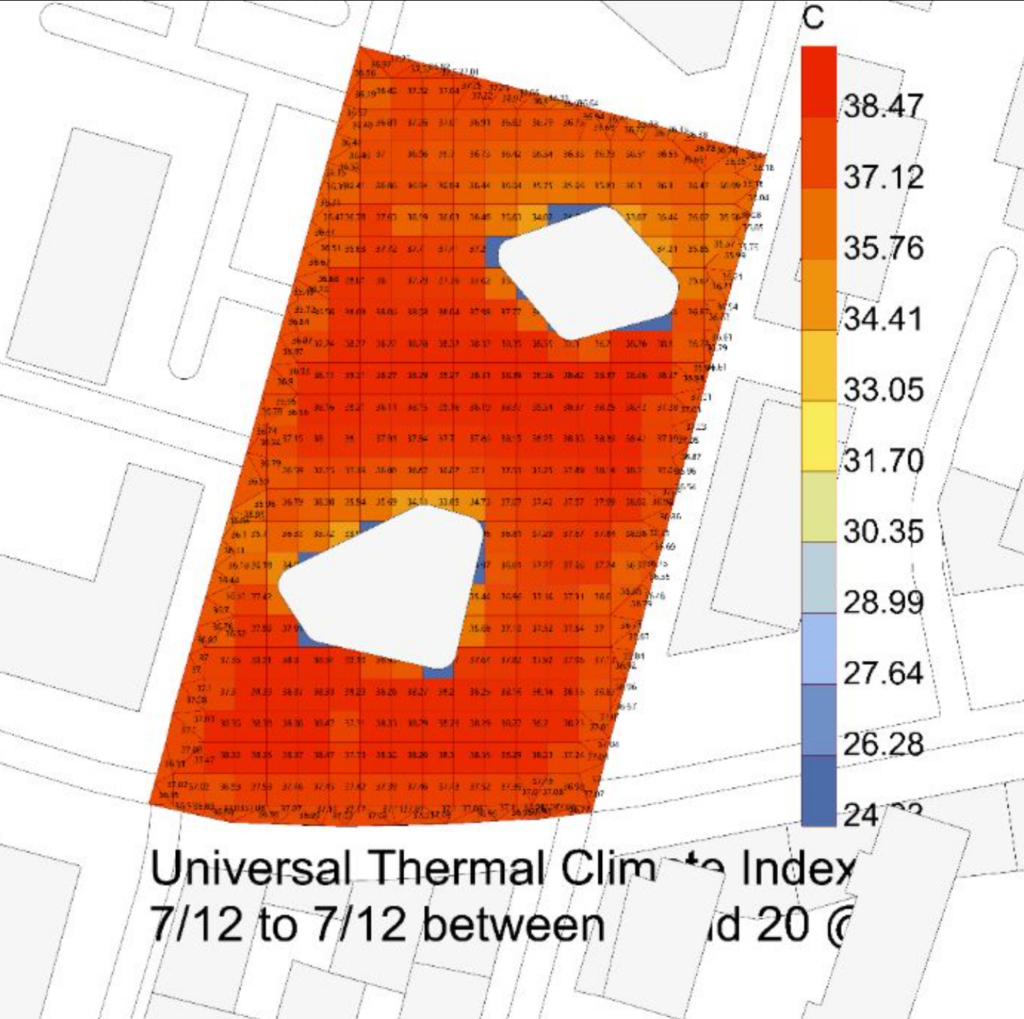
Extremely hot day: 12/7
Strategy 1: Trees
Objective:
Improving UTCI by placing trees
Strategy 2: Ground materials
Paving vs Grass lawn
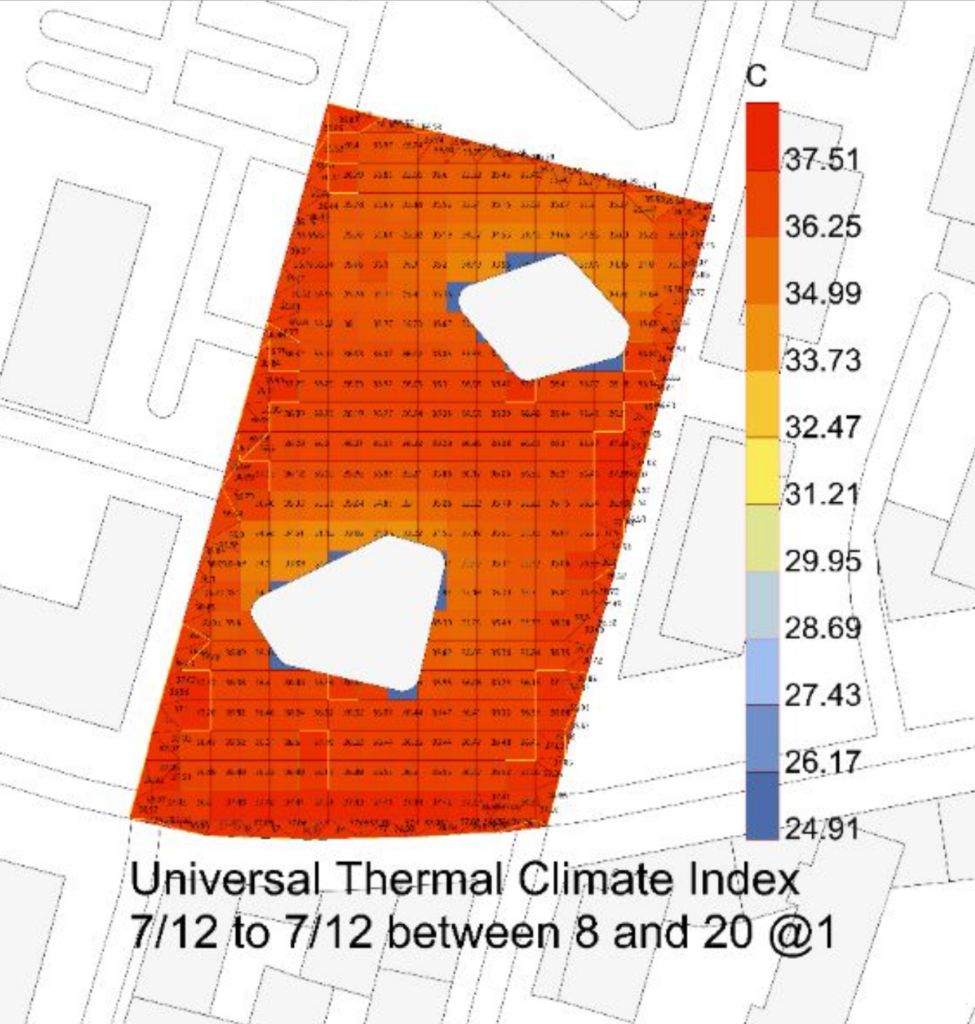
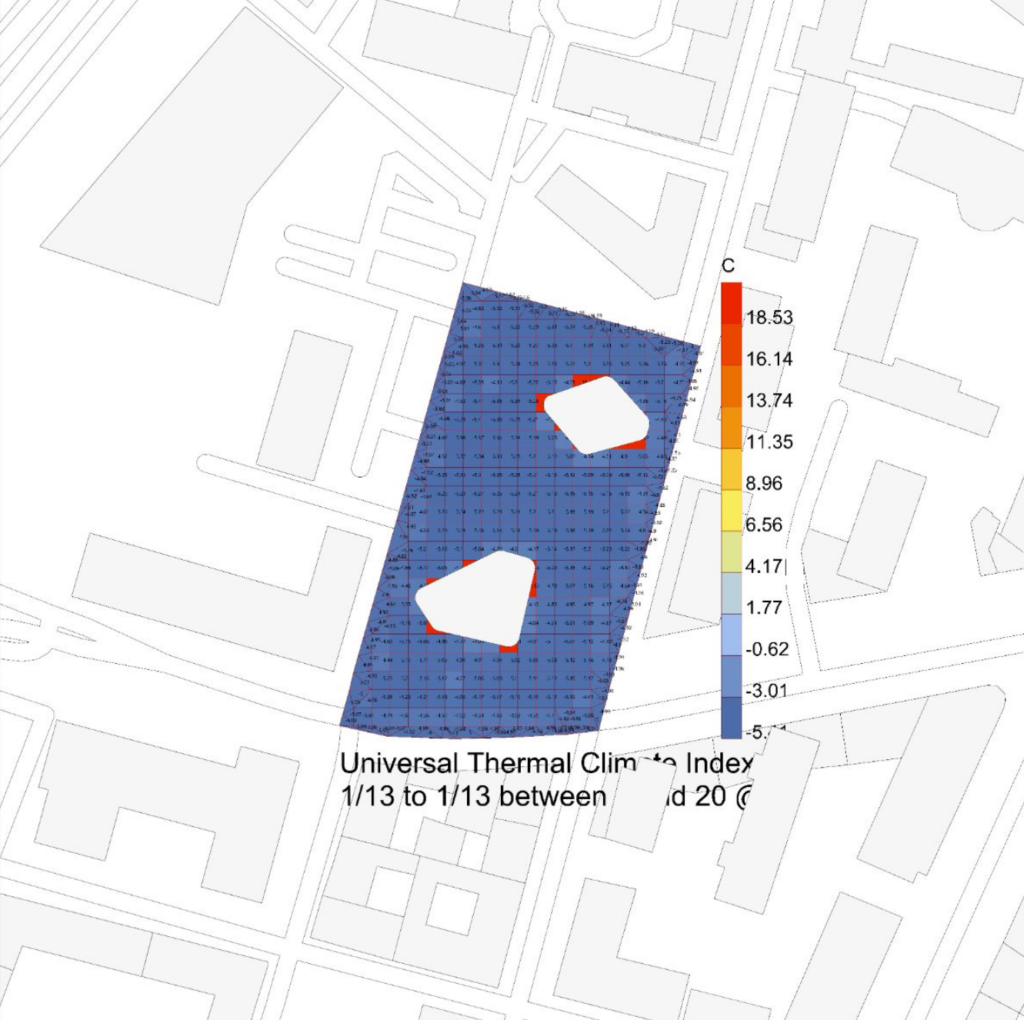
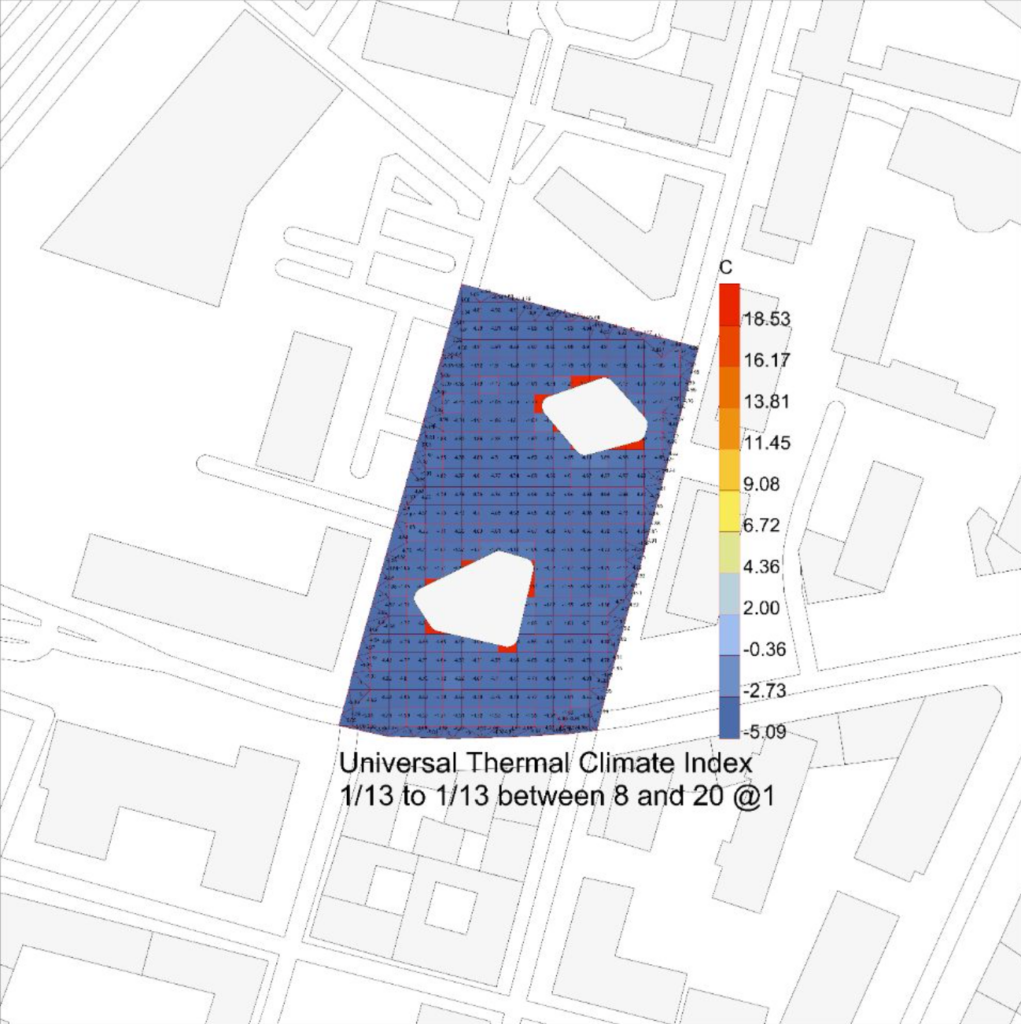
Extremely cold day:
13/1
Strategy 1: Trees
Objective:
Improving UTCI by placing trees
Strategy 2:
Ground materials
Paving vs Grass lawn
Strategy 3:
Fixed shading elements for paths
RESULTS
Initial optimization/analysis: Thermal comfort optimization for average day does not guarantee thermal comfort throughout the year.
Strategy 1 (Trees): In hot conditions, trees have a significant positive impact on the UTCI. In cold conditions, trees have limited positive impact on the UTCI.
Strategy 2 (Materials): Grass has a positive impact on the UTCI while hard ground coverage (asphalt & other pavements) have a negative impact.
Strategy 3 (Shading elements): Strategically placed shading elements can have a significant positive impact on the UTCI in hot conditions while not significantly worsening the UTCI in cold conditions.
Additional: It seems easier to improve UTCI in hot conditions compared to cold conditions.
DAYLIGHT
WORKFLOW

OPTIMIZATION
Optimization set-up
Parameter 1: Scaling step
Parameter 2: Scaling center
Parameter 3: HorizontalShading
Parameter 4: Vertical Shading & Windows
Objective: Maximize DF while minimizing direct sunlight in summer (Maximize DF/Sun Hours)

RESULTS
Using Galapagos, the best fit balance for maximizing DF, while minimizing direct sunlight in summer, was found to be with the following parameters:
- Window every 2 meters
- H Shading depth: 0.6m
- V Shading depth: 0.4m
- Scale step T1: 0.02
- Scale step T2: 0
So reaching an average DF value of 1.64 and an average Sun Hours value of 1.6
WIND | EDDY 3D
WORKFLOW
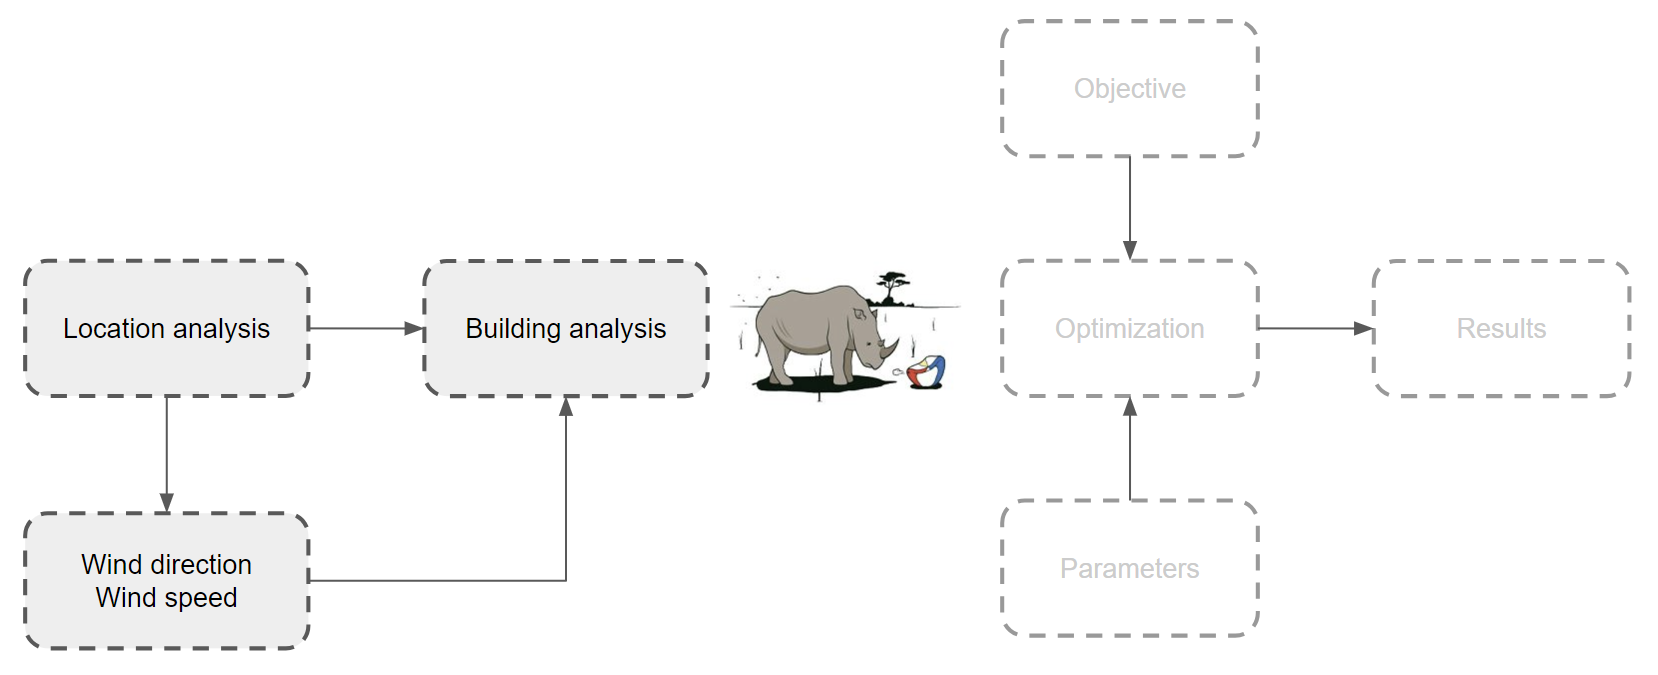
ANALYSIS
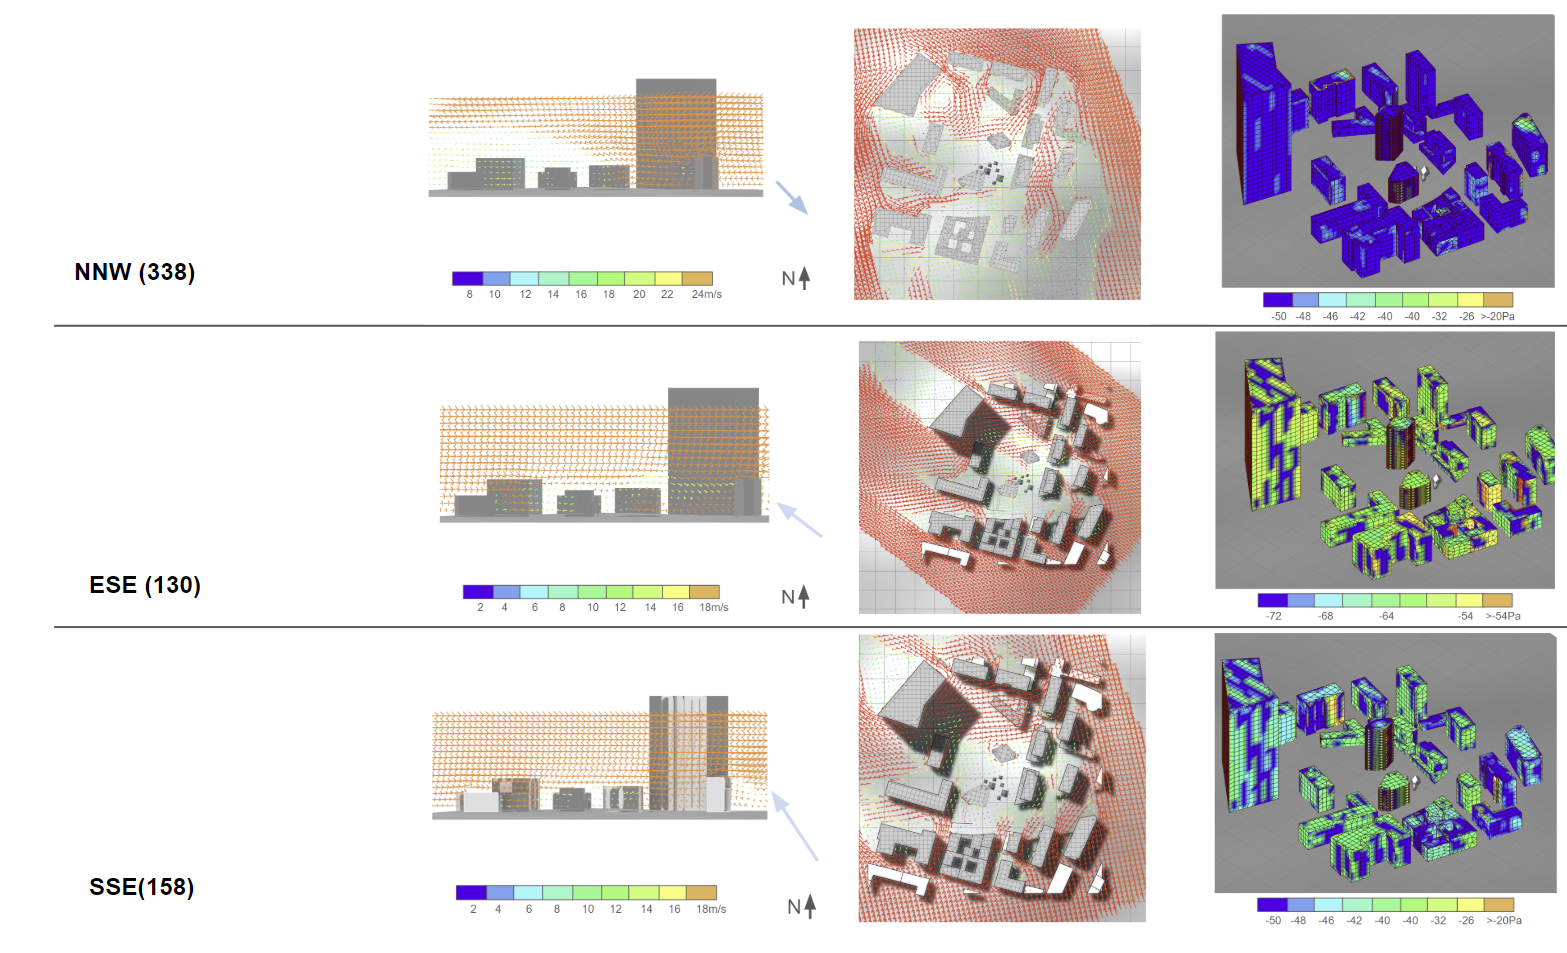
If we look at the results of the analysis, as an overall conclusion we can state that our building geometry has little effect on the wind speed . However, it is interesting to see how the surrounding buildings affect the wind with the Venturi effect being the most obvious. Regarding the plot, wind coming from the NNW and ESE seem to have more negative impact compared to the main wind direction, being SSE.
WIND | INFRARED
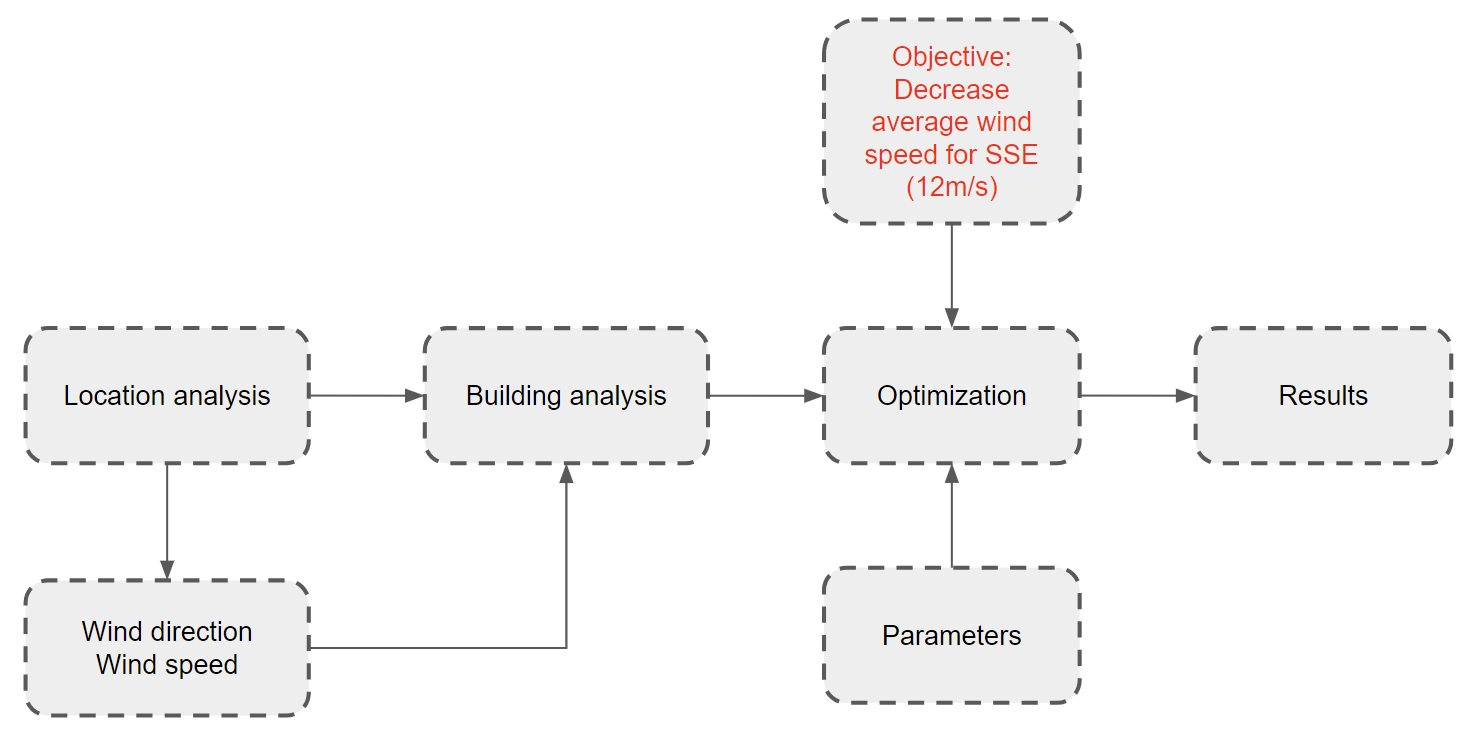
WORKFLOW
ANALYSIS
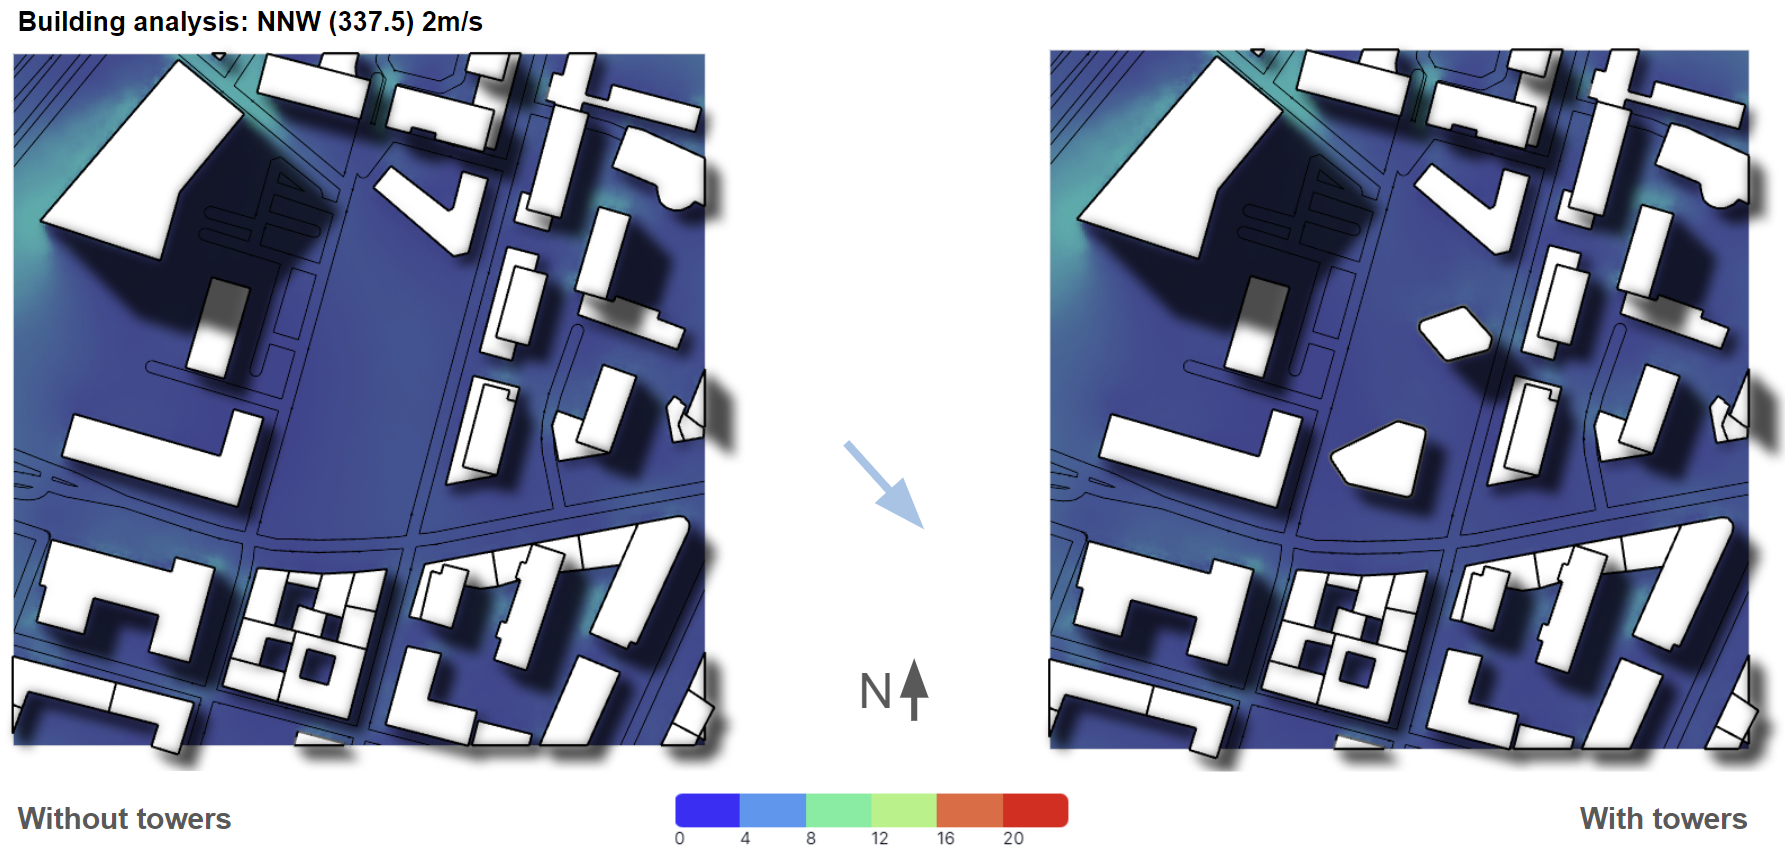
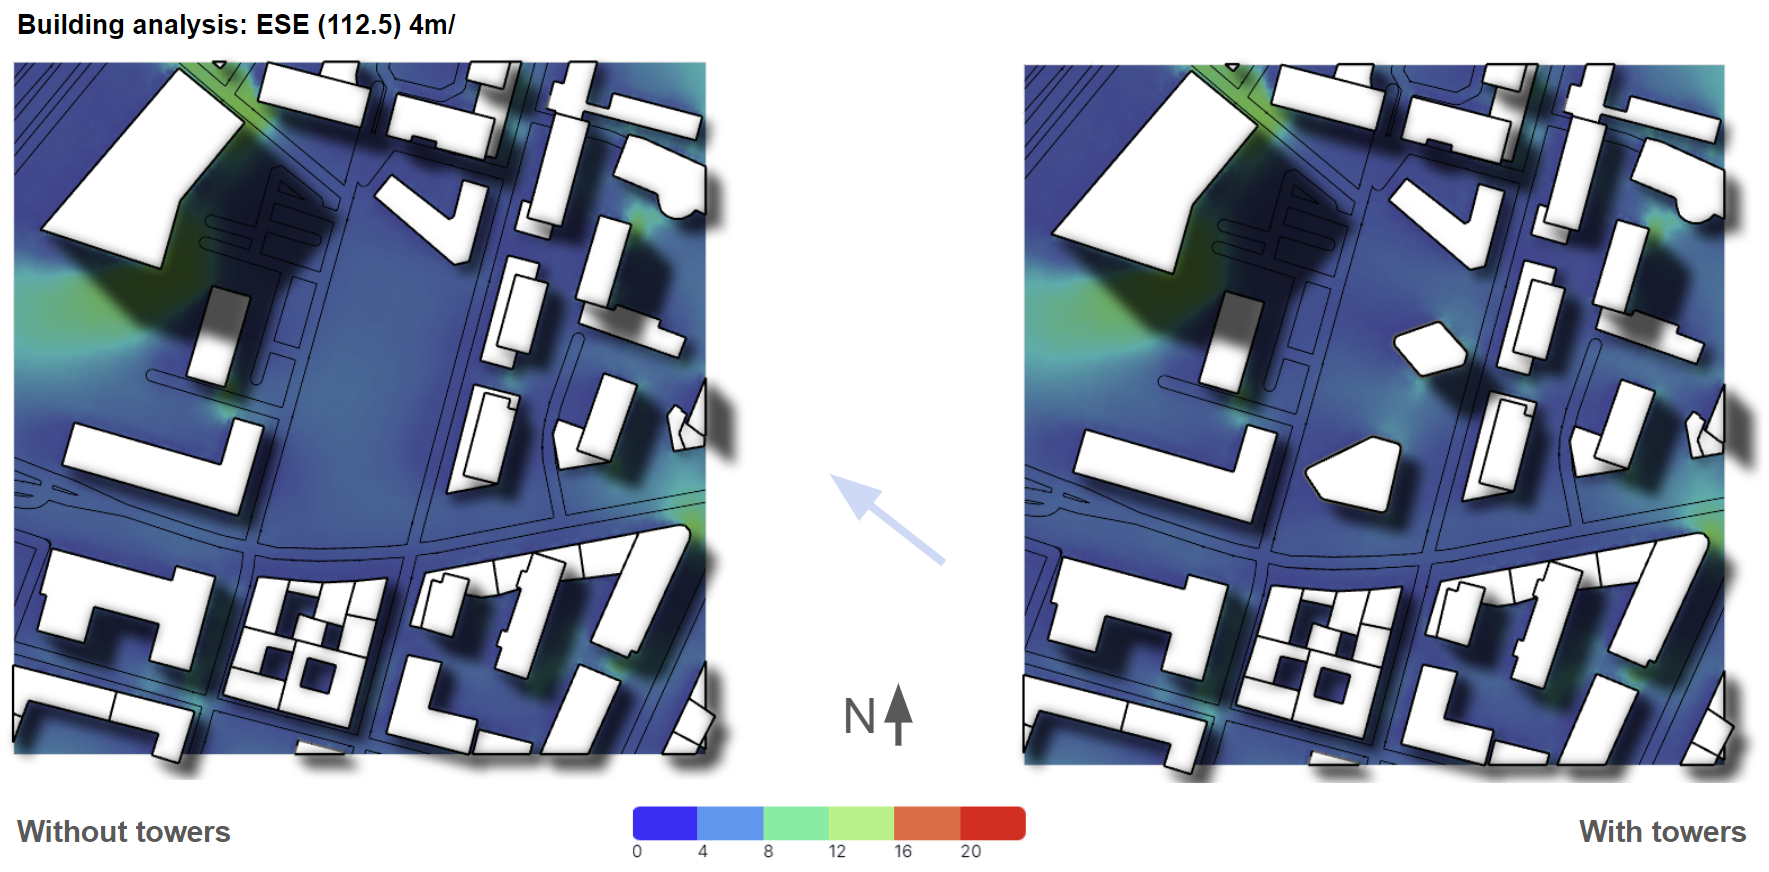
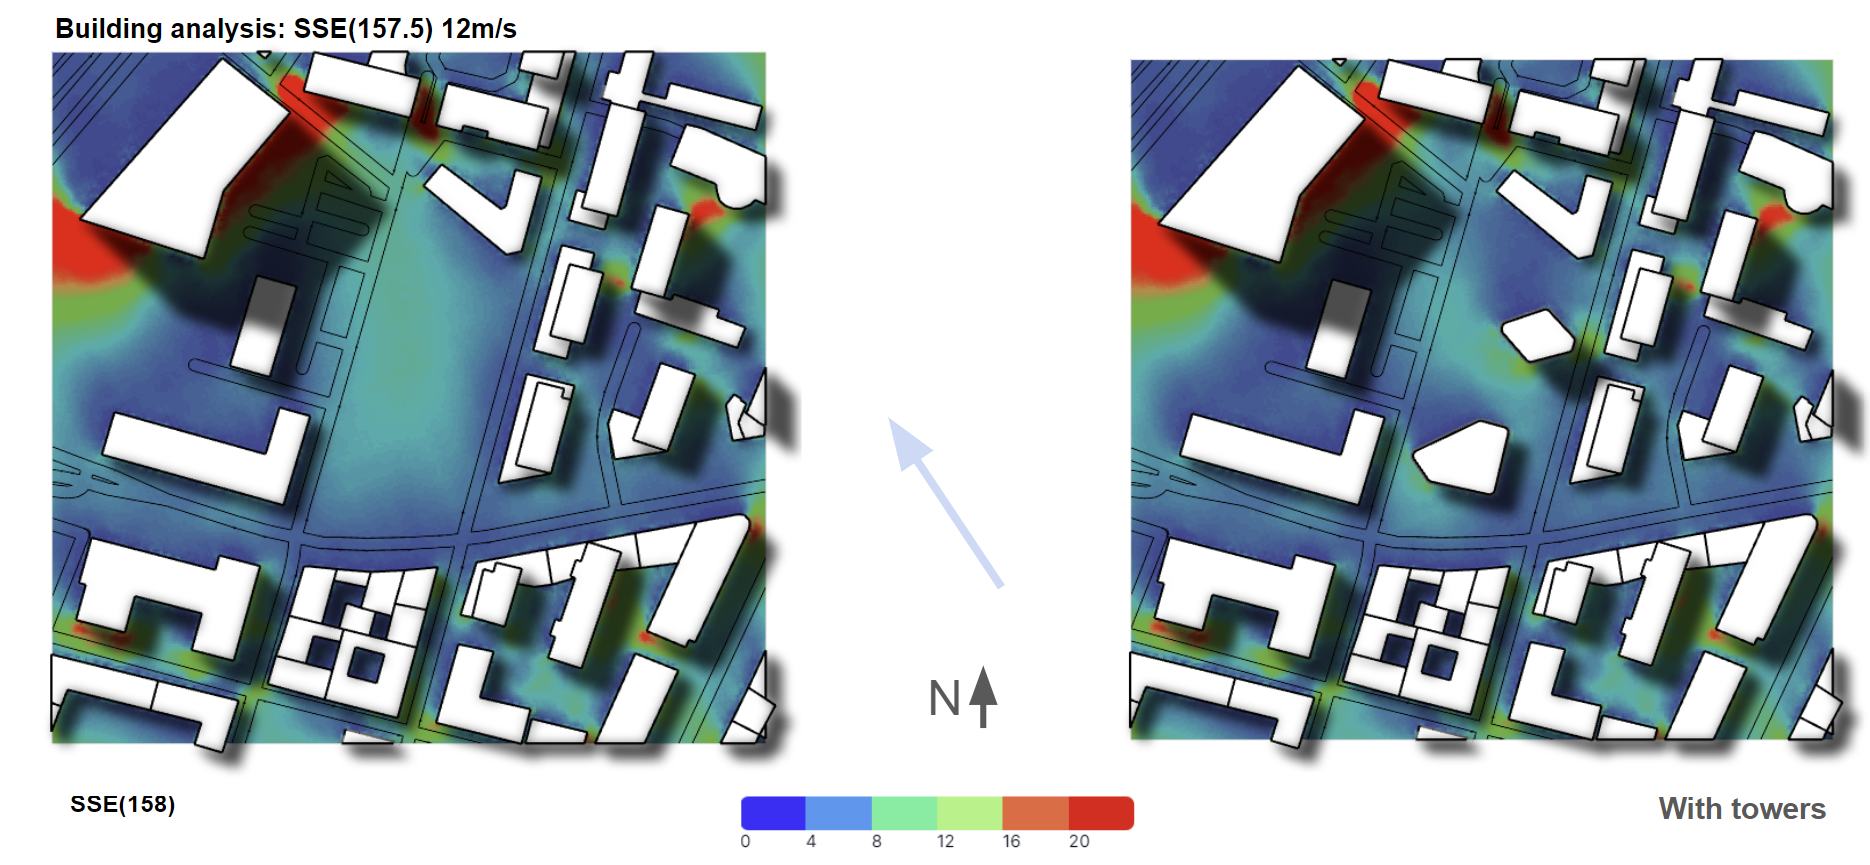
By comparing the analysis of the location without our building geometry to the same location with building geometry we can easily identify the effect our building geometry has on the windspeed and wind direction. From the analysis we can conclude that the NNW and ESE have insignificant impact. The wind coming from the SSE however, has some noticeable effect, which is why we decided to optimize the building geometry for the wind coming from this direction at 12m/s.
OPTIMIZATION
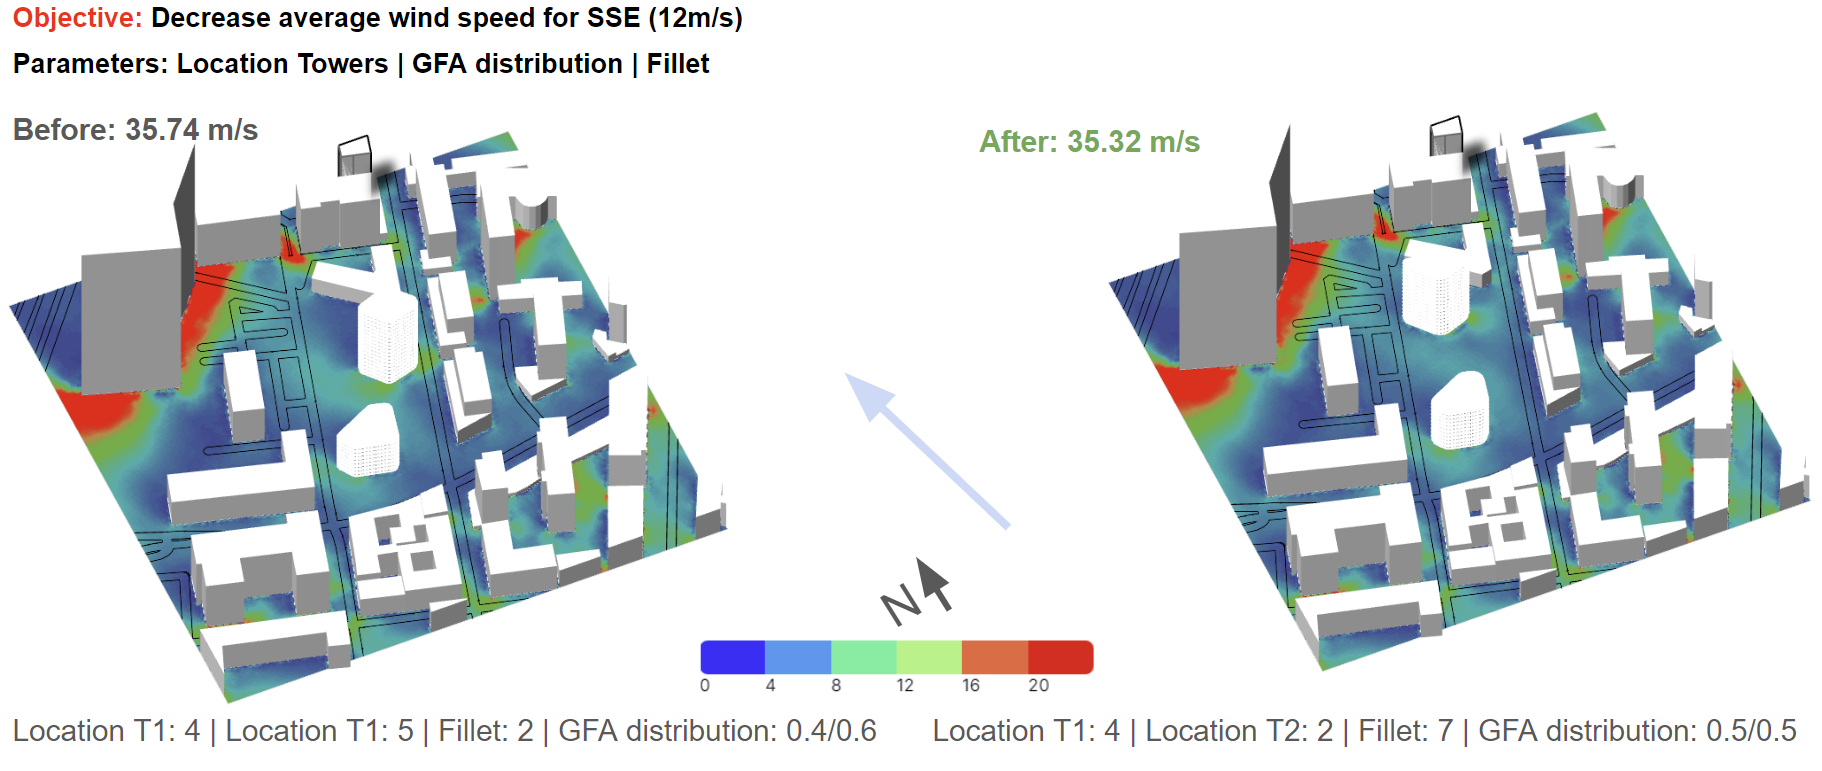
As a result of the optimization the building geometry has changed. First of all, the location of tower 1 has changed to a more north western location. Also, the fillet radius of the corners of the towers have increased from 2 to 7 meters, resulting in a decrease of the corner effect.
RESULTS & OUTLOOKS
COMPARING RESULTS
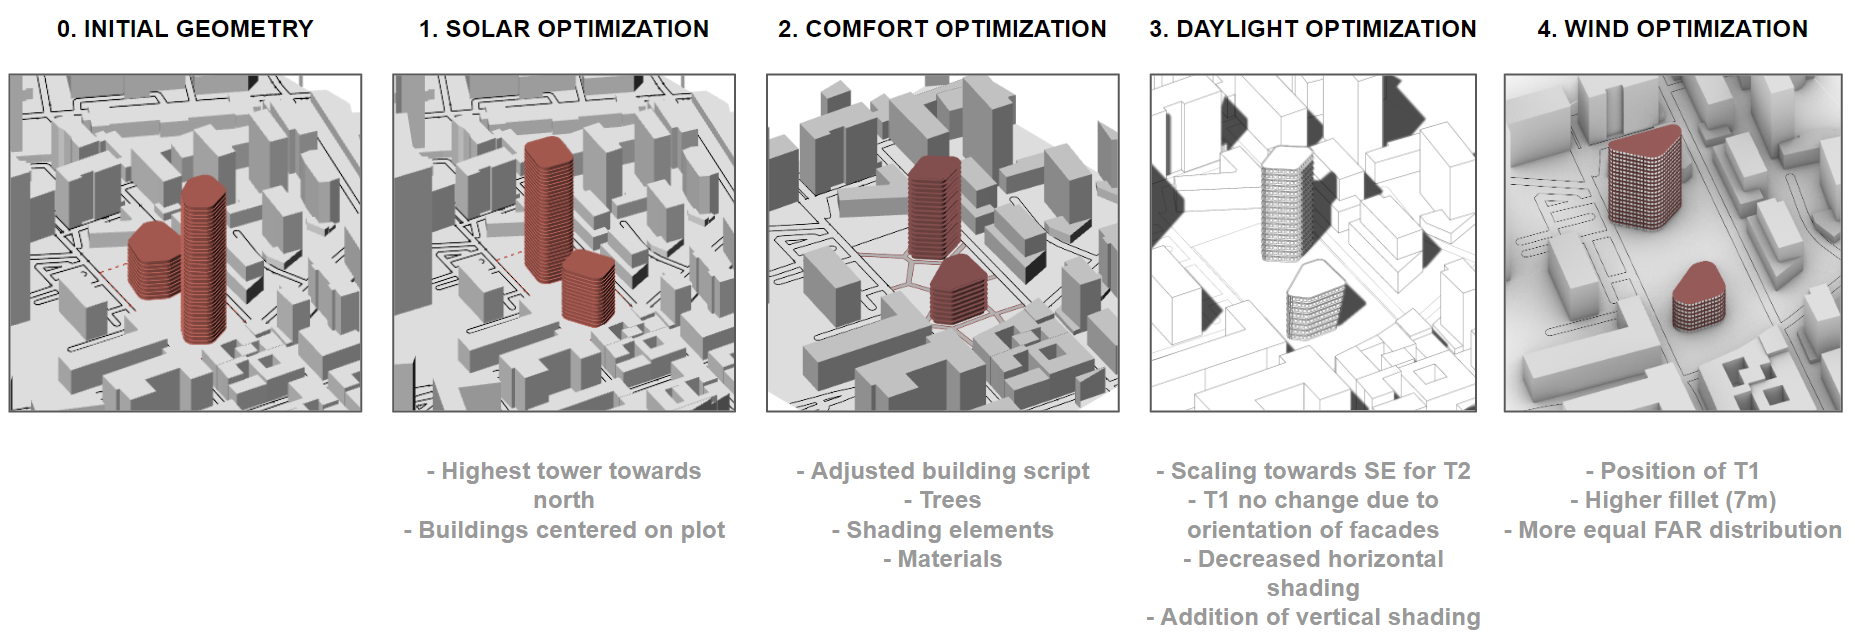
When we compare the results of the different optimizations, it becomes obvious that there is not a single solution that is optimal for all objectives. Since the objectives are contradictory, trade-offs should be made. A more holistic approach to the optimization process is therefore required.
OVERALL CONCLUSIONS & FURTHER DEVELOPMENT
- Building optimization strategies effects are more noticeable in summer than winter
- Wind plays a little role in the microclimatic effects in Milan
- Doing analysis consecutively requires review previous results
- Multi-objective or cross-optimization might be considered, leading to a more iterative process but also a more holistic result

