
abstract
This thesis presents an experimental approach that enables architects to automatically generate and rank multiple building layouts based on specific metrics, focusing on the Polykatoikia—the prevalent multi-story residential building type in Greece.
By applying graph theory, architectural spaces are conceptualized as nodes, and their relationships—such as adjacency—are represented as edges. The graph offers a flexible and computationally efficient means of analyzing complex architectural layouts. Each layout permutation is evaluated using metrics like construction time, daylight, and other relevant factors.
The developed tool assists architects in rapidly gaining a comprehensive understanding of potential layouts by incorporating critical parameters such as daylight into the early stages of design. This integration enhances decision-making in the design process, leading to more informed and efficient architectural solutions.
introduction
Throughout the advancement of Computer-Aided Architectural Design (CAAD), architects, designers, and researchers have been exploring ways to generate spatial layouts without direct human intervention. Space generation stands as one of the most crucial branches of CAAD.
As noted in An interactive approach for Generating Spatial Architecture Layout based on graph theory ((1), Xie, X., & Ding, W. (2023)), space generation involves finding feasible locations and dimensions for a set of interconnected objects that fulfill all design requirements while maximizing design quality according to specific preferences.
Challenges and Limitations of Existing Automated Spatial Layout Generation Methods
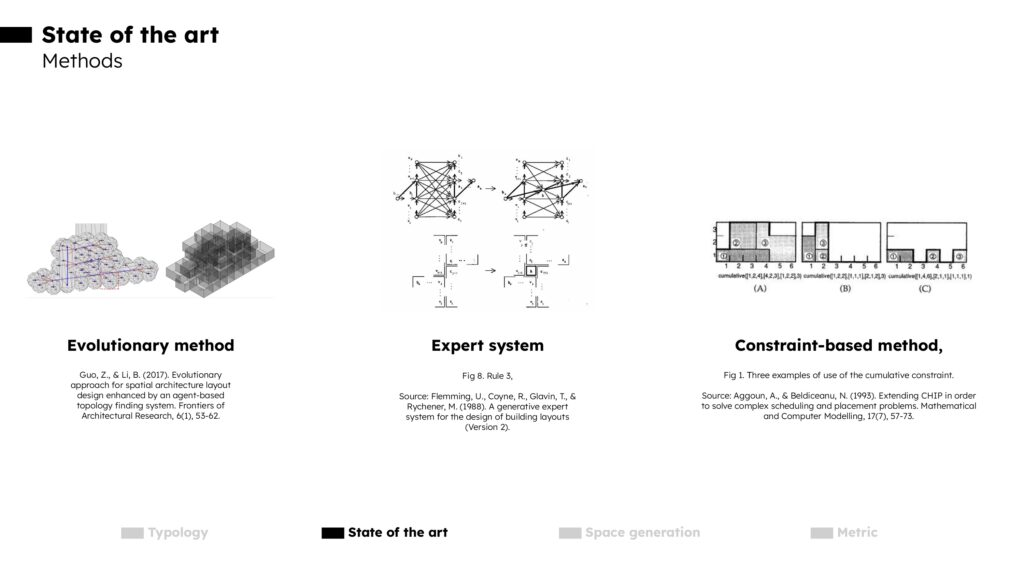
Several methods have been proposed, including evolutionary algorithms, expert systems, and constraint-based approaches.
Evolutionary methods aim to produce space layout topologies for architectural plans using evolutionary techniques ((2), Guo, Z., & Li, B. (2017) ).
An expert system is a computer program that emulates the decision-making ability of a human expert by using knowledge-based systems to simulate the judgment and behavior of specialists in a particular field ((3), Flemming, U., Coyne, R., Glavin, T., & Rychener, M. (1988)).
The constraint-based method generates space layouts based on user-defined constraints like topological relationships and dimensions ((4), Aggoun, A., & Beldiceanu, N. (1993)).
Despite the diversity of existing methods, the practical application of automated spatial layout generation in architectural design remains uncommon due to the limitations these methods may have. According to van Leusen ((5), van Leusen, M., 1994), architectural design is an “ill-defined” problem that requires willingness and additional design skills to reach the final result. Many factors in architectural design are complex and challenging to synthesize using computer systems. To tackle these issues, new methods have been developed.
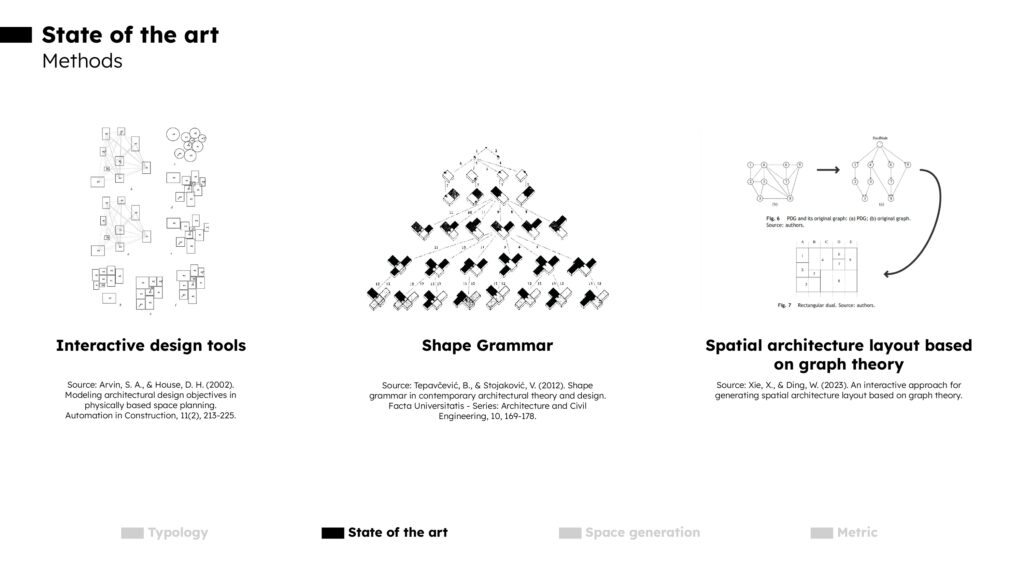
Interactive design tools aim to create software with interfaces that enable designers to make decisions throughout the generation process, integrating their expertise with the computational efficiency of computers ((6), Arvin, S. A., & House, D. H. (2002)).
Shape Grammar employs a vocabulary of design elements and applies sets of composition rules to these elements ((7), Tepavčević, B., & Stojaković, V. (2012)).
However, even these methods encounter challenges that limit their use in real projects. For example, there is no specific target in the generation process; thus, the application of rules is based on manual or even random choices ((8), Yue, K., Krishnamurti, R., 2013).
Space generation with graph theory
Space generation utilizing graph theory involves constructing a conceptual model of an architectural layout using nodes and edges.
In this model, each node represents a space within the floor plan—such as a bedroom, living room, corridor, or kitchen—and each edge represents the adjacency relationships between these spaces.
This data-driven approach allows each element (nodes and edges) to hold attributes containing information like the area of the space, hierarchy, and location. By transforming the floor plan into a dynamic, data-driven diagram rather than a fixed form, this conceptual model enables dynamic modifications to the proposed floor plan based on specific requirements.

polykatoikia
Origins and Influences of Polykatoikia
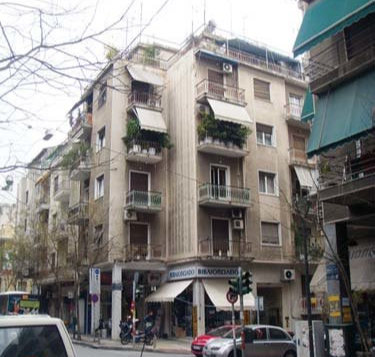
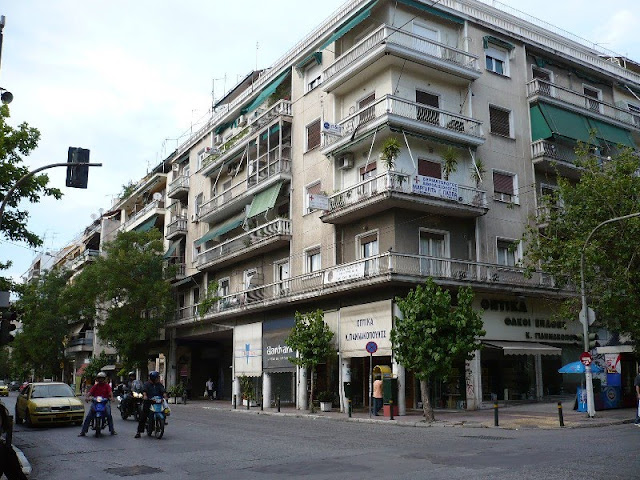
Polykatoikia refers to the typical multi-story apartment buildings found in Athens, characterized by their reinforced concrete frames, flat roofs, and brick walls. This typology is considered the cousin of Le Corbusier’s Dom-ino construction system.
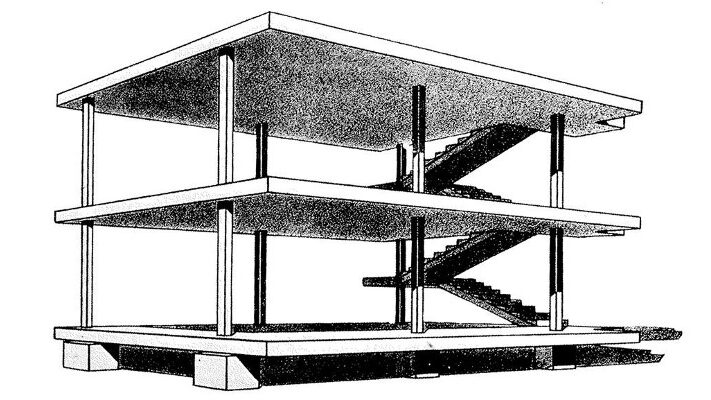
This construction system offers the possibility to construct rapidly and economically a reinforced concrete framework that is open to any infill and to any internal spatial interpretation.
Le Corbusier developed his famous Dom-ino prototype having in mind the urgent need for housing in the post-war reconstruction period. The simplicity of its construction allowed unskilled workers to work. As mentioned in the Domus ((9), Domus. (2012, October 31). From Dom-ino to Polykatoikia) article:
In Dom-ino, architecture is not simply a shelter, but in the words of Michel Foucault, it is a “dispositif”, an apparatus that puts to work and controls the most basic faculties of unskilled workers.
Evolution of Polykatoikia in Athens: From Bourgeois Apartments to Mass Housing (1930–1980)
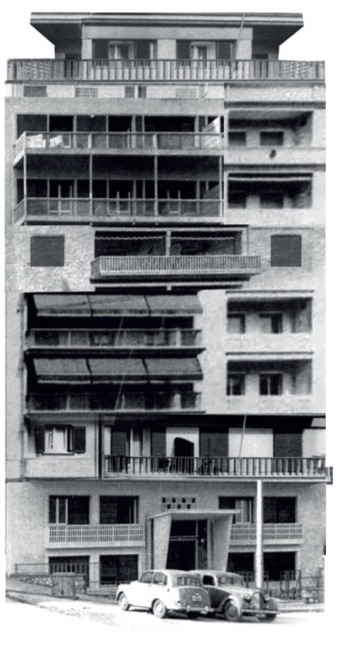
The first Polykatoikies was built around 1930 as a multistorey apartment building for the Athenian bourgeoisie, but the vast majority of those buildings were constructed from 1950 to 1980 in the post-war period — after WW II and the bloody civil war in Greece — where an urgent need of housing demanded a rapid and economic construction system.
Those buildings are different from the initial Poltykatoikia because they were mainly constructed rapidly and economically for the middle class and the labor class.
They often feature a central staircase surrounded by concrete slabs, where the apartments and expansive balconies are located. Commonly ranging from 4 to 7 floors, they exhibit a distinctive pyramidal section, with the top floors (penthouses) being narrower than the lower levels.
The Contemporary Relevance of Polykatoikia: Modern Challenges and Renovation Efforts in Athens
Athens is a gigantic exposition of this construction system where all the possible permutation of this system is constructed. The massive development of this building process produced a middle-class subject that was simultaneously owner, producer and consumer of space. Just before the economic crisis, Greece had 84.6 per cent of home ownership, ironically the second highest in Europe after Spain ((9), Domus. (2012, October 31). From Dom-ino to Polykatoikia).
After the economic crisis of 2008, Athens is in a development phase and is trying to attract large-scale projects. Multiple projects are currently under construction. The reform of the city is a priority of the Greek government. Attracting more investments and giving the citizens a better quality of life is also driven by the explosion of tourism, especially after the pandemic of covid-19. It is more than obvious that it wouldn’t be possible to demolish complete blocks of buildings in the center of a metropolis like Athens.
This has led to a new era of multiple renovations all around the city center, that envision a more sustainable, more ergonomic, and more functional living environment, which will respect and upgrade the historical heritage of Polykatoikia.

space generation
Layout generation using graph theory
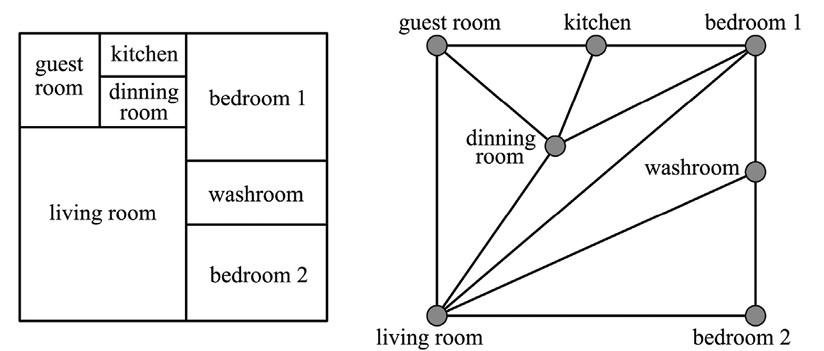
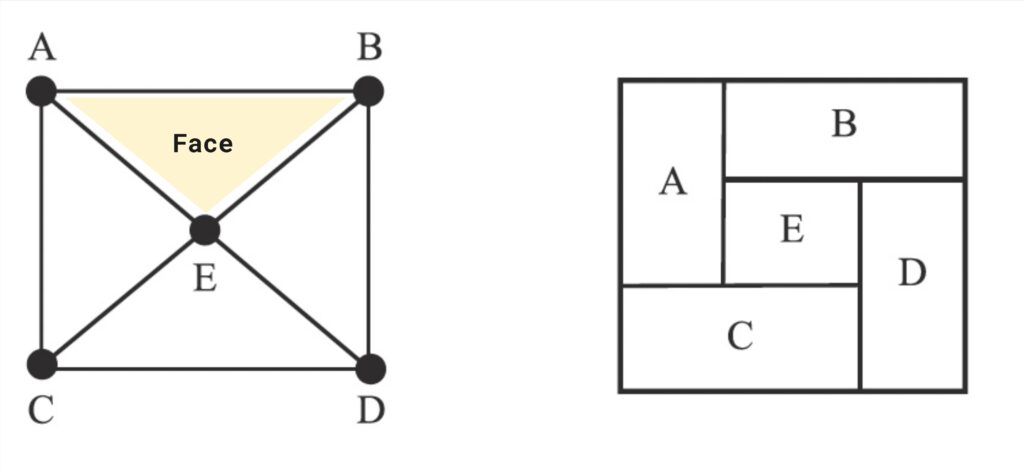
In graph theory, a graph consists of a set of vertices (or nodes) and a set of edges, where each edge connects two vertices. In the context of architectural design, we can model a floor plan as a graph where each vertex represents a rectangular room, and each edge represents a relationship between two rooms.
Since each vertex represents a space, it can hold attributes containing data about the room, such as the area, number of apertures (windows or doors), orientation, furniture, and any other useful information. Each edge represents the type of relationship between two spaces.
The graph created is a dual graph. This kind of graph is easily understood by architects because each vertex maintains the location of the room that it represents. Each floor plan has its own dual graph.
Most research focuses on rectangular spaces for floor plans because this simplifies the space generation process. Additionally, since the vast majority of architecture worldwide is based on an orthogonal grid, concentrating on rectangular layouts aligns with common architectural practices. This is also the case for the studied typology, the “Polykatoika”.
Xie, X., & Ding, W. (2023). An interactive approach for generating spatial architecture layout based on graph theory.
Properly Triangulated Planar (PTP)
All dual graphs can not be converted into a rectangular floor plan. Researchers have found that a graph needs to be considered a Properly Triangulated Planar graph, a PTP graph, to be possible to convert it.
- This graph follows the following conditions:
- Every face (region) (except the exterior) is a triangle;
- All internal vertices have degree >= 4;
- All cycles (path of edges and vertices in a graph that start and end from the same node) that are not faces (regions) have lengths >= 4
Properly Triangulated Planar graph
Xie, X., & Ding, W. (2023). An interactive approach for generating spatial architecture layout based on graph theory.
Graph Transformation
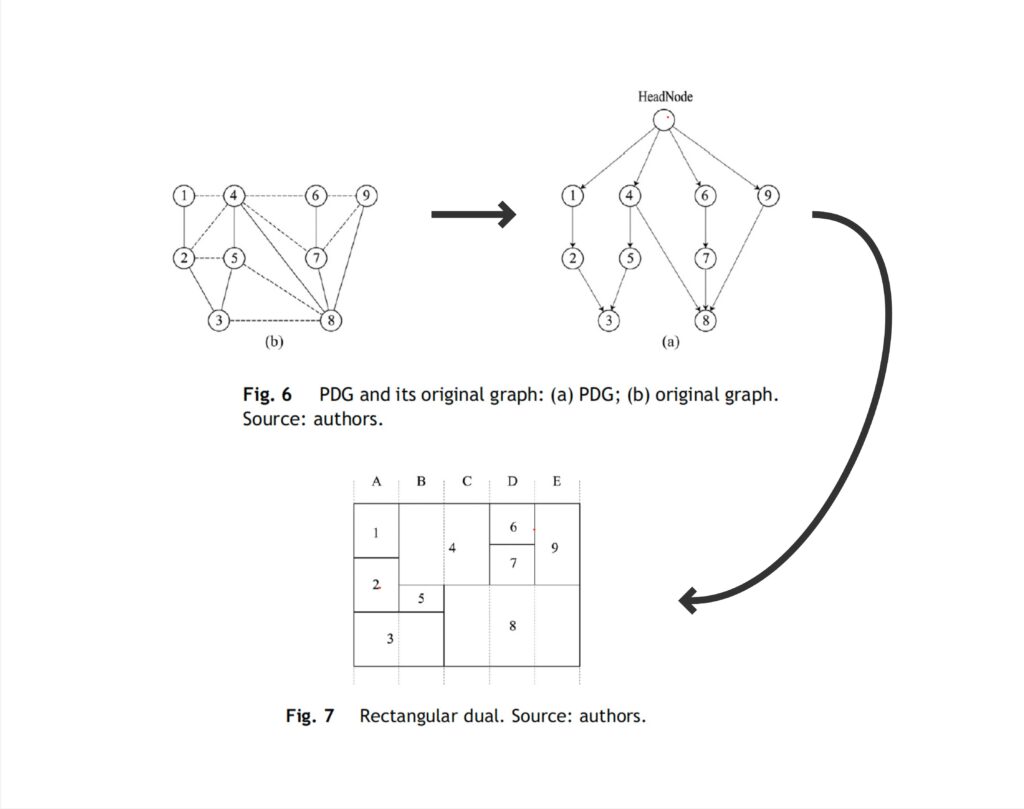
During time many methods have been proposed to convert a PTP graph into a floor plan layout. From Levin in 1964 ((10), Levin, P.H., 1964), who proposed a method using graph theory that aims to decide the optimum layout of a building, to Bhasker and Sahni in 1988 ((11), Bhasker, J., Sahni, S., 1988), who introduced the path digraph (PDG) and Jabi Wassim and Alymani Abdulrahman ((12), Jabi, W., Alymani, A., 2020), that went beyond rectangular layouts and address more flexible design constraints, all methods use graph transformation.
Graph transformation consists of creating a new graph from the initial one, the dual graph. Bhasker and Sahni proposed the path digraph (PDG) that consists first of adding a new node on the top of the graph, the HeadNode. From this node, all edges are directed from top to down and represent an “on top of” relation. Each path starts and is directed from the HeadNodes and ends with a node that does not have any outgoing edges. The result is a path digraph where each directed edge marks the “on top of” relation of each node (space).
To obtain the rectangular dual plan, this graph is then transformed into a set of columns, the number of columns is set by the number of nodes closest to the Headnode. Using the PDG, the rectangles are created by reading the graph in traversal.
Xie, X., & Ding, W. (2023). An interactive approach for generating spatial architecture layout based on graph theory.
Spatial graph
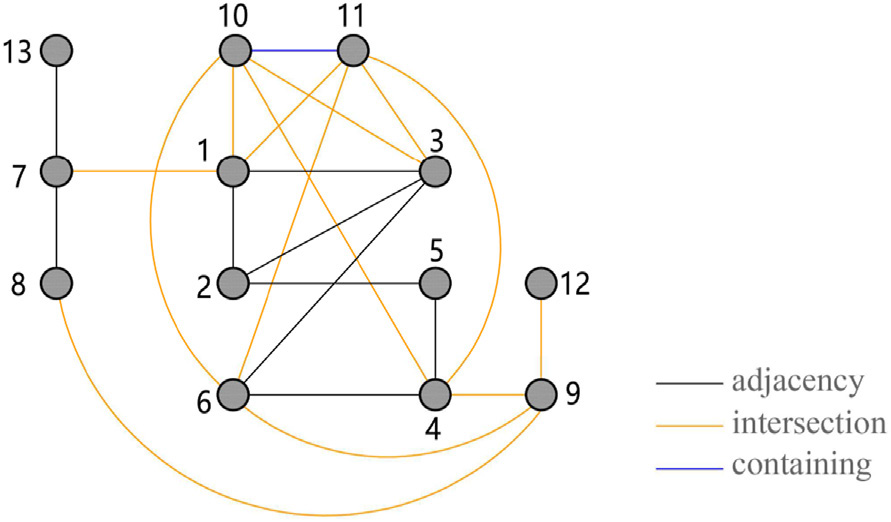
Another method introduced in 2023, by Xiaoye Xie and Wowo Ding, introduces the spatial graph where each edge represents the type of abjency of the spaces. There are three types of relationships that can exist between two connected spaces:
- Adjacency: Where two spaces touch one another.
- Intersection: Where two spaces overlap, creating a common area.
- Containment: Where one space contains the other.
This method generates three-dimensional layouts based on a given spatial graph. Each divided space is seen as a cube, called a spatial unit. The aim is to arrange correct relations according to relation requirements between spatial units while satisfying their geometry requirements (area, height, ratio, etc.) to the extent possible ((1), Xie, X., & Ding, W. (2023)).
Xie, X., & Ding, W. (2023). An interactive approach for generating spatial architecture layout based on graph theory.
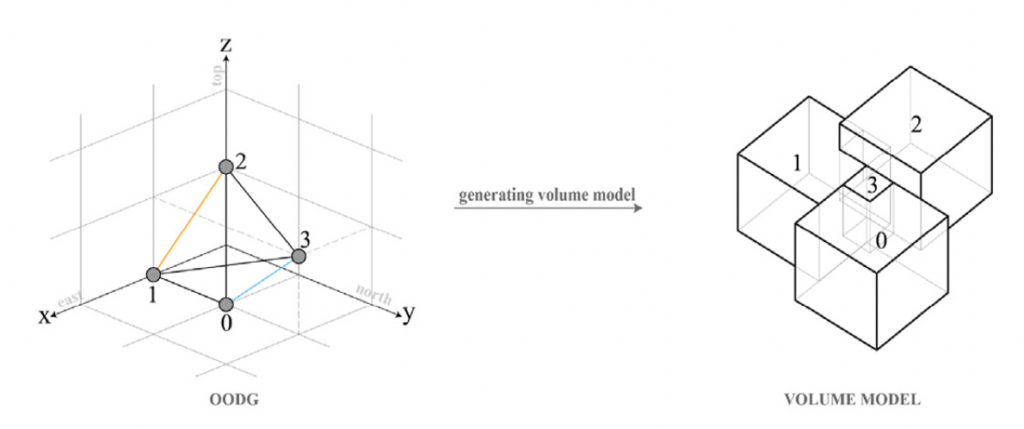
Orthogonal Orientation Digraph (OODG)
Similar to the method introduced in 1988 by Bhasker and Sahni, where they transformed an dual graph into a PDG graph, Xiaoye Xie and Wowo Ding transformed a spatial graph into an orthogonal orientation digraph (OODG). According to the author, an OODG is a three-dimensional directed graph, the edges represent six kinds of relations: “south”, “east”, “north”, “west”, “up” and “down”. Based on this graph they create a three-dimensional model where each space is a cube.
Xie, X., & Ding, W. (2023). An interactive approach for generating spatial architecture layout based on graph theory.
Redefining Space Creation of Polykatoikia
Considering the state-of-the-art, where most research focuses on rectangular floor plans, this thesis concentrates on the Polykatoikia typology. As mentioned earlier, the Polykatoikia is based on a rectangular frame of columns, which provides significant flexibility for interior layouts.
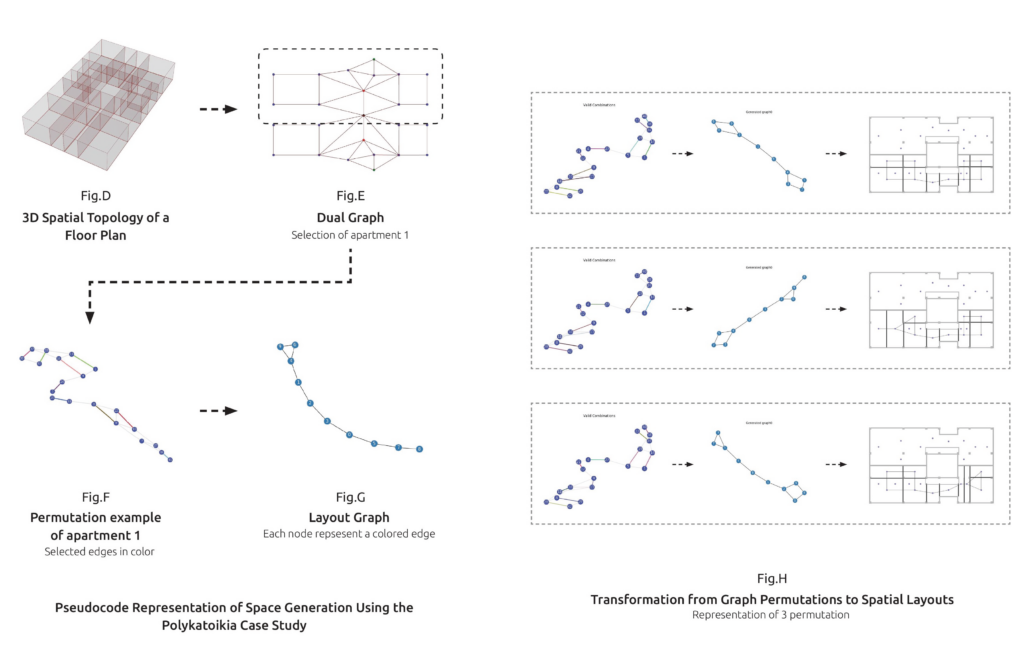
This process employs graph transformation techniques to propose all possible layouts for renovating the apartments of a Polykatoikia and ranks them according to specific metrics. Starting with a parametric model of the Polykatoikia, we create a dual graph for each floor. This dual graph is then transformed into a layout graph, representing the new layout configuration. The layout graph is subsequently used to generate the new three-dimensional spatial layout.
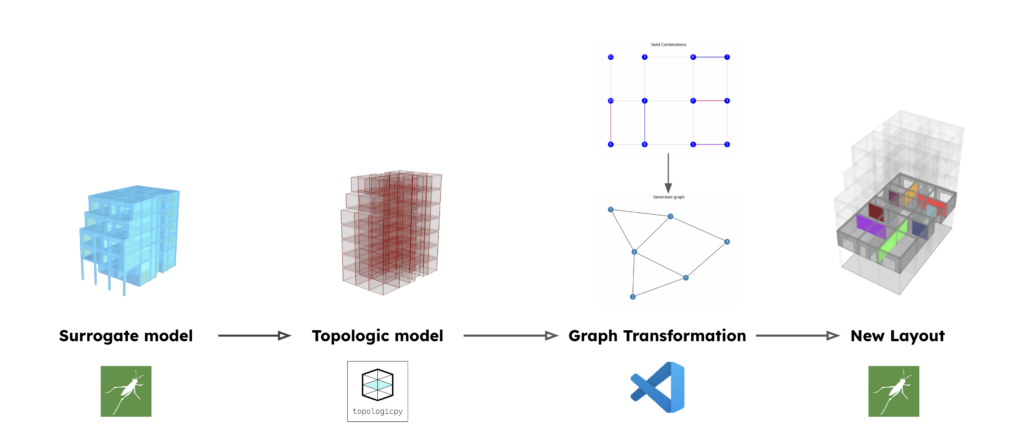
Space generation process
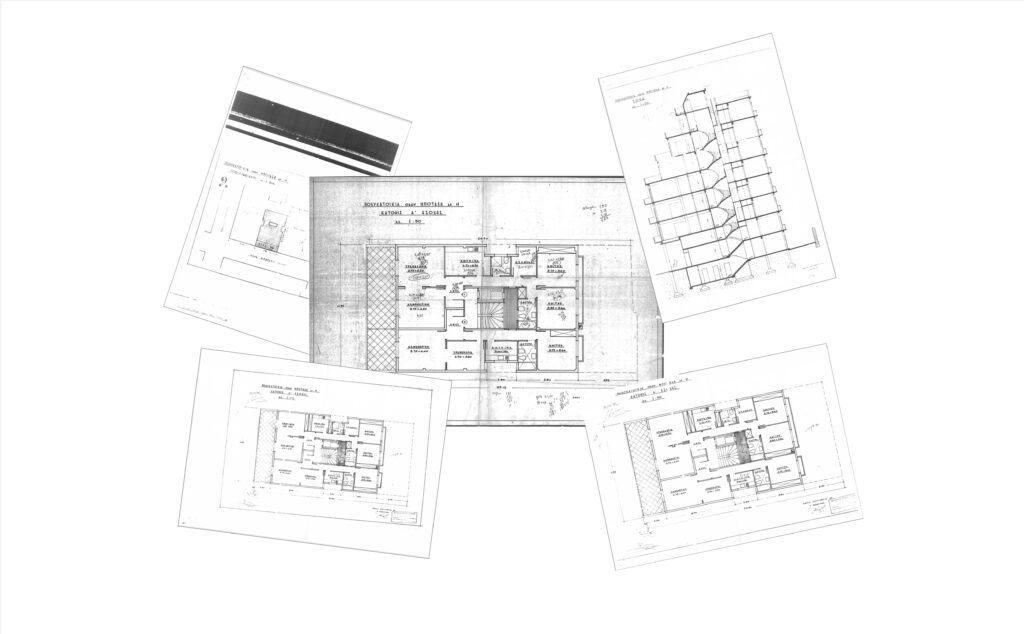
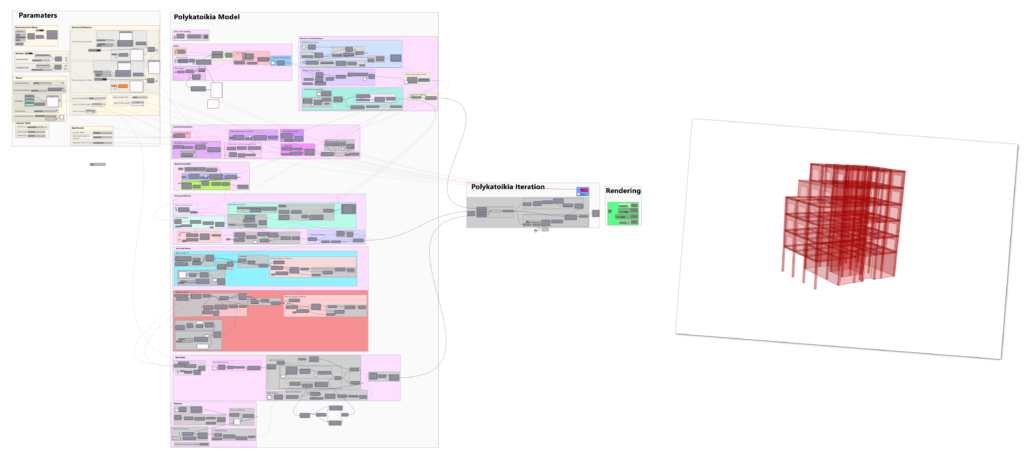
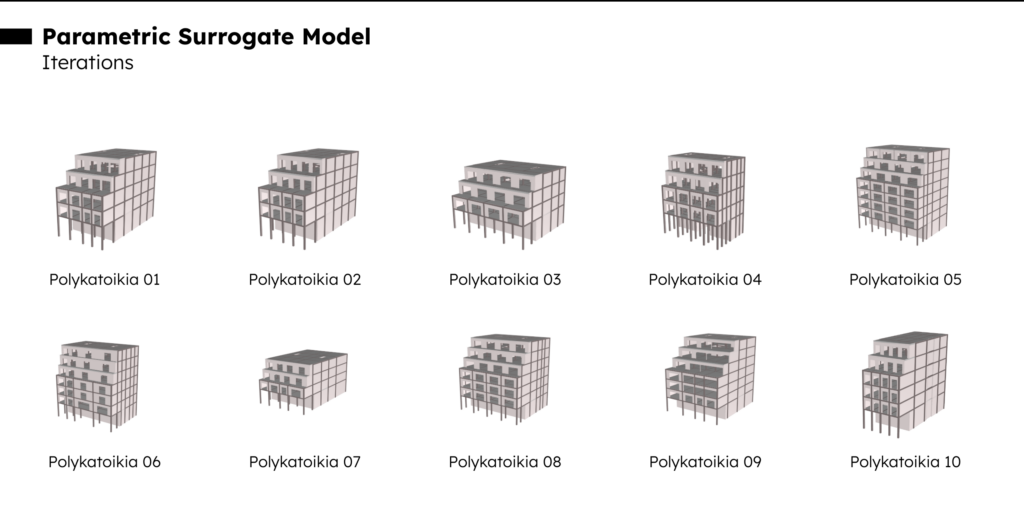
Surrogate model
To create a tool that can be applied to as many Polykatoikies as possible, it needs to adapt to the diverse variations of the Polykatoikia typology. Initially, we aimed to develop a dataset containing all the Polykatoikies built in Athens. However, this approach proved unsuccessful due to the lack of available drawings, the poor quality of existing ones, and the overall difficulty in accessing them. This challenge led us to build a parametric model based on a specific case study. Given that Polykatoikia follows a consistent set of architectural rules, a parametric approach is highly effective in generating various iterations of the typology. Specifically, this parametric model focuses on the Polykatoikies commonly found in the center of Athens, where windows are typically located only on the front and back façades.
Model parameters
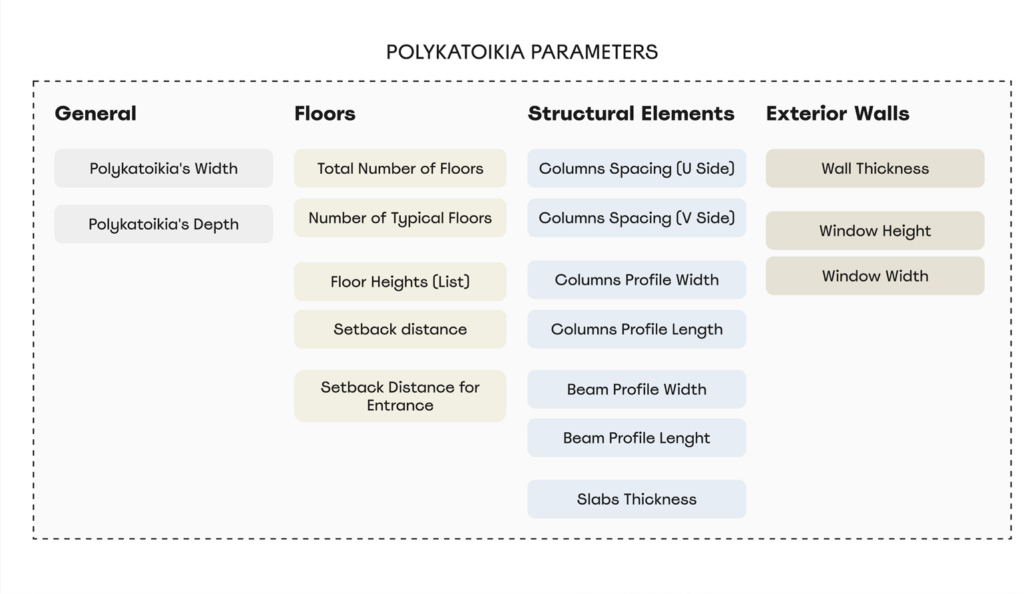
The parameters are divided into five distinct categories:
- General: Defines the overall dimensions of the Polykatoikia, including its width and depth.
- Floors: Allows the user to select the number of floors, their heights, and the setback distance of the upper floors, which is common in Polykatoikies to increase daylight access. The model then automatically generates the floors and calculates the maximum building height.
- Structural Elements: Sets the spacing for columns and beams. This is the most crucial category, as it’s used in the next step to convert the Polykatoikia into a dual graph.
- Exterior Walls: Determines the wall thickness and window placements on the exterior. These parameters are critical for daylight analysis within the Polykatoikia.
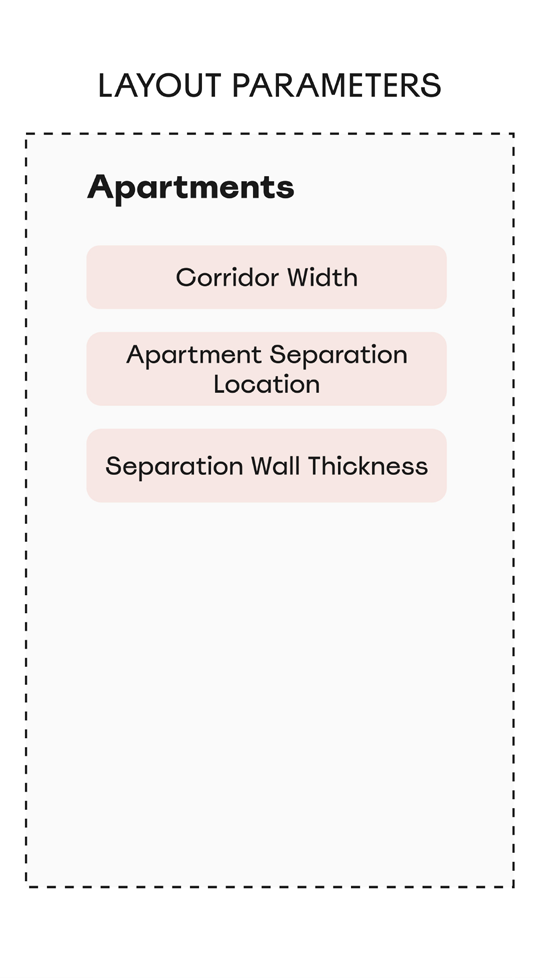
- Apartments: Allows users to define the corridor location and size, as well as the number and size of the apartments on each floor.
The parameters are further classified into two major categories:
Polykatoikia Parameters: These are set once at the beginning of the process and remain fixed throughout. This category defines the overall structure of the Polykatoikia. Here, the user also determines key features such as the location of the “akalyptos” (uncovered space), the staircase, the number of apartments per floor, and the corridor layout.
Layout Parameters: These are used in the next step to generate possible layouts for each floor, allowing for flexibility in internal configurations.
Topologic Model
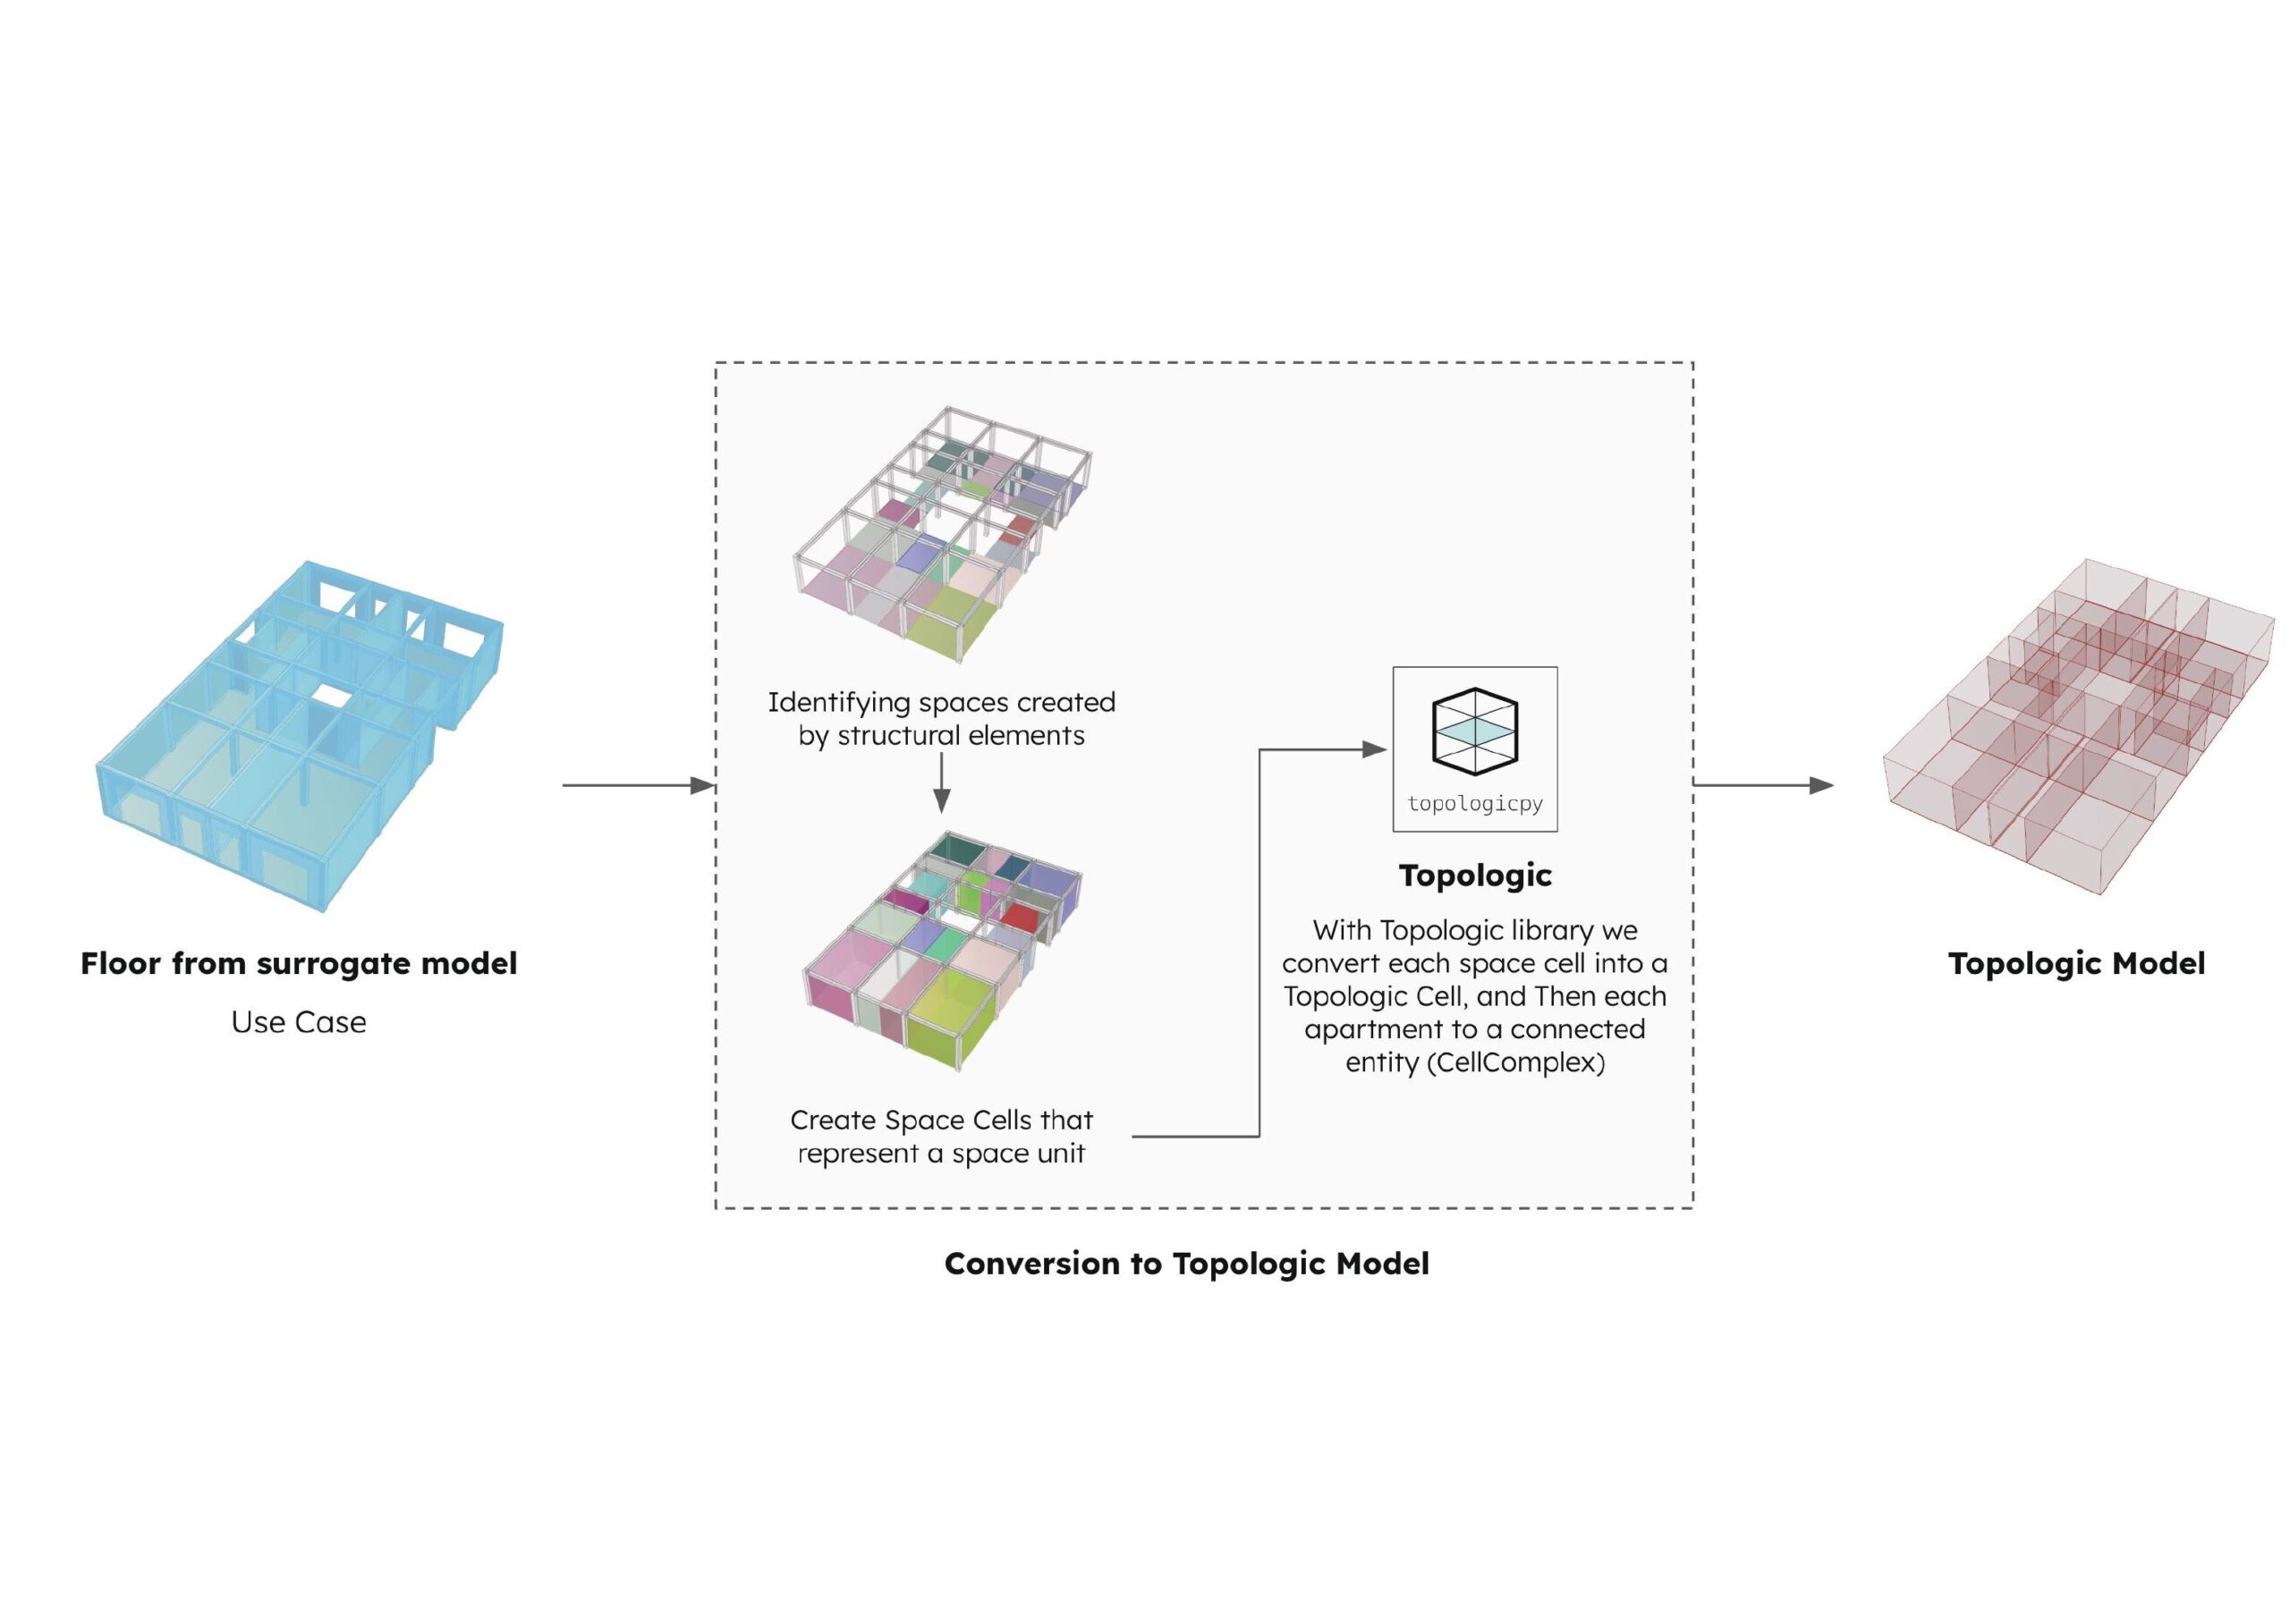
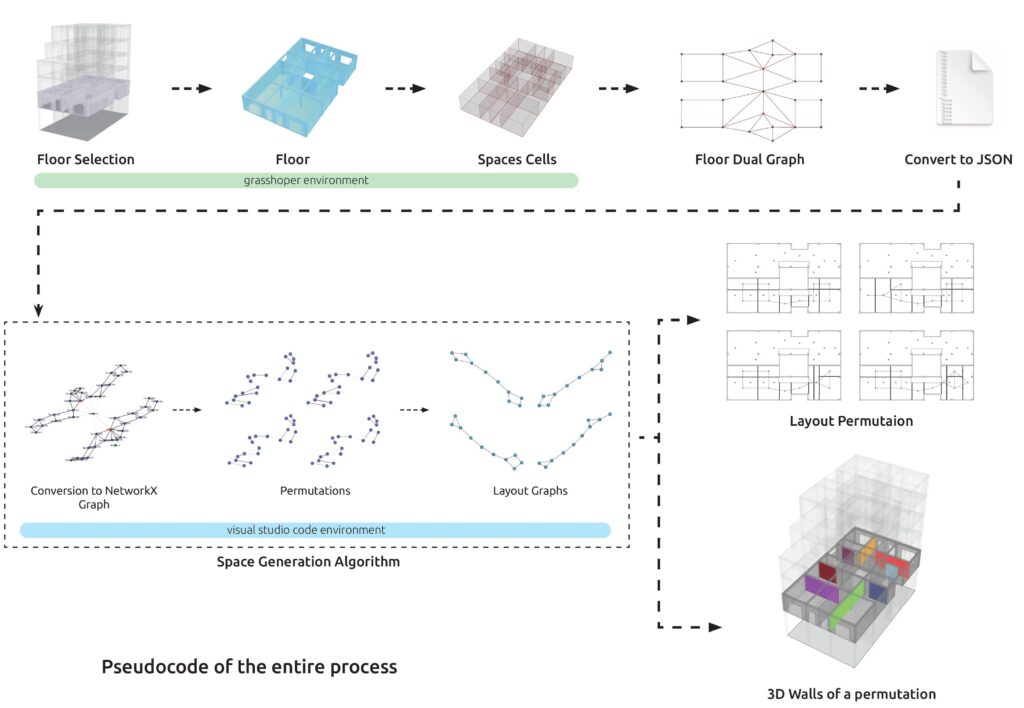
In this thesis, we use a parametric model to recreate the case study of a Polykatoikia. Once the model is generated, the next step is to convert it into a dual graph. For this, we utilized the TopologicPy API (Jabi, W (2024)) library, developed by Professor Jabi Wassim and his team. TopologicPy provides tools for creating, manipulating, and analyzing topological structures. Specifically, it allows us to convert a set of adjacent orthogonal geometries (such as cubes) into a dual graph, where each cube represents a vertex, and the edges represent the relationships between neighboring cubes.
In our case, we represent each floor of the Polykatoikia as a set of cubes. Each cube corresponds to the space between columns. In the previous step, by adjusting the column and beam spacing, the size and shape of these cubes change accordingly.
These cubes are referred to as Space Cells. In the Apartments parameters category, the Apartment Separation Location parameter determines how many groups of Space Cells (referred to as CellComplexes in TopologicPy) each apartment contains.
Once the model is prepared, we create the dual graph for each apartment.
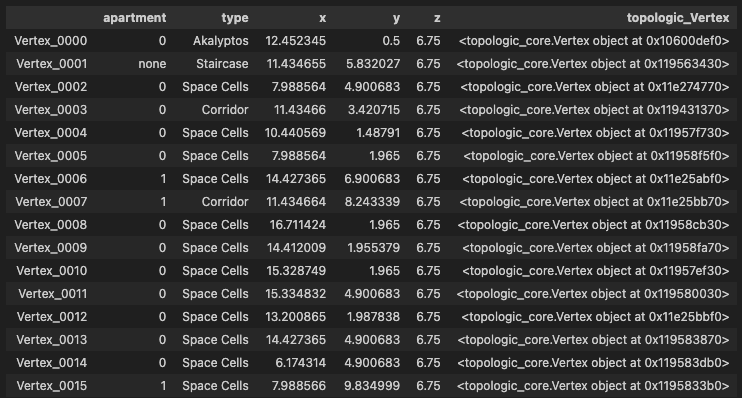
Each vertex represents a space within the apartment and is assigned several attributes that will be used in the next phase, the space generation algorithm.
The attributes assigned to each vertex are as follows:
- apartment: Indicates which apartment the vertex belongs to on the given floor.
- type: Defines the type of space the vertex represents. There are four possible types: space cell: Represents spaces used for layout generation.
- akalyptos: Refers to the uncovered space, not involved in the algorithm.
- staircase: A fixed space, also excluded from the layout generation process.
- corridor: Defines the predetermined corridor space within the apartment.
- x, y, and z: The 3D coordinates of the vertex in the spatial layout.
- topologic_Vertex: The vertex created with TopologicPy
This structured approach allows us to efficiently model and analyze Polykatoikies by generating dual graphs that capture the relationships between spatial elements, facilitating the next stages of layout optimization and space generation.
Space Generation Algorithm
The dual graph is first exported as a JSON file to be used in the space generation algorithm. This process involves identifying all possible combinations of edges within the dual graph, ensuring that no node is repeated across any combination. Additionally, the algorithm checks the type of nodes during the selection process. In the current version, only space cells are considered, while other types are excluded. In future versions, users will have control over the node types to include. These combinations are then converted into a new graph, called the layout graph, which represents the new spatial layout.

Each dual graph can have multiple valid combinations. For example, the dual graph in Fig. B can generate six edges per combination, ensuring no node is repeated. In the specific combination shown in Fig. C (p.49), each selected edge is converted into a node in the layout graph.
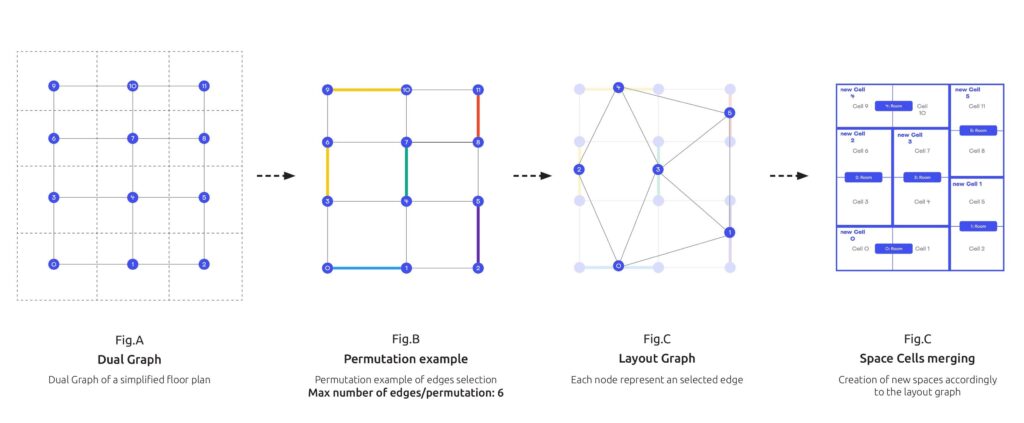
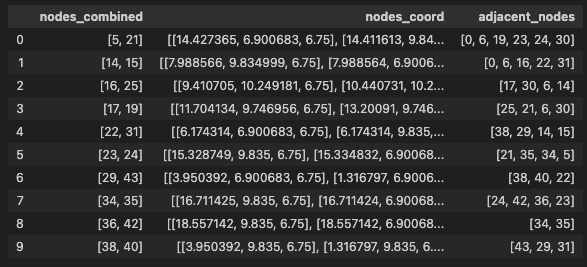
Each node in the layout graph represents a selected edge from the original graph and is assigned three attributes, which are essential for generating the final layout in Grasshopper:
- nodes_combined: A list of indices representing the nodes of the selected edges.
- nodes_coord: A list of [x, y, z] coordinates corresponding to the points in the nodes_combined list.
- adjacent_nodes: A list of unique neighboring nodes from the initial graph, excluding the nodes from nodes_combined.
To create edges in the layout graph, the adjacent_nodes attribute is used. For example, in Fig.C (p.48), node 4 of the layout graph represents the edge between nodes 9 and 10 from the initial graph. Node 9 has three neighboring nodes (6, 7, 10) and node 10 has three neighboring nodes (9, 7, 11) but since nodes 10 and 9 are neighbors, they are excluded. Resulting that Node 4 from the layout graph has three unique neighboring nodes (6, 7, 11).
Current Limitaions
In the current version, the dual graph must have an even number of nodes to ensure that all nodes can be selected. This limitation exists because each edge consists of two nodes. In future versions, the algorithm will be able to select individual nodes to create smaller spaces or the space cells could be divided to increase their size and ensure to have an even number of nodes.
3D Representation of the Layout Graph
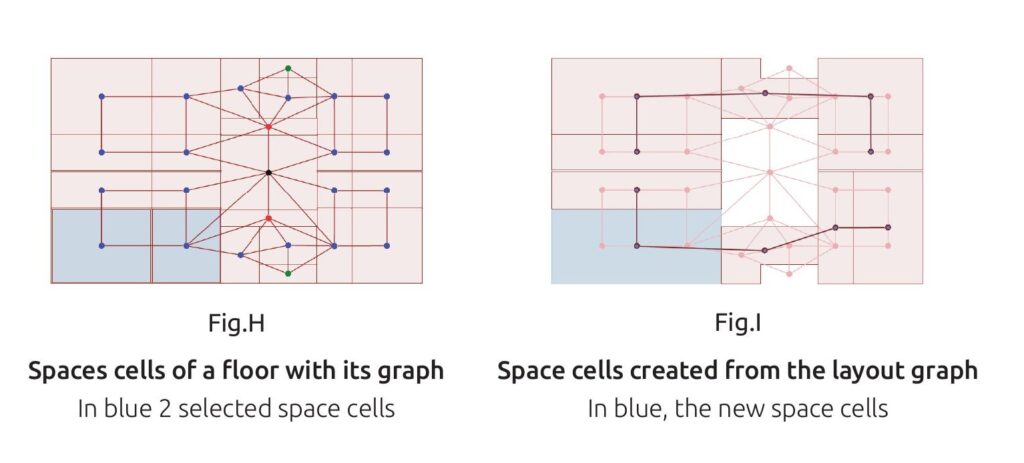
The layout graphs shown in Fig. G (p.50) represent one possible configuration of the first floor of the case study Polykatoikia. Since each layout graph retains data from the initial dual graph, every node index within the nodes_combined attribute corresponds to a space cell in the Topologic model. Using the layout graph, we identify the space cells that match the nodes_coord values, Fig.H (two per node in the layout graph) and apply boolean operations to merge them, Fig.I, creating larger space cells.
For visualization, we also select all adjacent faces of the newly combined space cells to generate the corresponding walls.
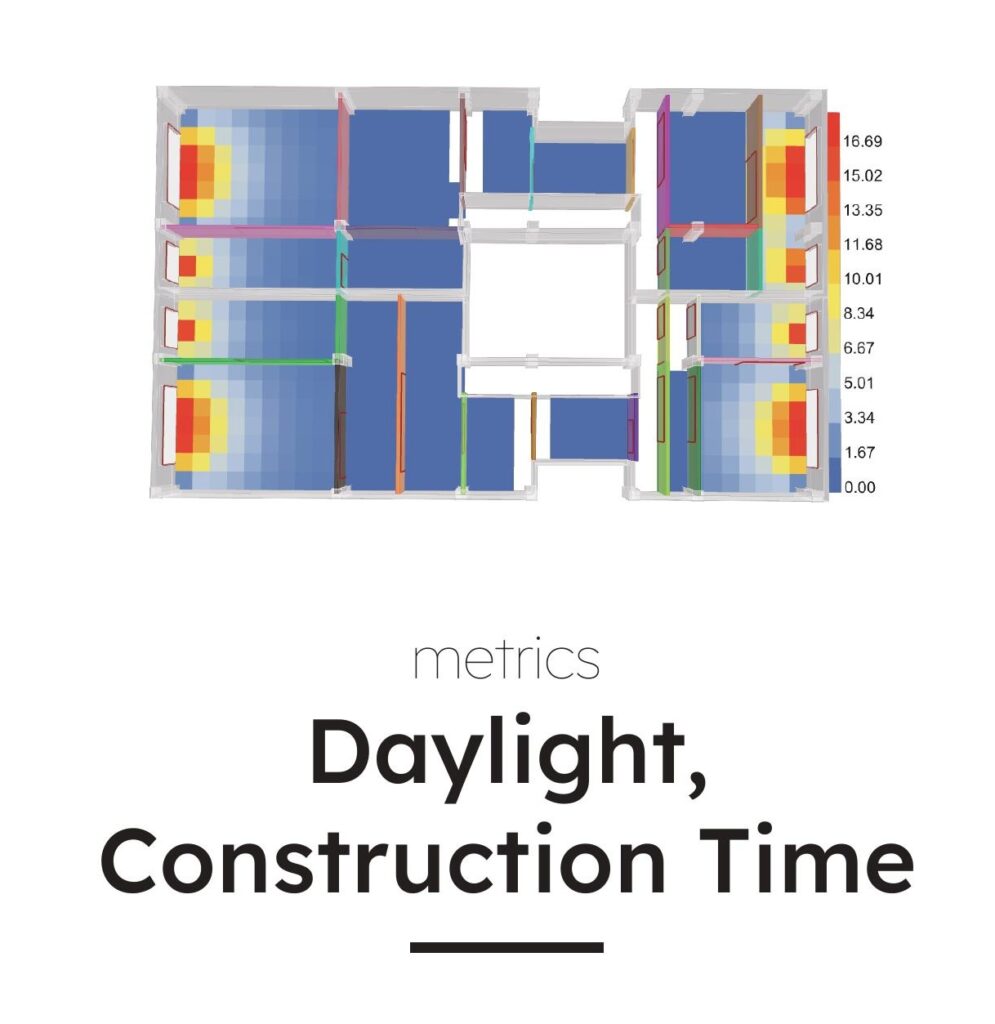
metrics
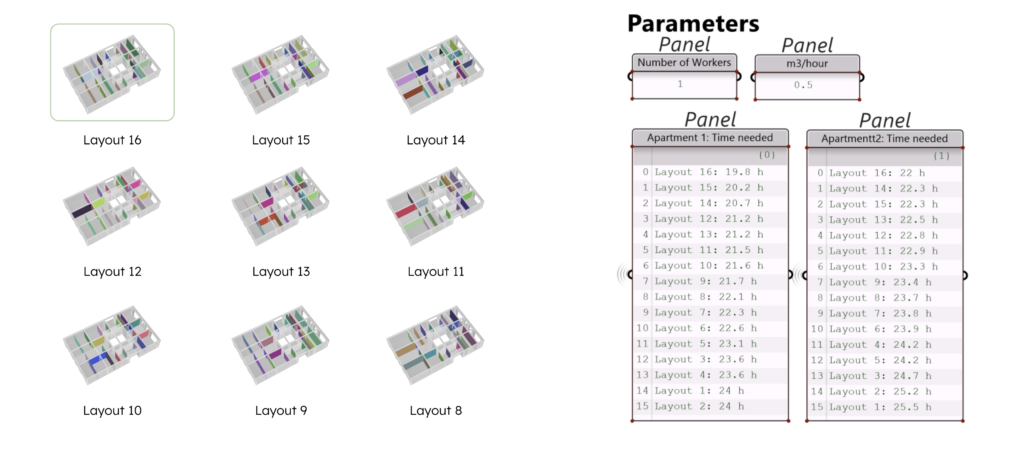
The layouts generated from this process can be analyzed and ranked based on specific metrics to propose the optimal permutation based on user preferences.
Time and Cost
A possible metric is the time required to construct each floor plan iteration. By choosing in the number of workers and the volume constructed per hour per worker, an estimate of the construction time can be obtained. This can further be used to estimate costs. By adding the cost per cubic meter, we can approximate the overall cost for each layout option.
Dayligth Analysis
Daylight availability is a crucial metric in architectural design. Using TopologicPy, energy simulations can be conducted to analyze the percentage of daylight received in each iteration. In our approach, we integrated the Topologic model with Ladybug Tools to calculate daylight factors effectively. The algorithm then ranks the iterations based on either the average daylight across spaces or the number of rooms that receive optimal daylight, providing a clear evaluation of daylight performance in the generated designs.
Additional metrics could be implemented to enhance the ranking process and provide a more refined output.
conclusion
This thesis presents an approach to automatic space generation and evaluation in architectural design, specifically applied to the Polykatoikia. By leveraging graph theory, we conceptualized architectural spaces as nodes and their relationships as edges, creating a flexible and computationally efficient model for analyzing complex layouts.
Our methodology begins by converting the initial floor plans of Polykatoikies, which are defined by the spaces formed between the structural columns, into dual graphs using the TopologicPy API. These graphs are then processed to generate all possible spatial configurations and design variations while ensuring that specific constraints were considered. Each layout was evaluated based on metrics such as construction time, cost, and daylight availability, providing quantitative data to inform design decisions.
The development of a parametric model allowed us to accommodate the diverse variations inherent in Polykatoikia structures. By adjusting parameters related to general dimensions, floors, structural elements, exterior walls, and apartment configurations, the model can generate a wide range of layouts suitable for different design requirements.
However, the current approach has limitations. The requirement for an even number of nodes in the dual graph restricts the range of possible layouts. These constraints limit the tool’s applicability in more complex or irregular architectural scenarios.
Future improvements aim to address these limitations by enabling the selection of individual nodes to create smaller or more varied spaces. Incorporating additional rules in the space generation algorithm will allow for the definition of specific space types like kitchens or bedrooms. Enhancing the algorithm to include interior openings, doors, and furniture layouts will increase the architectural quality and practicality of the generated designs.
Integrating more sophisticated metrics, such as detailed daylight analysis and energy simulations, will further refine the evaluation process. By embedding these metrics as attributes within the initial graphs, the tool can enforce design rules that meet specific performance criteria, such as ensuring adequate daylight in living spaces.
This thesis presents a method for automatic space generation and evaluation using graph theory, enabling architects to rapidly explore multiple informed design options. By integrating critical metrics into the early stages of design, architects can make decisions that balance aesthetic considerations with functional and environmental performance. The proposed tool serves as a valuable resource, facilitating a more efficient and informed design process. With continued refinement, there is significant potential to enhance architectural practice, particularly in the context of renovation projects and the pursuit of sustainable, user-centered design solutions.
references
- Xie, X., & Ding, W. (2023). An interactive approach for genering spatial architecture layout based on graph theory. Frontiers of Architectural Research
- Guo, Z., & Li, B. (2017). Evolutionary approach for spatial architecture layout design enhanced by an agent-based topology finding system. Frontiers of Architectural Research, 6(1), 53-62.
- Flemming, U., Coyne, R., Glavin, T., & Rychener, M. (1988). A generative expert system for the design of building layouts (Version 2).
- Aggoun, A., & Beldiceanu, N. (1993). Extending CHIP in order to solve complex scheduling and lacement problems. Mathematical and Computer Modelling, 17(7), 57-73.
- van Leusen, M., 1994. A System of Types in the Domain of Residential Buildings. Ph.D. diss.
- Arvin, S. A., & House, D. H. (2002). Modeling architectural design objectives in physically based space planning. Automation in Construction, 11(2), 213-225.
- Tepavčević, B., & Stojaković, V. (2012). Shape grammar in contemporary architectural theory and design. Facta Universitatis – Series: Architecture and Civil Engineering, 10, 169-178.
- Yue, K., Krishnamurti, R., 2013. Tractable shape grammars. Environ. Plann. Plann. Des. 40 (4), 576e594.
- Domus. (2012, October 31). From Dom-ino to Polykatoikia. Domus. https://www.domusweb.it/en/architecture/2012/10/31/from-dom-ino-to-em-polykatoikia-em-.html
- Levin, P.H., 1964. Use of graphs to decide the optimum layout of buildings. Architects’ J. 7, 809e815.
- Bhasker, J., Sahni, S., 1988. A linear algorithm to find a rectangular dual of a planar triangulated graph. Algorithmica 3 (2), 247e278.
- Jabi, W., Alymani, A., 2020. Graph Machine Learning Using 3D Topological Models.
- Jabi, W. (2024). topologicpy. pypi.org. http://doi.org/10.5281/zenodo.11555172 , https://topologicpy.readthedocs.io/en/latest/index.html
