
Challenge to solve
The potential for a building to adapt to various uses is primarily determined during the initial stages of the design process. This feature is rarely considered by architects yet has a significant impact of a building’s sustainability. The intention is to provide an early-stage tool that architects can use to test adaptability and cater to the rhythm of progress.

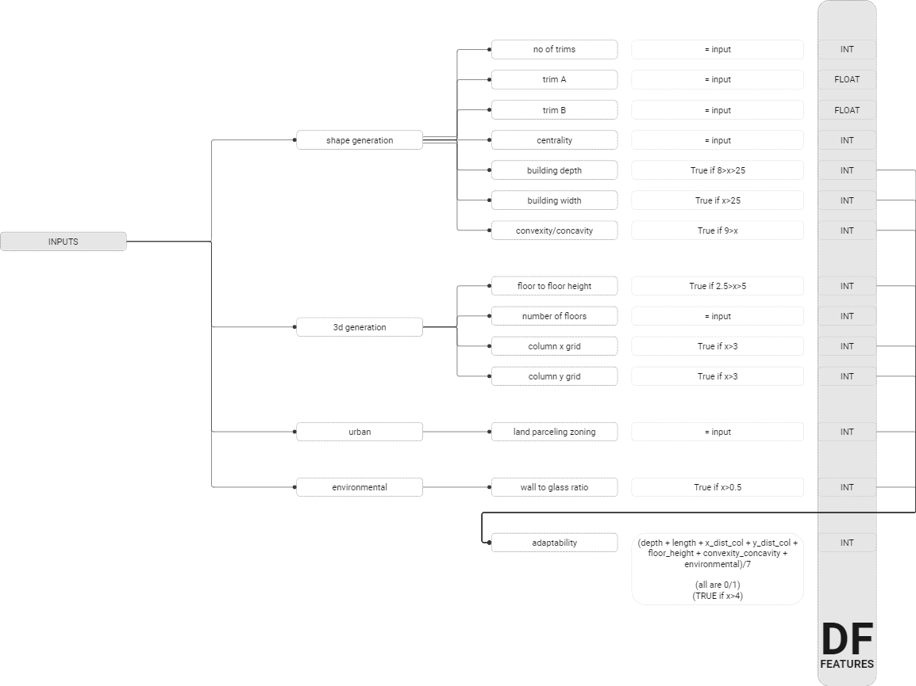
Pseudocode
The strategy involves generating the pseudocode for each of the crucial geometrical elements, a task accomplished based on accumulated domain knowledge. For instance, consider a building that has a depth spanning between eight and 18 meters. In such a scenario, the tool assigns a positive score to this feature, endorsing its design adaptability.
The process is replicated for an array of other geometrical aspects, ranging from the centrality of the structure, the width of the building, to its convexity, and more. Each of these parameters contributes to an overall understanding of the building’s potential for adaptability.
Data Generation
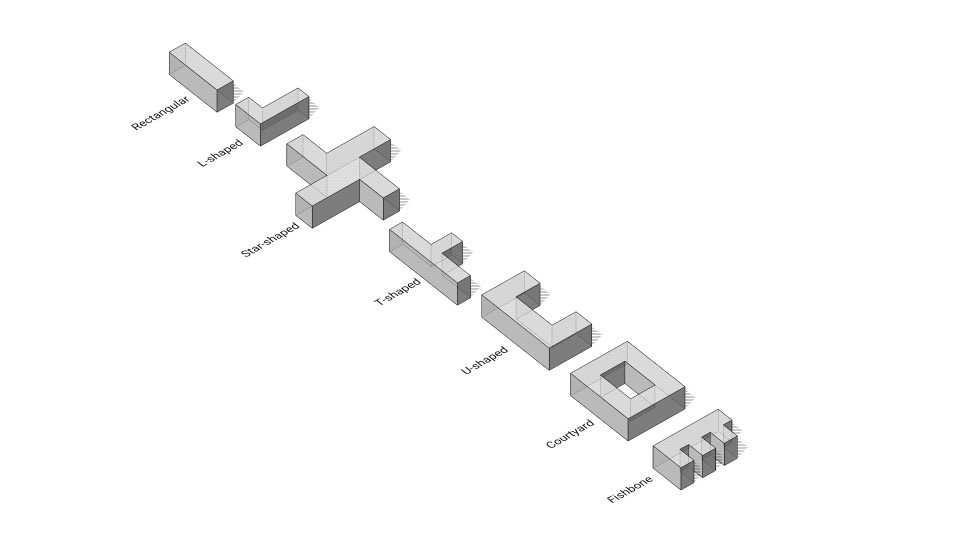
The first step of our data generation process involved adopting an innovative approach of examining various building shapes. This approach led us to devise a shape generation code in Grasshopper, a tool renowned for its ability to handle complex geometrical data. This code processes inputs such as the number of corners, depth, length, trim A, trim B, and centrality, using these variables to produce our data set.
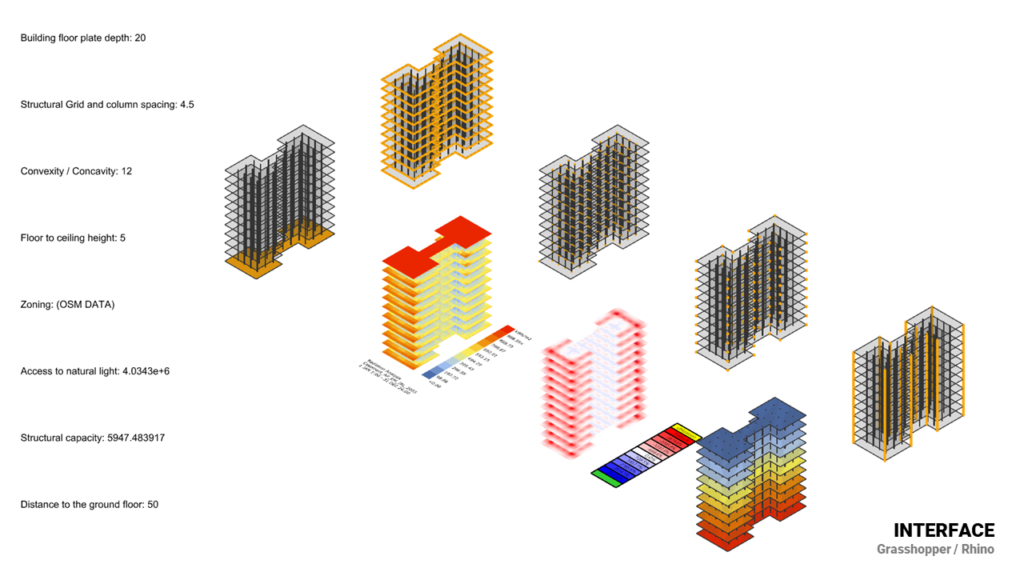
Once the shape of the building is formed, we incorporate a second set of inputs to foster spatiality. This includes parameters such as the distance between columns and the number of floors. Following this, we execute a performative analysis.
In the phase of generating conditions for our variables, factors such as the symmetry of openings (holes) and the variations in boundary conditions were contemplated.

The final step in our data generation process employed a kohonel map, an instrument that enabled us to fine-tune our dataset. This adjustment ensured an evenly distributed database encompassing all building types we originally aimed to include. This meticulously compiled database serves as the foundation for our design tool’s functionality, ensuring a comprehensive analysis of building adaptability.

Data Encoding
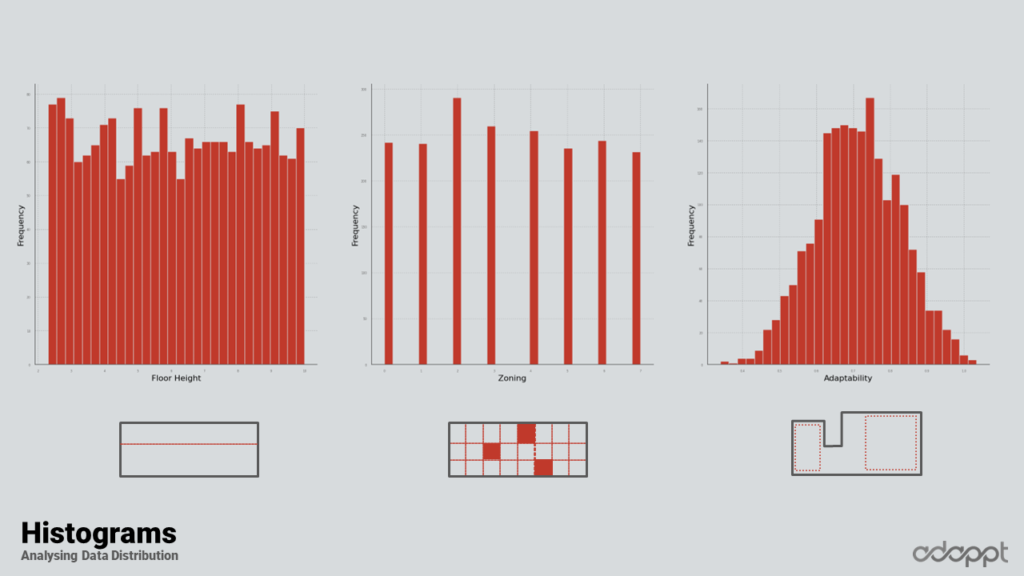
In the initial stage of the encoding process, non-binary and average data were utilized. The graphic beneath each column in the following visual depiction illustrates the related data.

Upon examining the histograms, it becomes evident that most data is distributed adequately. There were a few exceptions, however, notably concavity and convexity on the right side. Notwithstanding these exceptions, the data generally displayed a commendable spread. It’s worth noting that adaptability follows a pattern indicative of the random generation process employed.
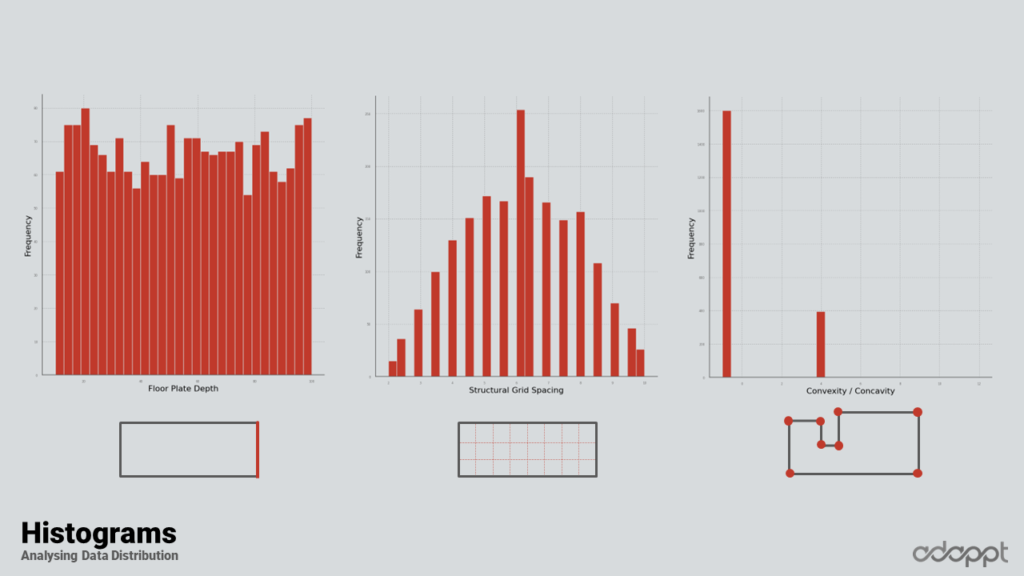
The scatter plots suggest an observable trend when the floor plate depth is plotted against adaptability.


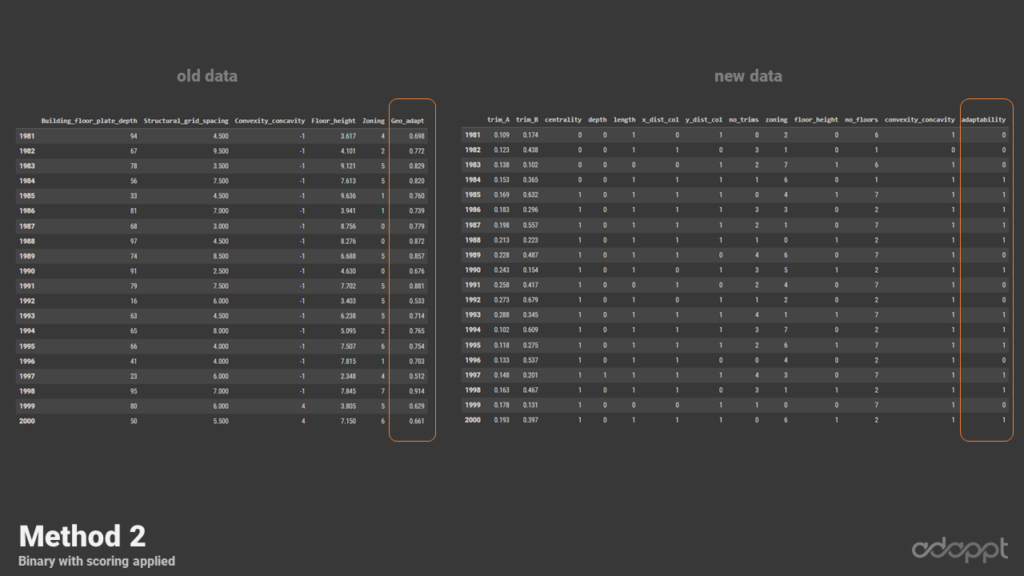
Moving forward, the team experimented with normalized and binary data, comparing the outcomes.
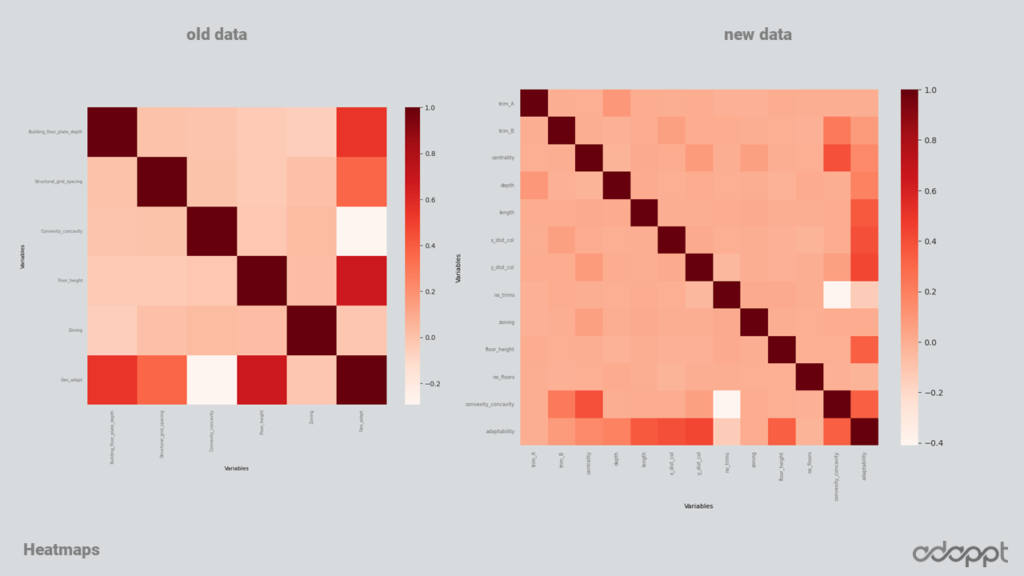
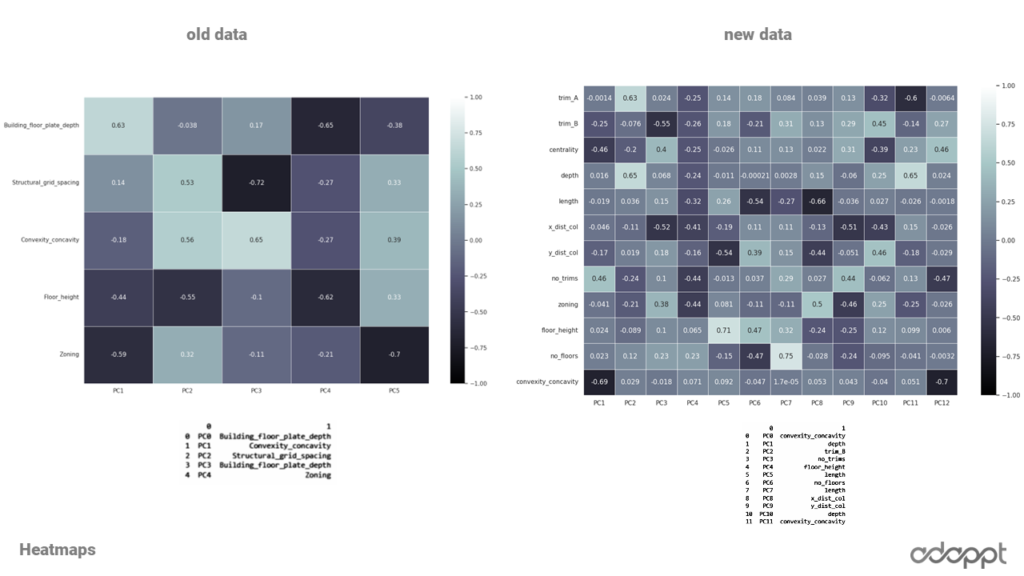
In the presented pair plot comparison, the results obtained from the old data are displayed on the left, with the results from the new data on the right. A closer look at these plots reveals that the new data comprises additional features, each showing a wider spread. A compelling find is the strong inverse relationship between convexity and adaptability in the old data. In contrast, the new data exhibited a direct relationship between the structural grid and adaptability. Furthermore, the new data delineated a more pronounced separation of principal components, visible in the right-hand side of the visual representation.


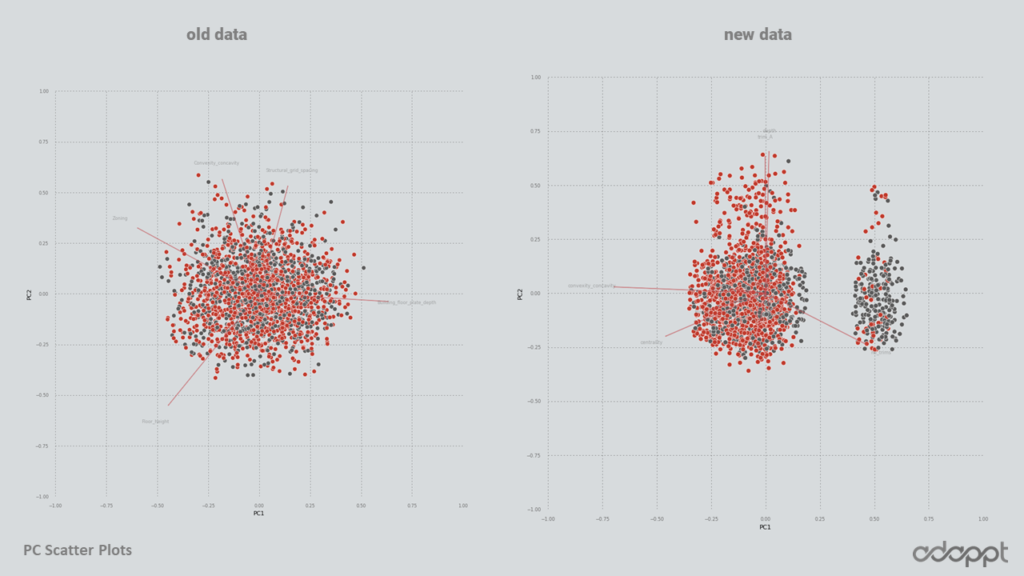
In the comparison of Principal Component Analysis (PCA) between the old and the new data, it’s intriguing that both data sets highlight Convexity and building depth as the highest principal components. This finding aligns seamlessly with our domain knowledge, further validating the effectiveness of our data generation and analysis processes.
Machine Learning
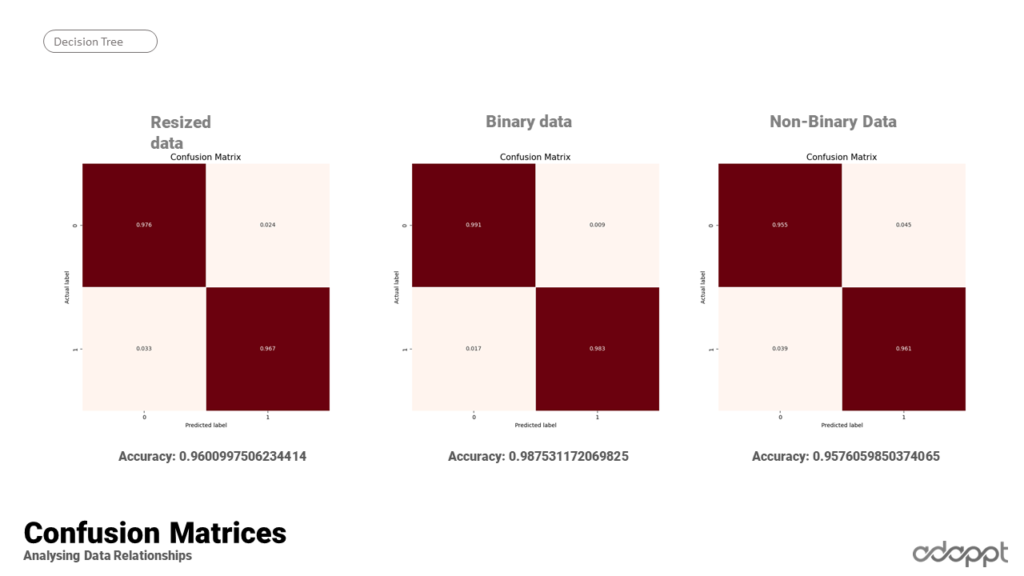
As part of the decision tree process, three databases are utilized, each possessing the same data but encoded differently. In the resized data set, all inputs are floating-point numbers falling between zero and one. Binary data, on the other hand, are integers – either zero or one – which encapsulate our conditions. The non-binary data, meanwhile, represents our raw data.
A common trend observed across these different encoding schemes is that irrespective of how the data is encoded, the most important variables within the first 50% remain consistent.

The conclusion drawn from this observation is that the binary data stands out as the most encoded because it’s the one onto which decisions are imposed. It recorded the highest accuracy value, indicating a direct correlation with our initial decisions.
Model Generation
In the final stage of model generation, the Hops tool was used to facilitate real-time predictions while designing in Grasshopper. As the design process unfolds, the model provides immediate adaptability feedback. If a design is deemed adaptable, it is highlighted in green; otherwise, it is indicated as non-adaptable in red. This real-time adaptability feedback mechanism allows for a dynamic and responsive design process.

