Project Concept
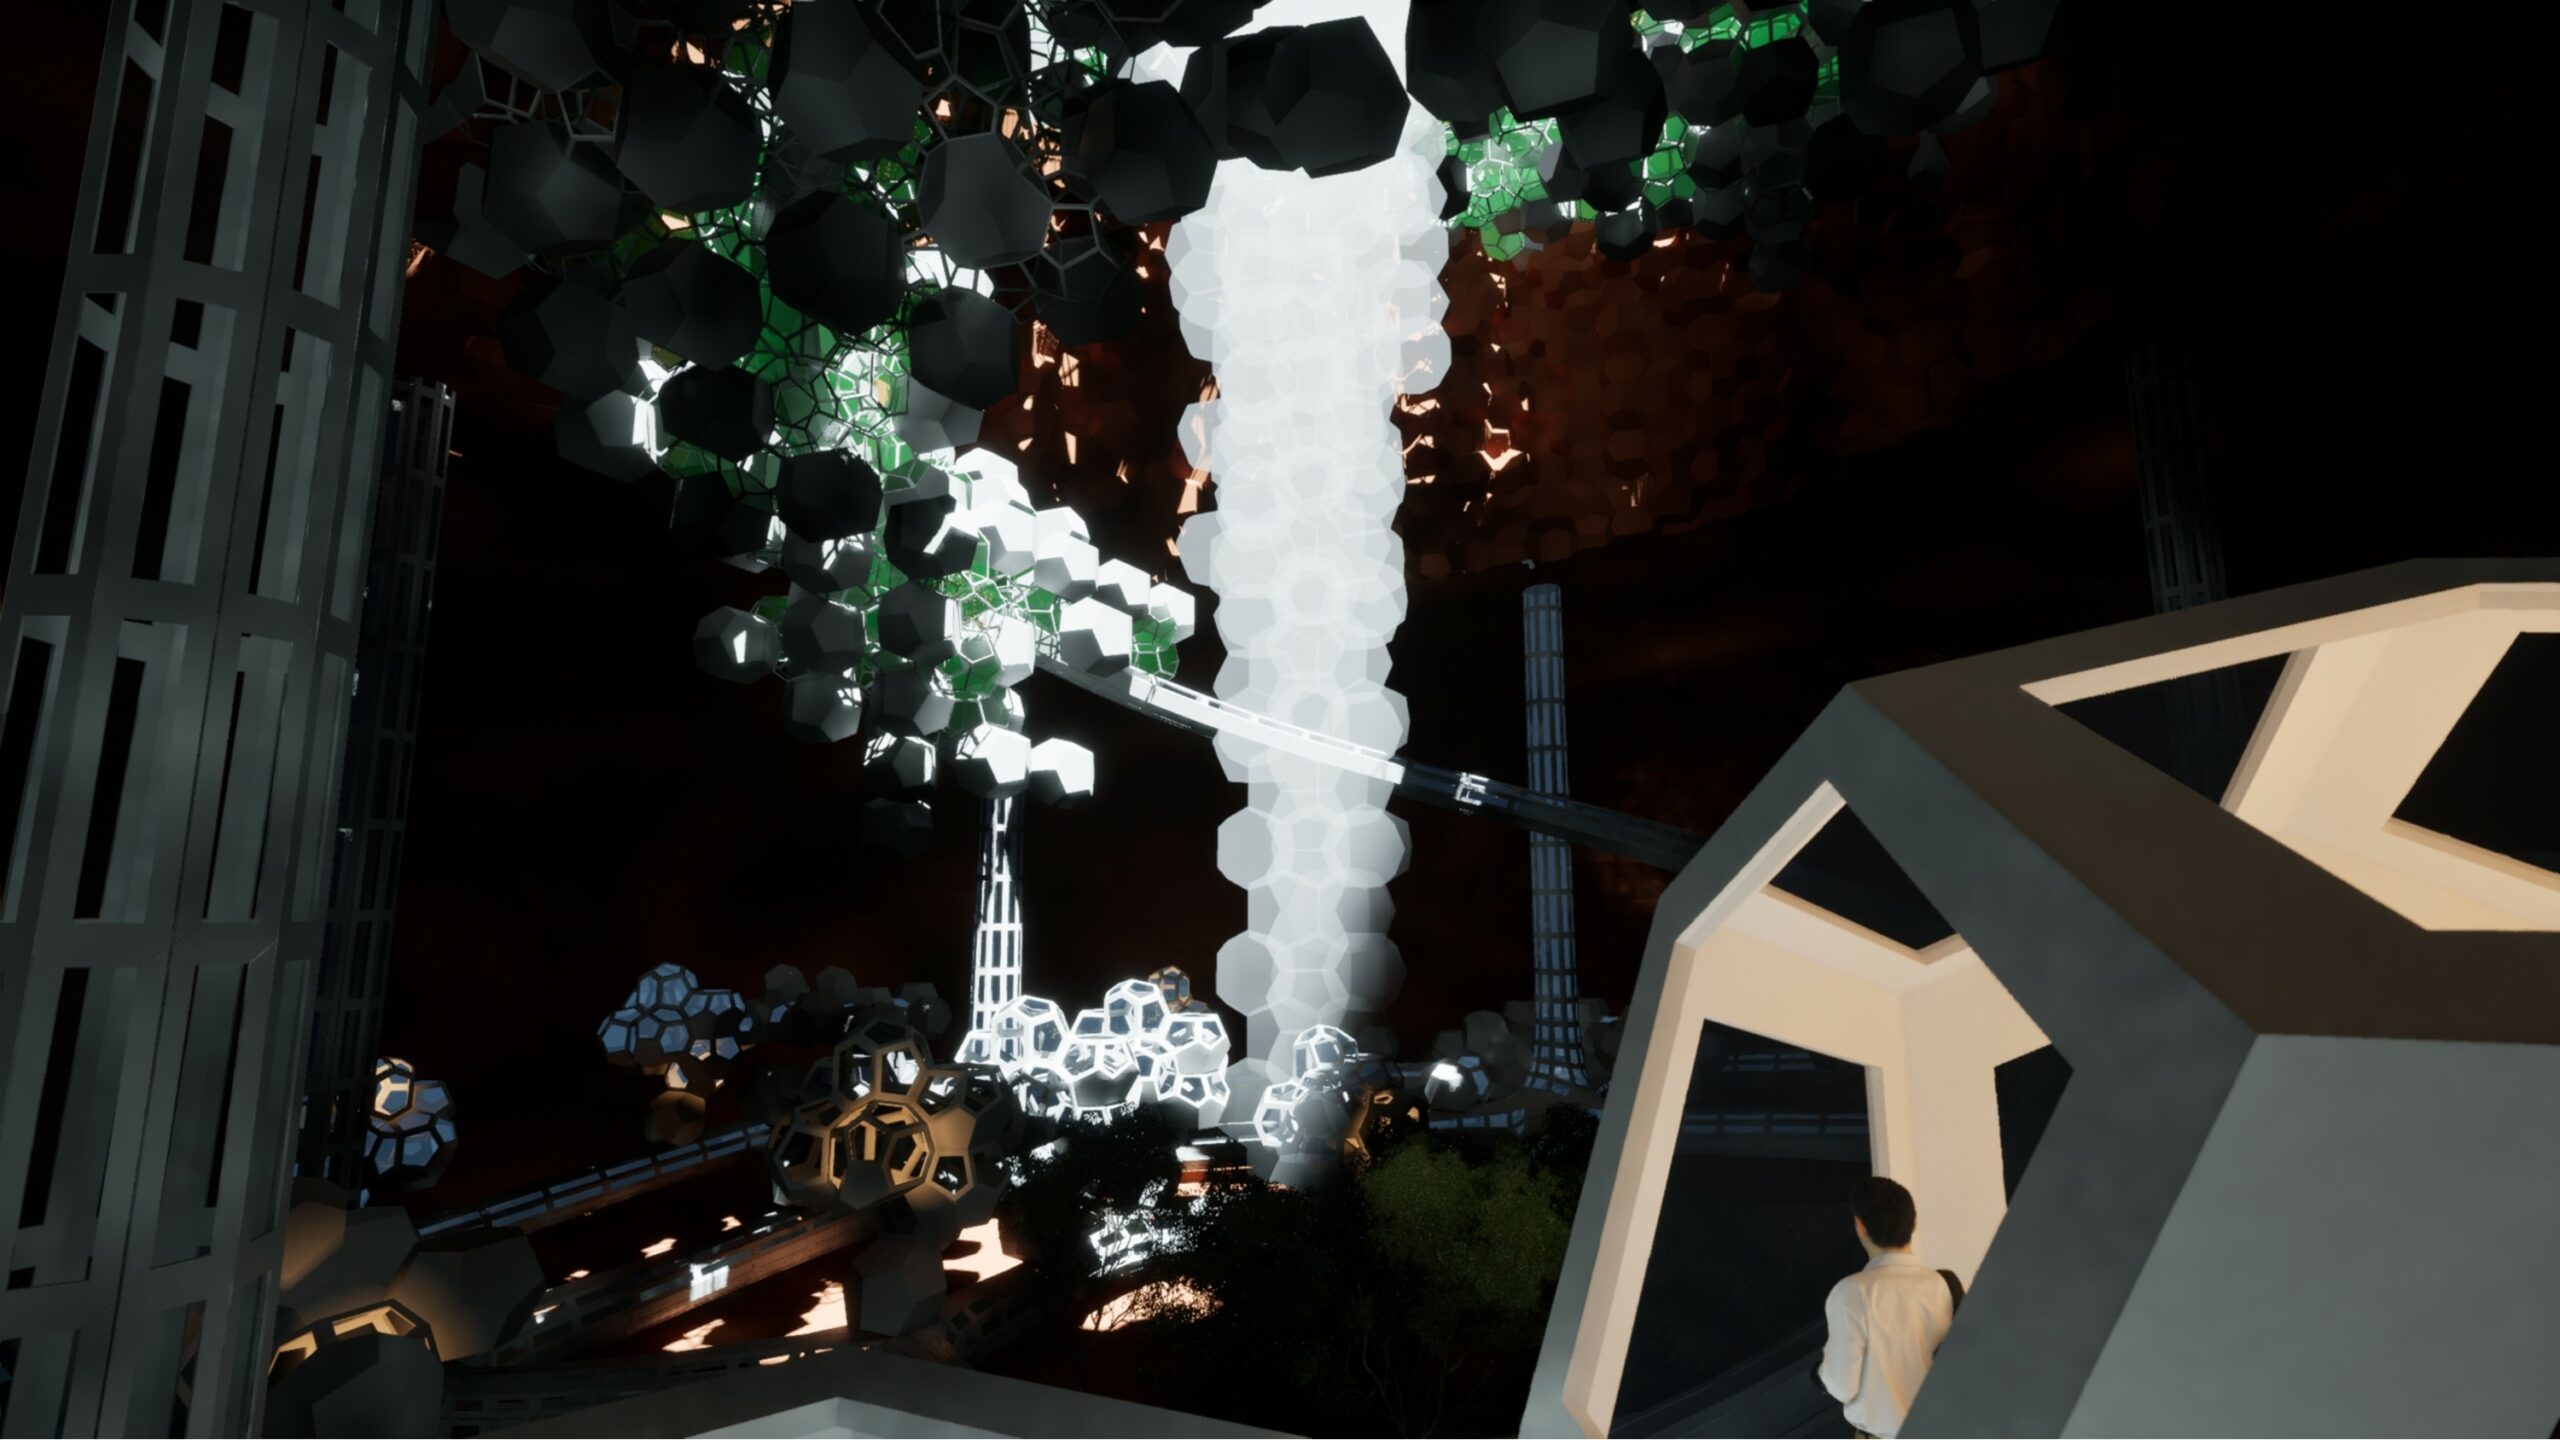
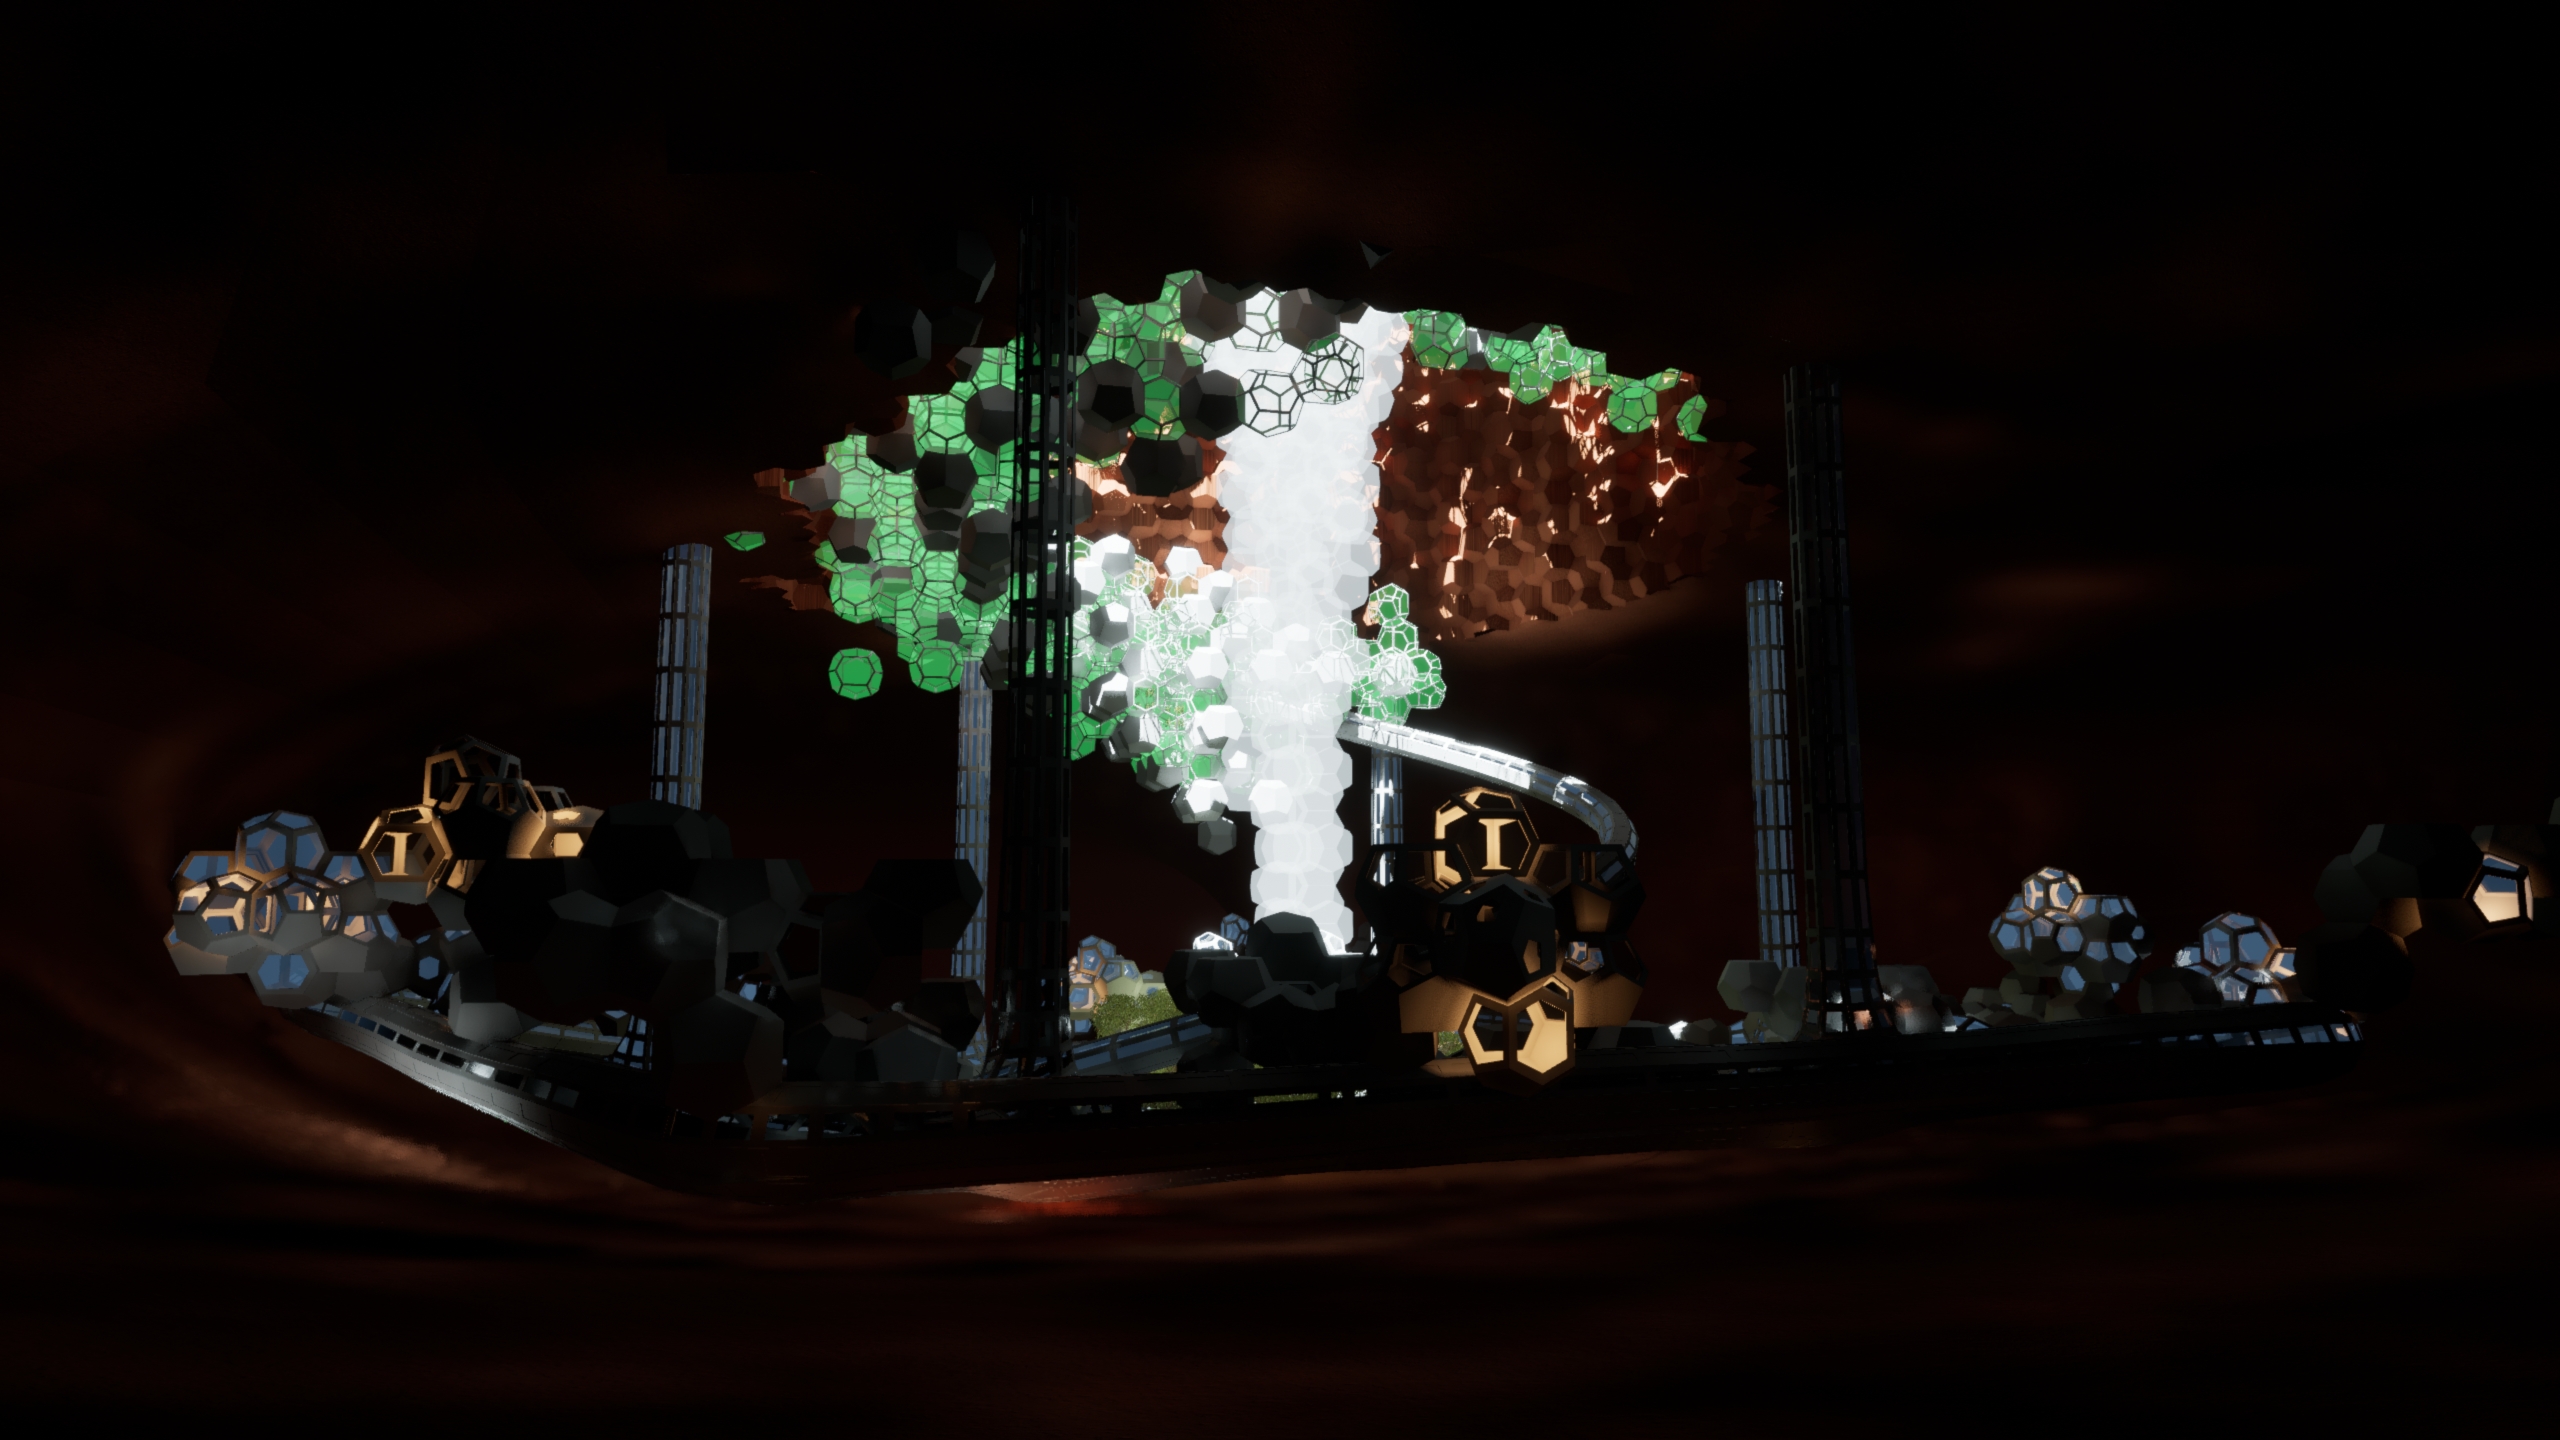
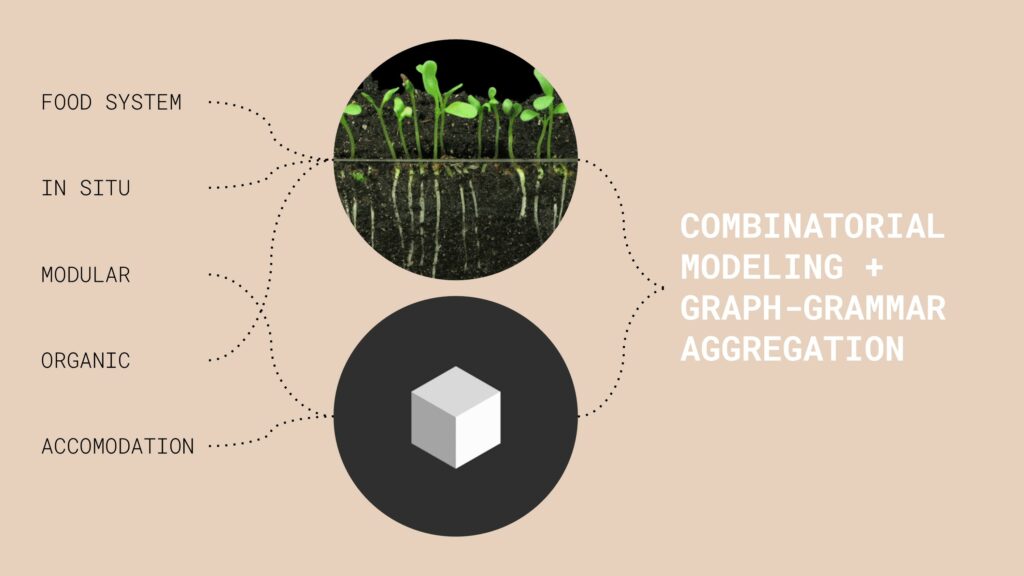
Aggreculture is a Mars colony architectural project focused on food production. The design concept is inspired by the way plant roots grow to find necessary nutrients within soil aggregate. Our project is unique in that it occupies a speculative Martian lava tube. By building in a lava tube, we use existing natural resources to provide radiation protection, dust storm protection, and a more regulated temperature environment. For these reasons, our computational method is focused on combinatorial modeling using aggregation algorithms.
Computational Method
Parametric Approach
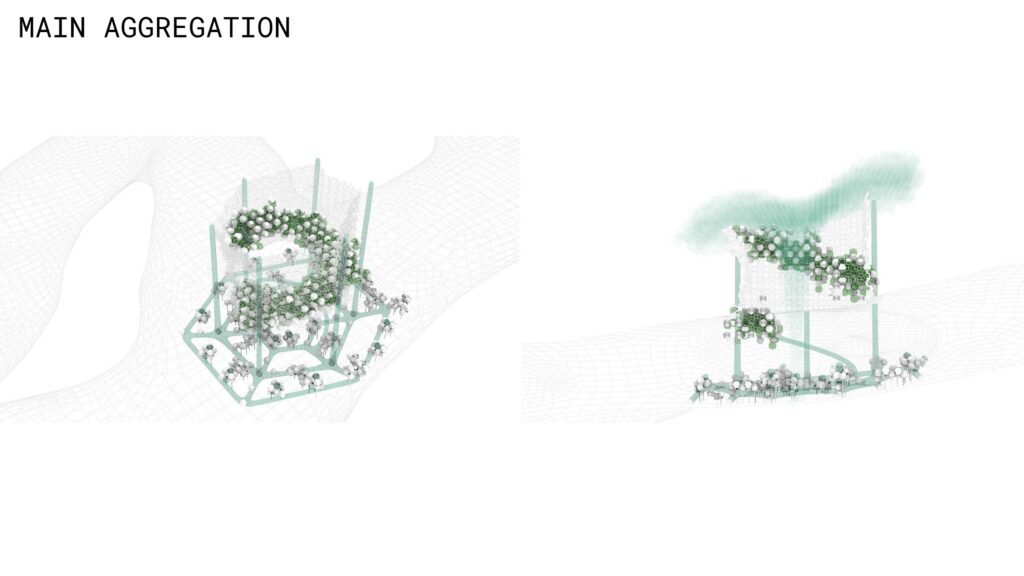
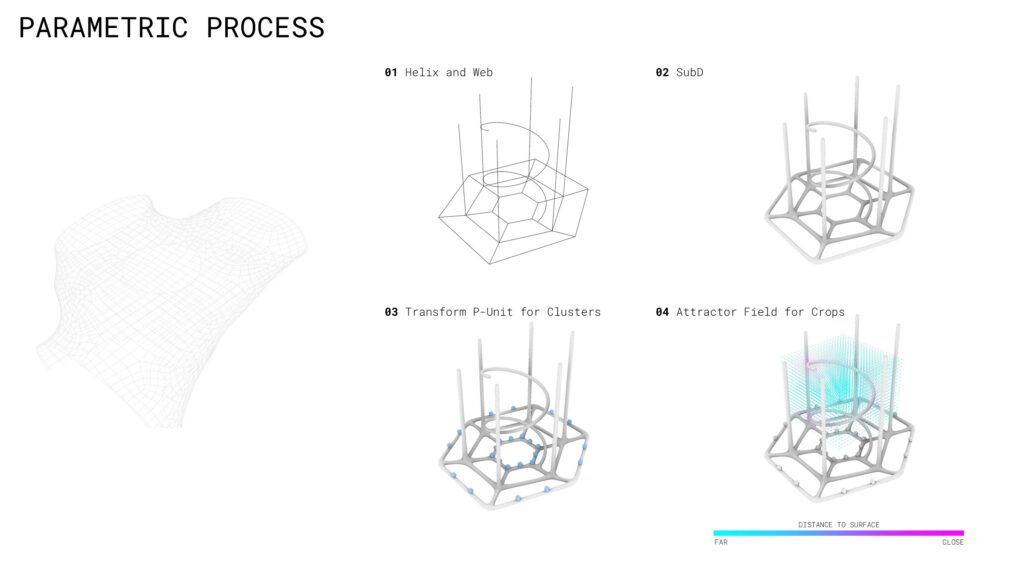
First, the lava tube is created using volumetric subtractive typologies. The Dendro plug-in was used to create the a realistic Martian lava tube and skylight. Next, the aggregation is completed utilizing the Wasp plug-in within Rhino and Grasshopper. Graph-grammar rules helped define the three main clusters: residential, service, and harvest. Furthermore, field attractors were employed to stochastically aggregate the crop modules around the central skylight and along a helix movement corridor. The movement corridor is generated as a subD mesh based on an array of concentric curves and mathematically defined helix.
Importantly, the aggregation logic quickly increased the mesh count within our model. Therefore, we leveraged block definitions through the Elefront plug-in to increase computational speed as well as provide smooth interoperability between Rhino, Grasshopper, and Revit.
Collaborative Workflow
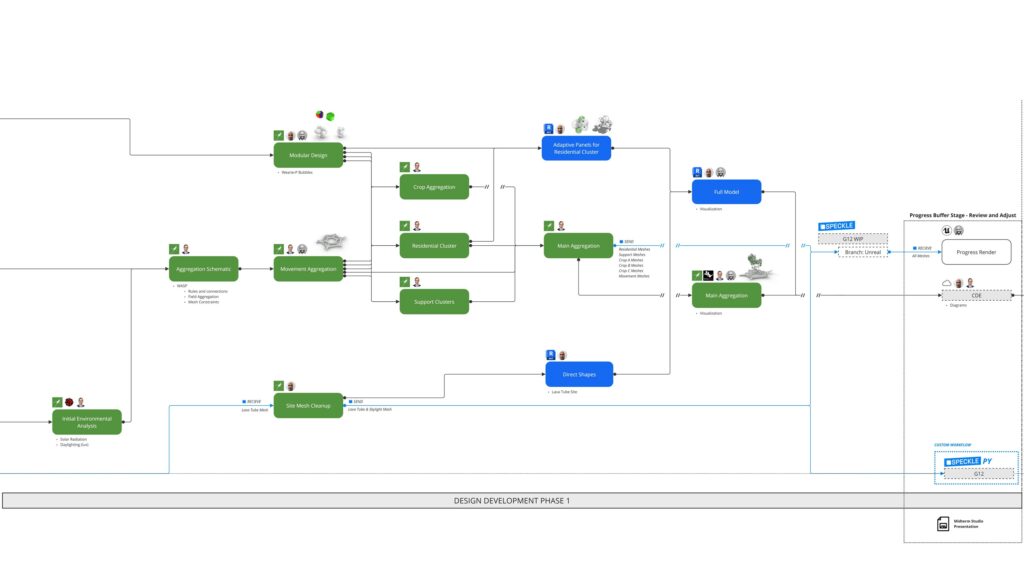
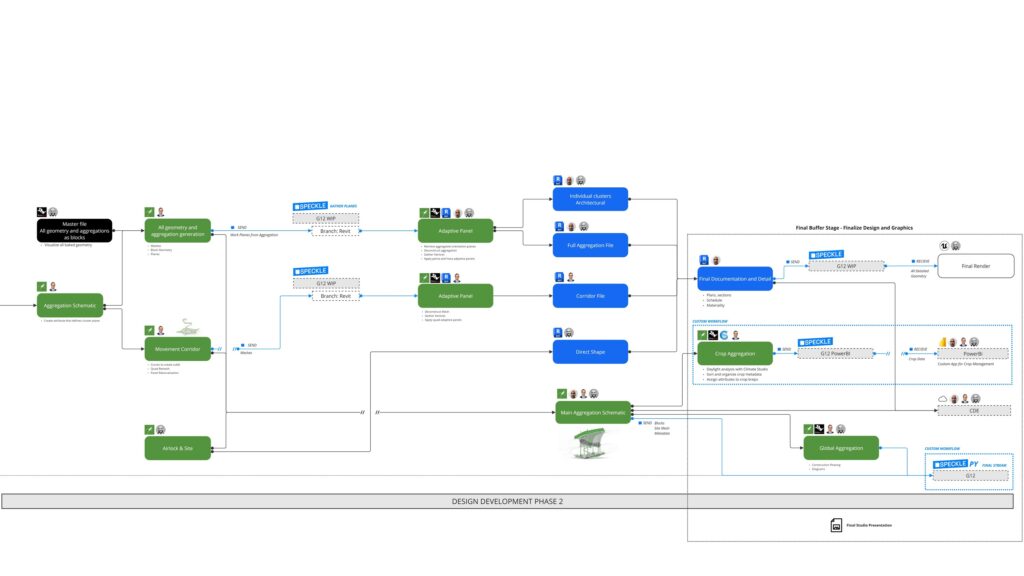
Below is a detailed diagram illustrating our groups collaborative workflow. Speckle was used throughout the process to transfer and digest data-rich geometry. In the conceptual stage, Speckle was used primarily to share conceptual design iterations. During the first phase of design development, Speckle was utilized as a data and geometry repository with direct connections to Unreal, our rendering engine. Importantly, in the final detailed design phase of the project, Speckle was used to receive and send block orientation planes which allowed us to gather, sort, and deconstruct our block definitions using Rhino.Inside for documentation.

Documentation
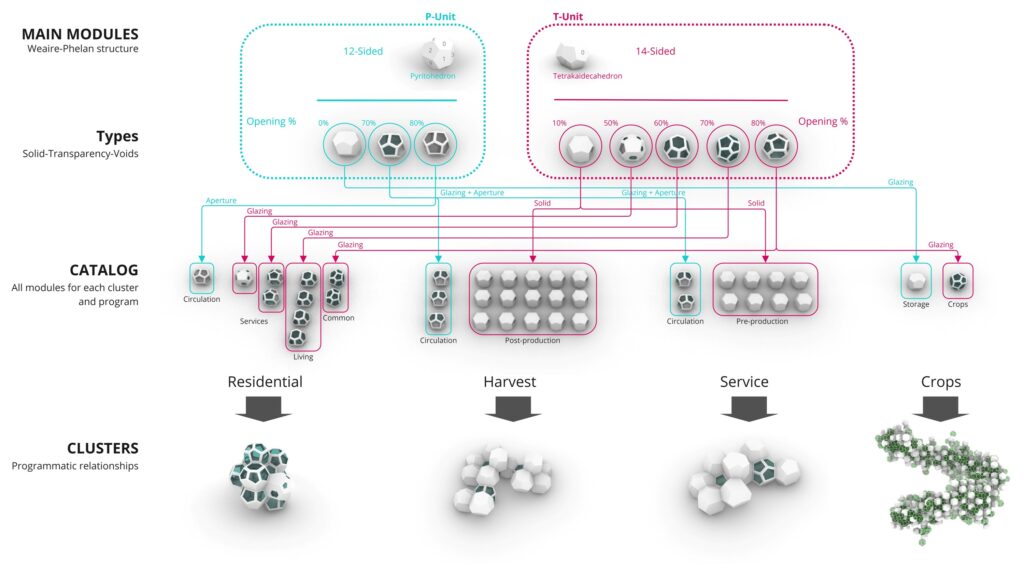
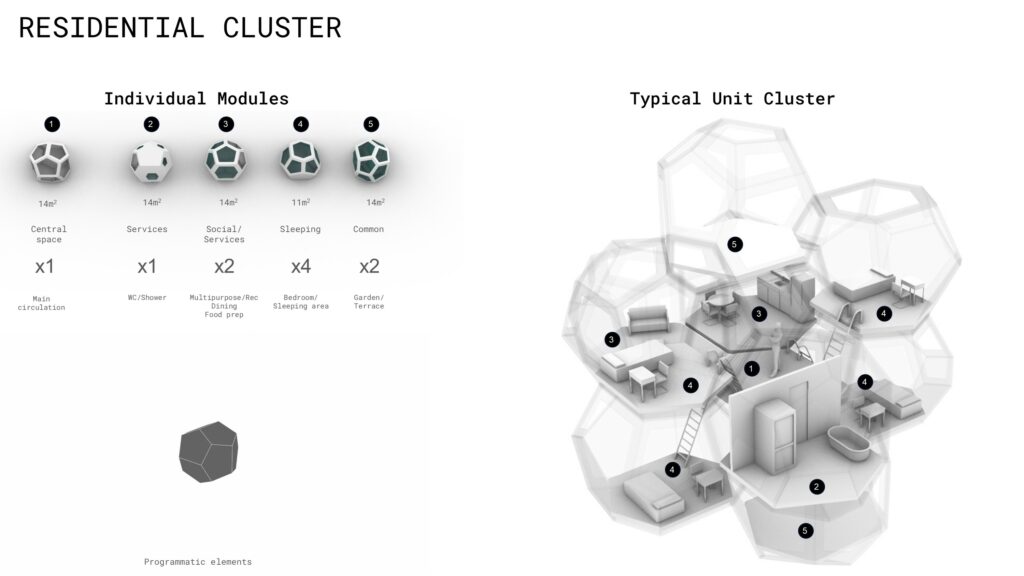
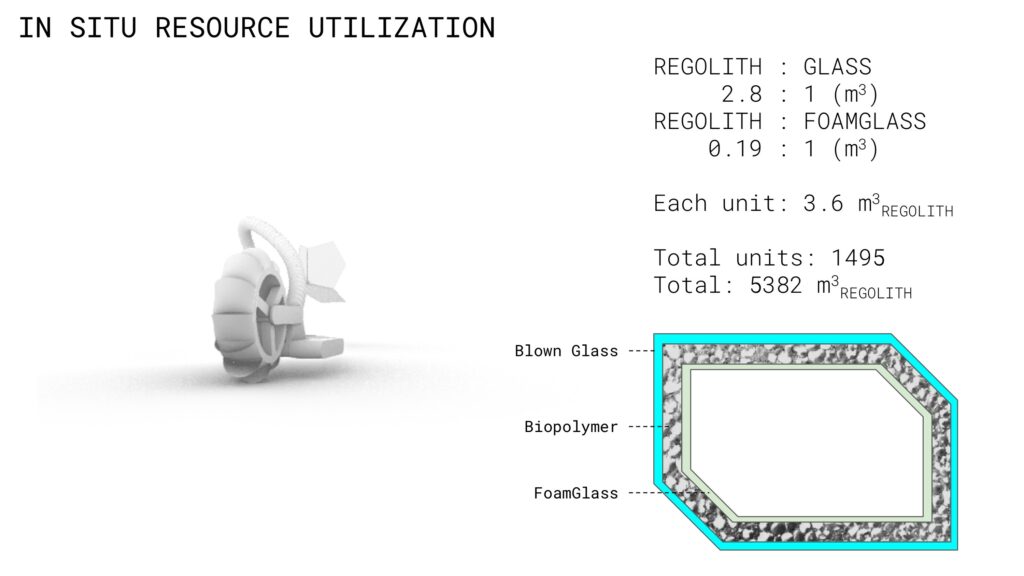
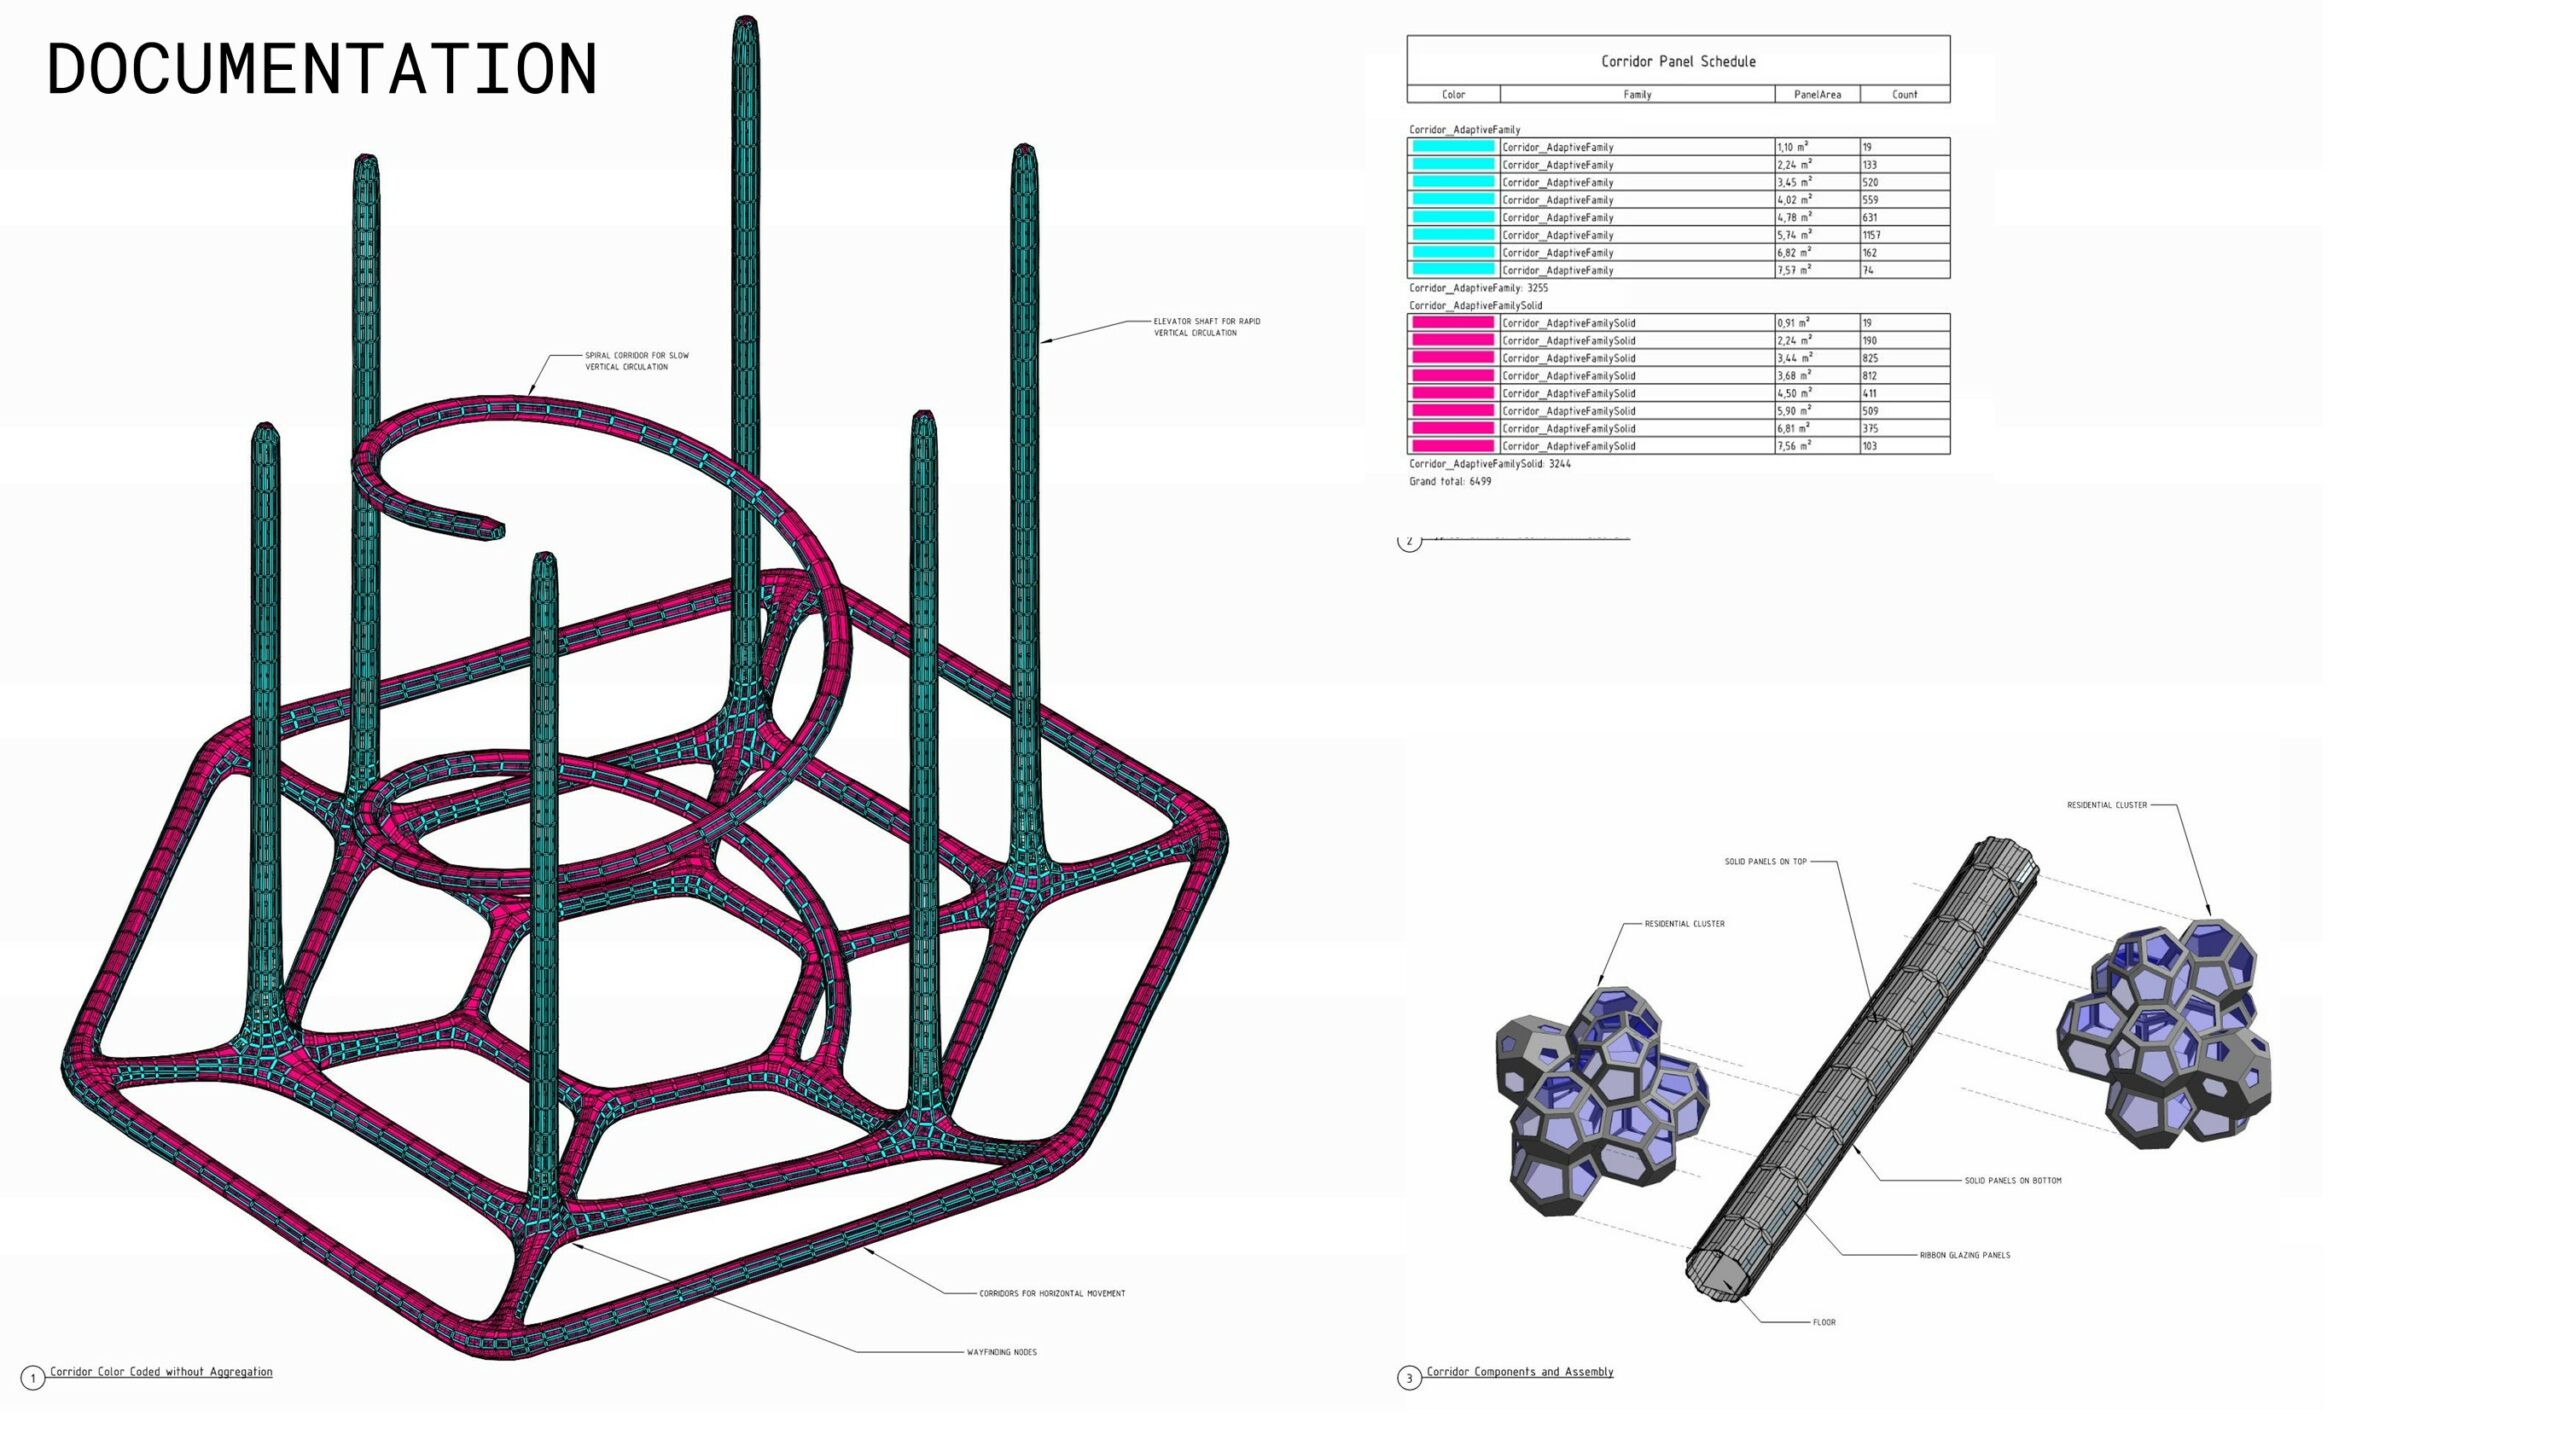
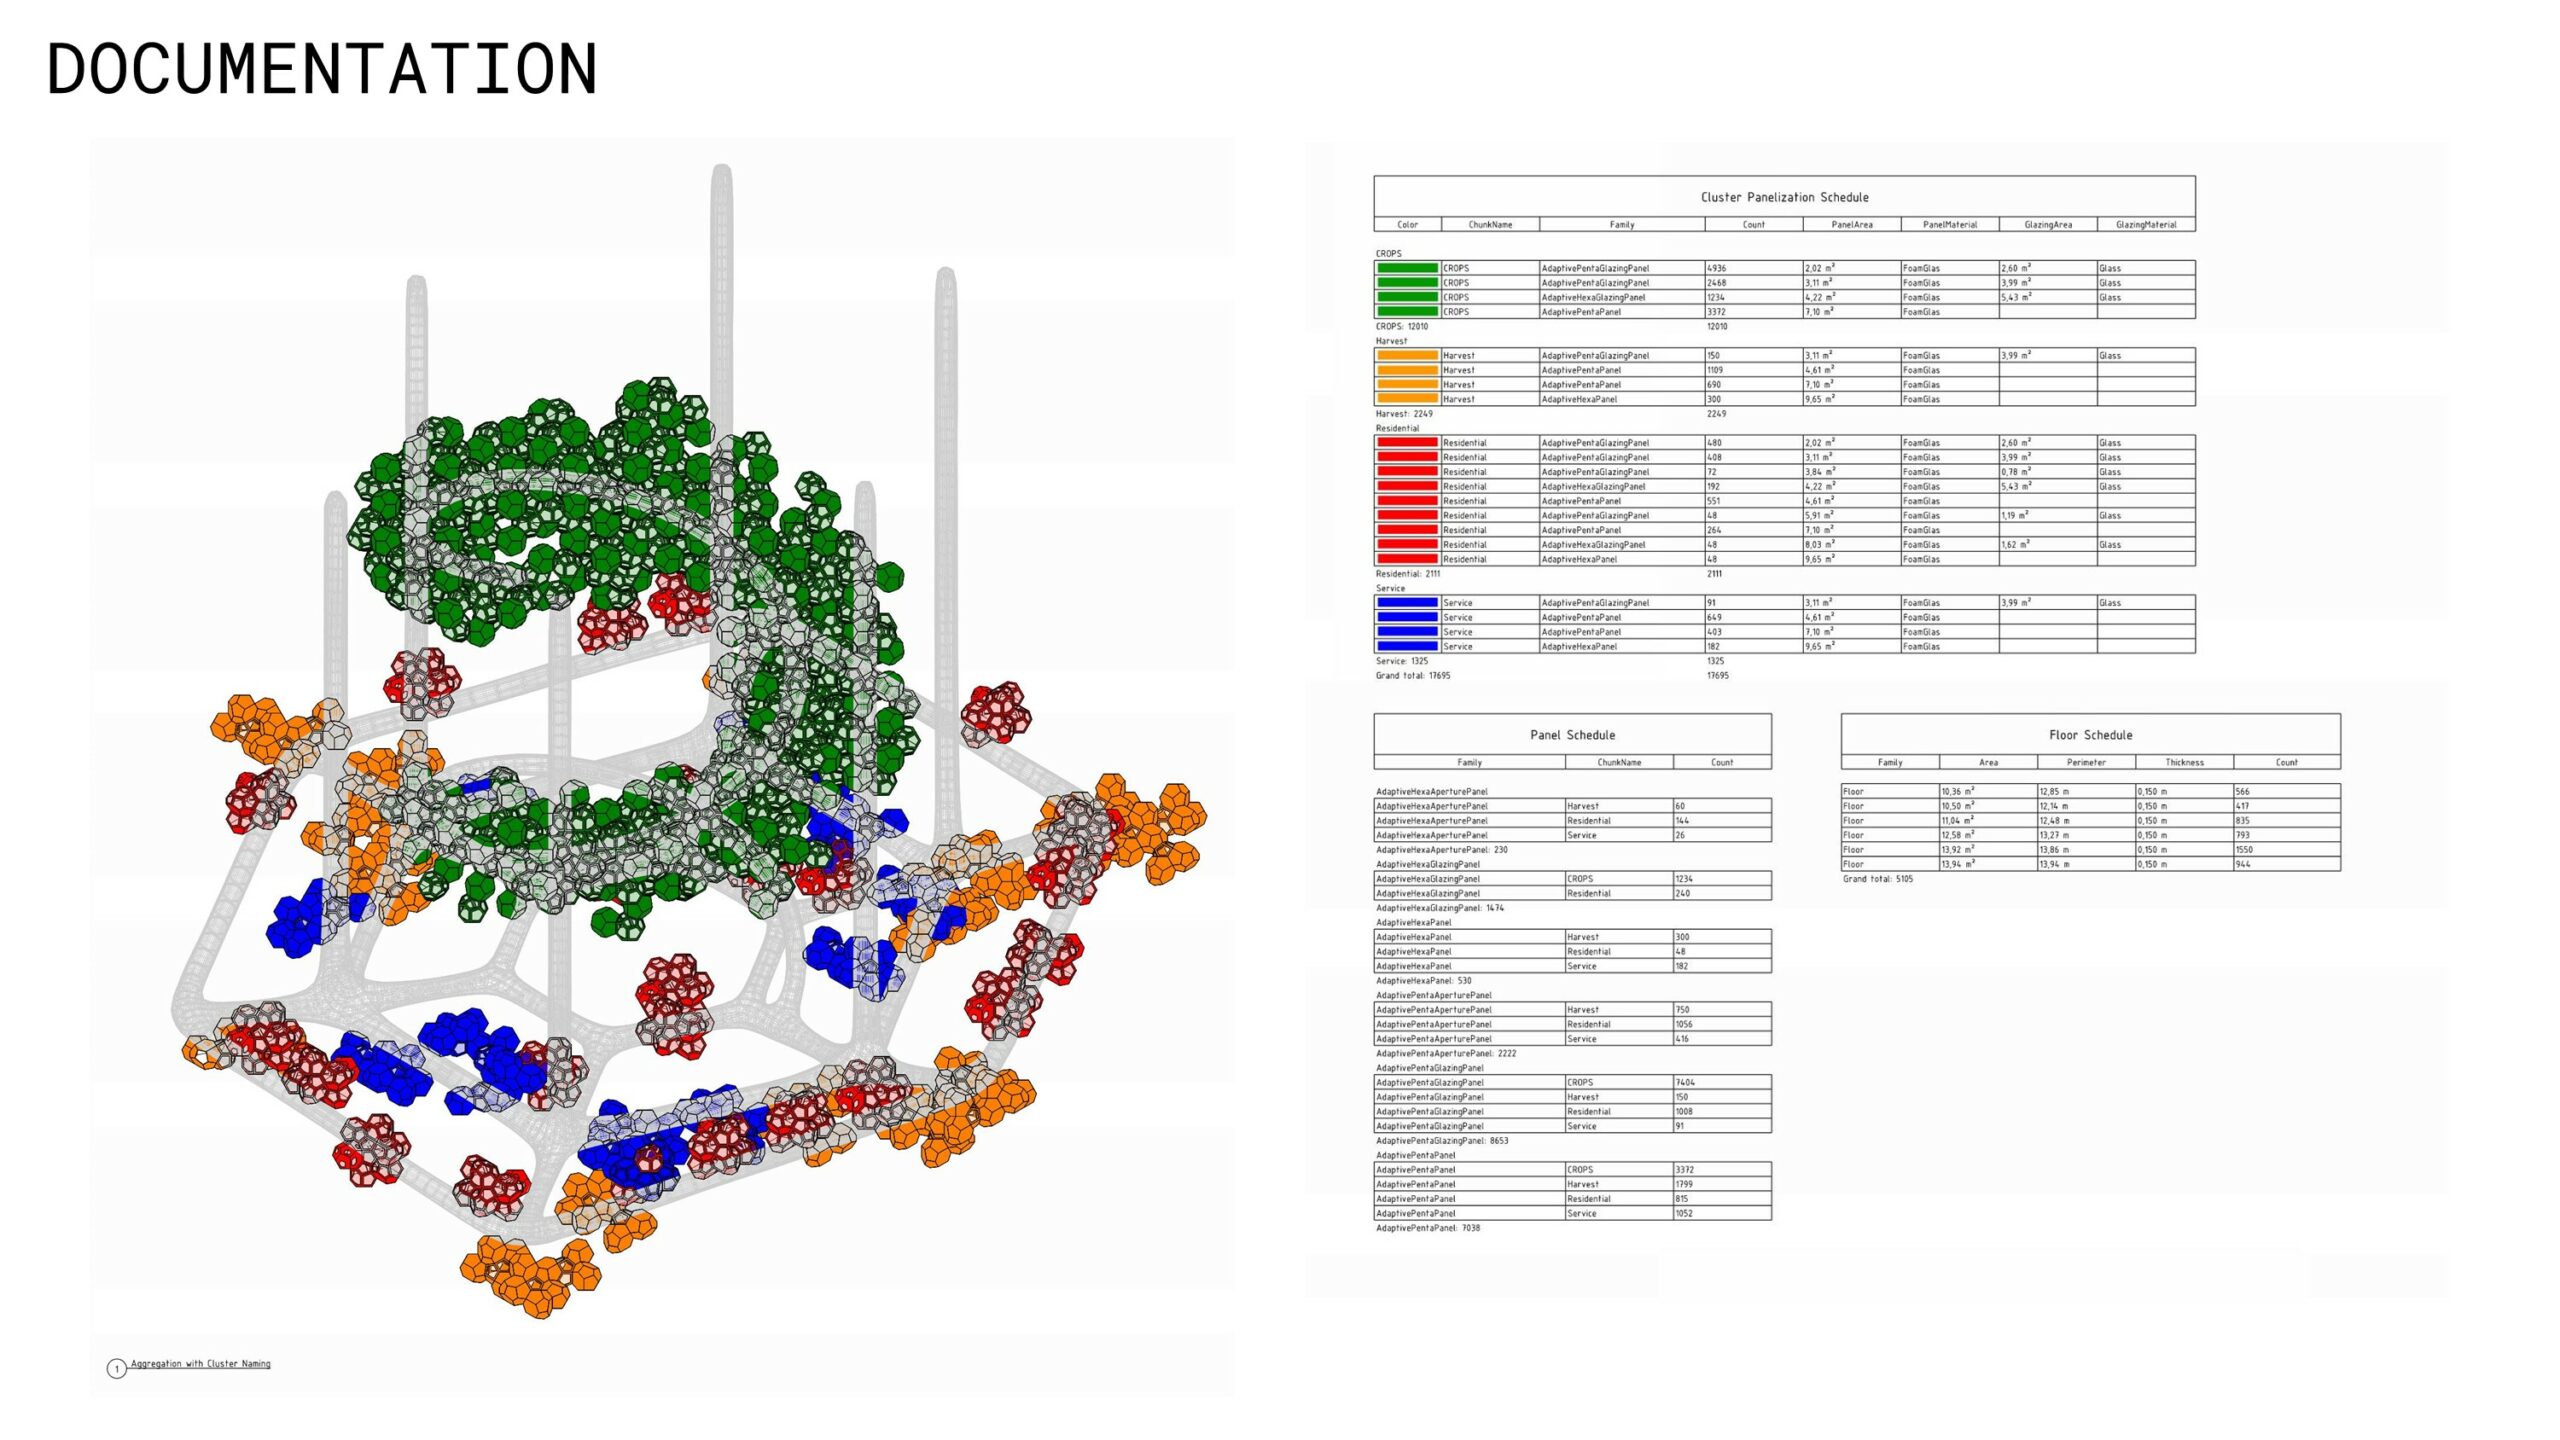
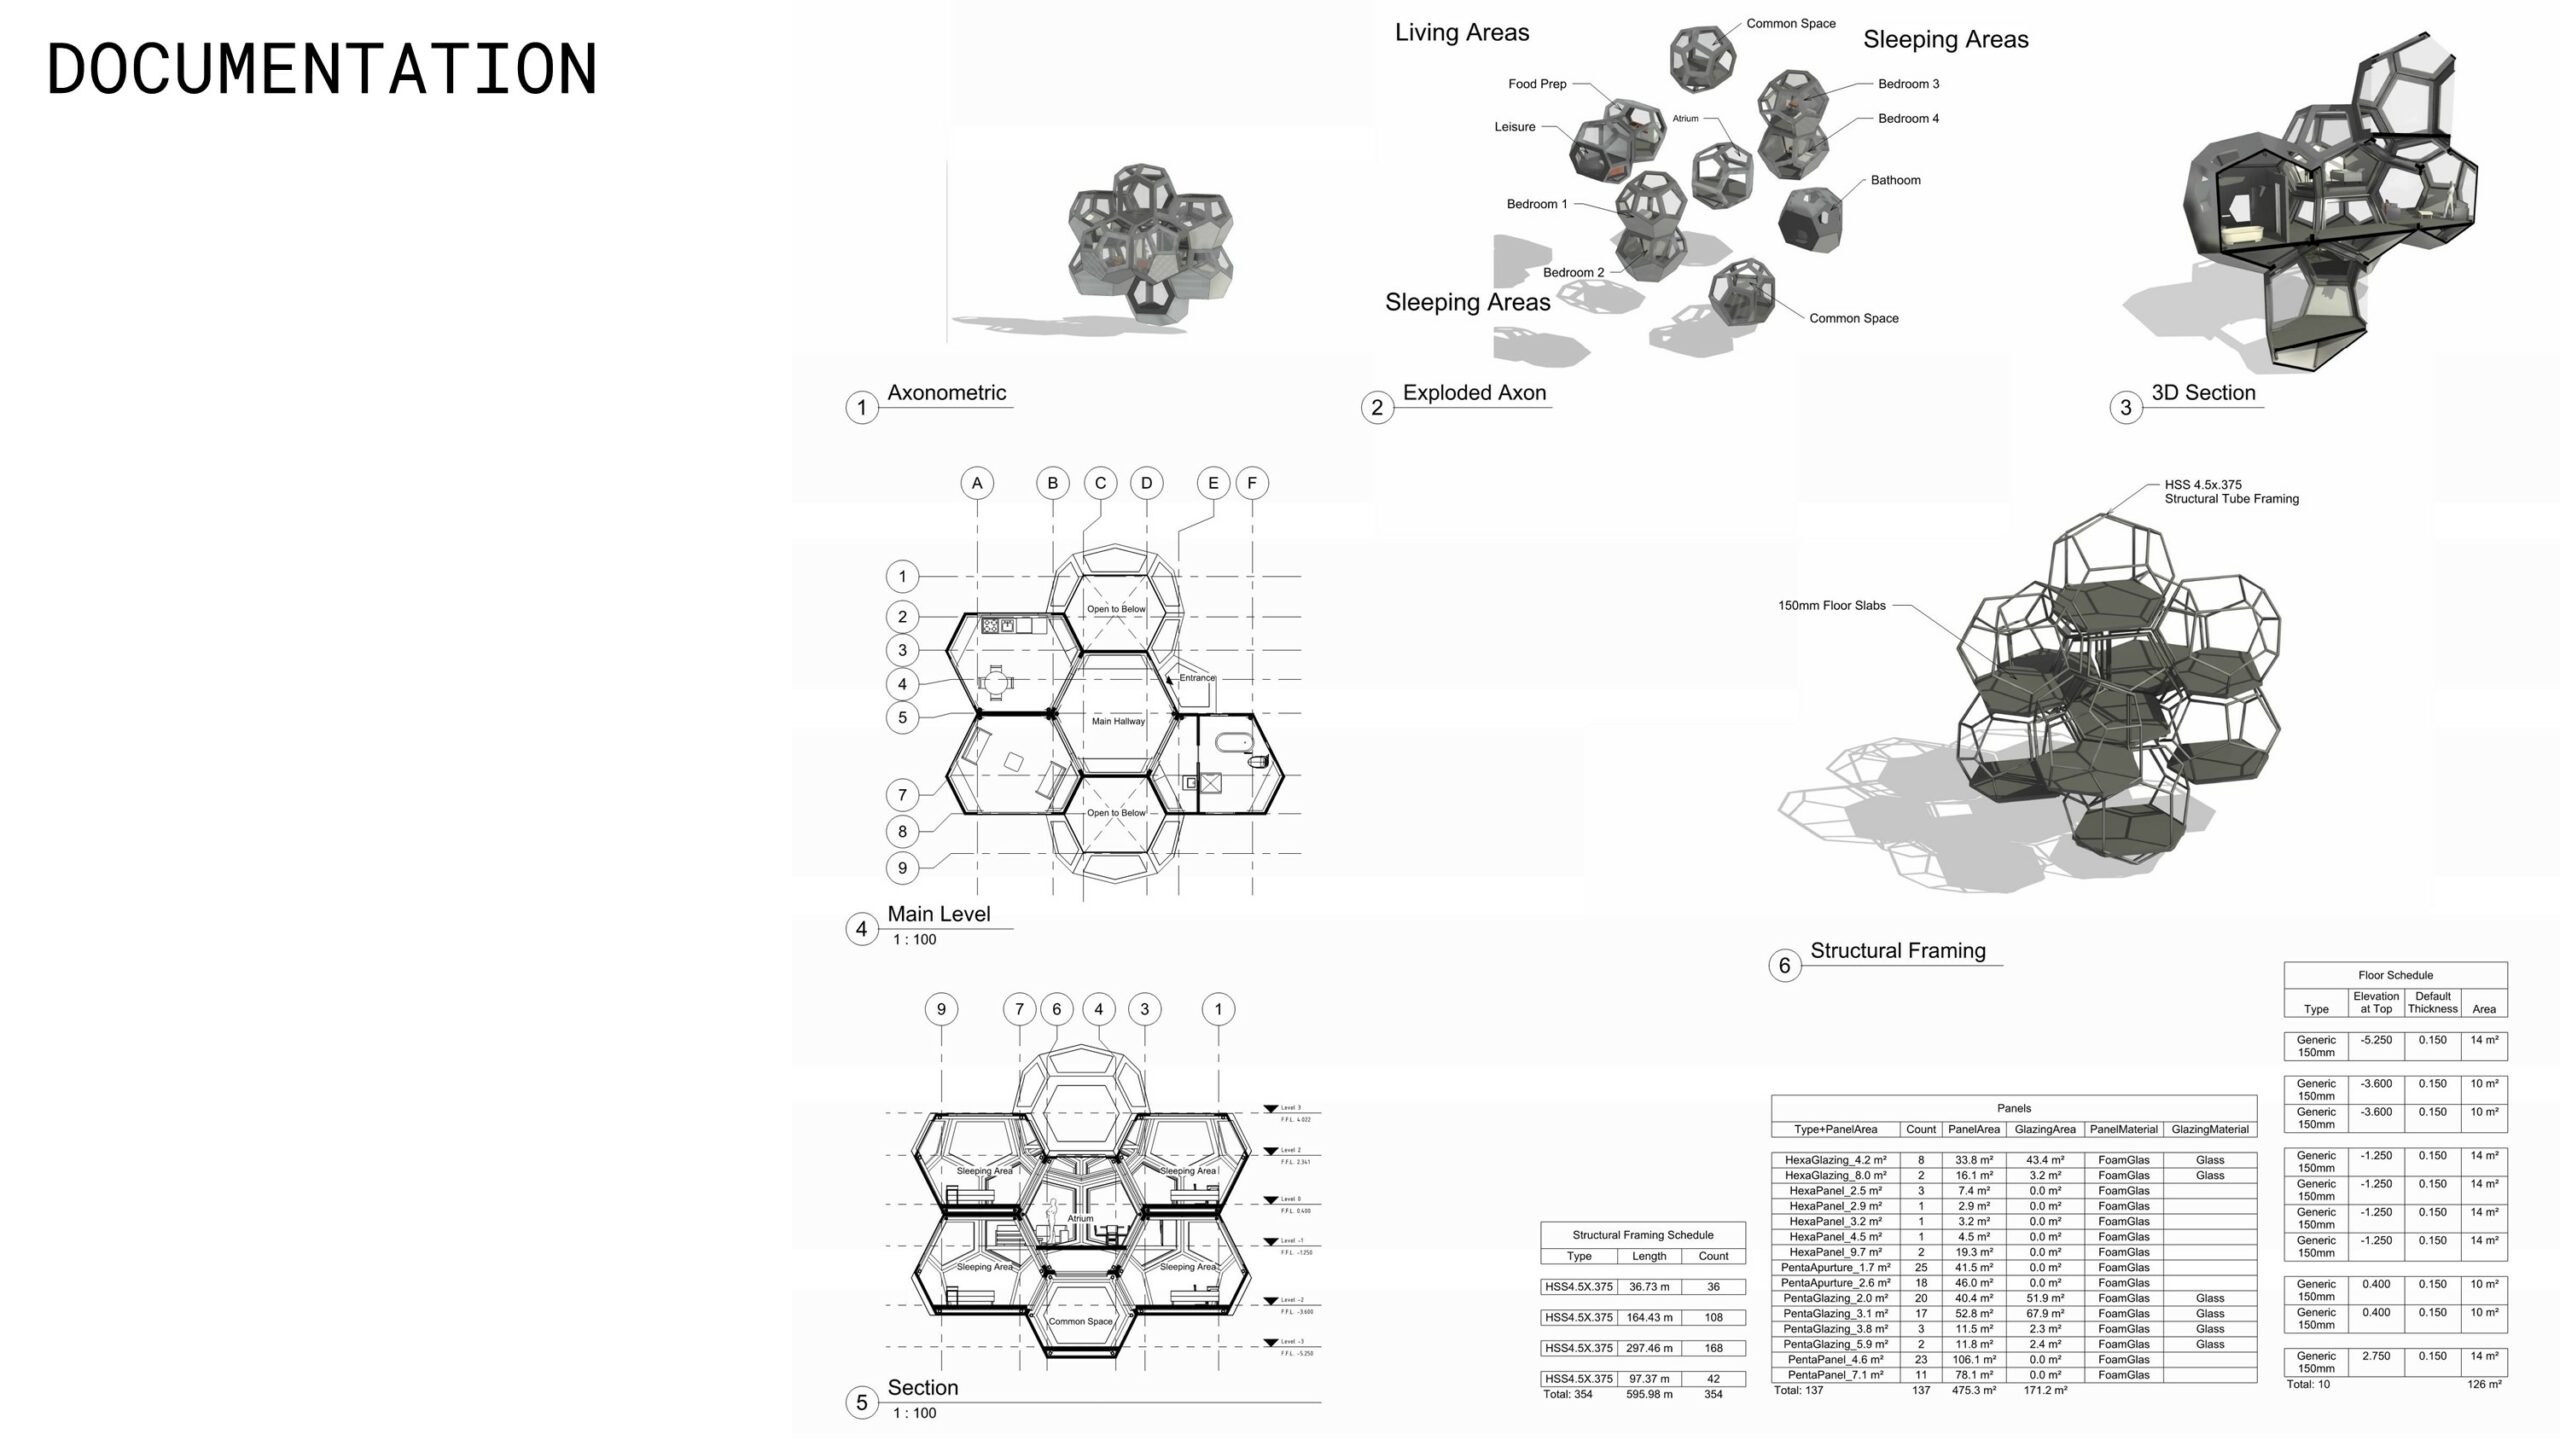
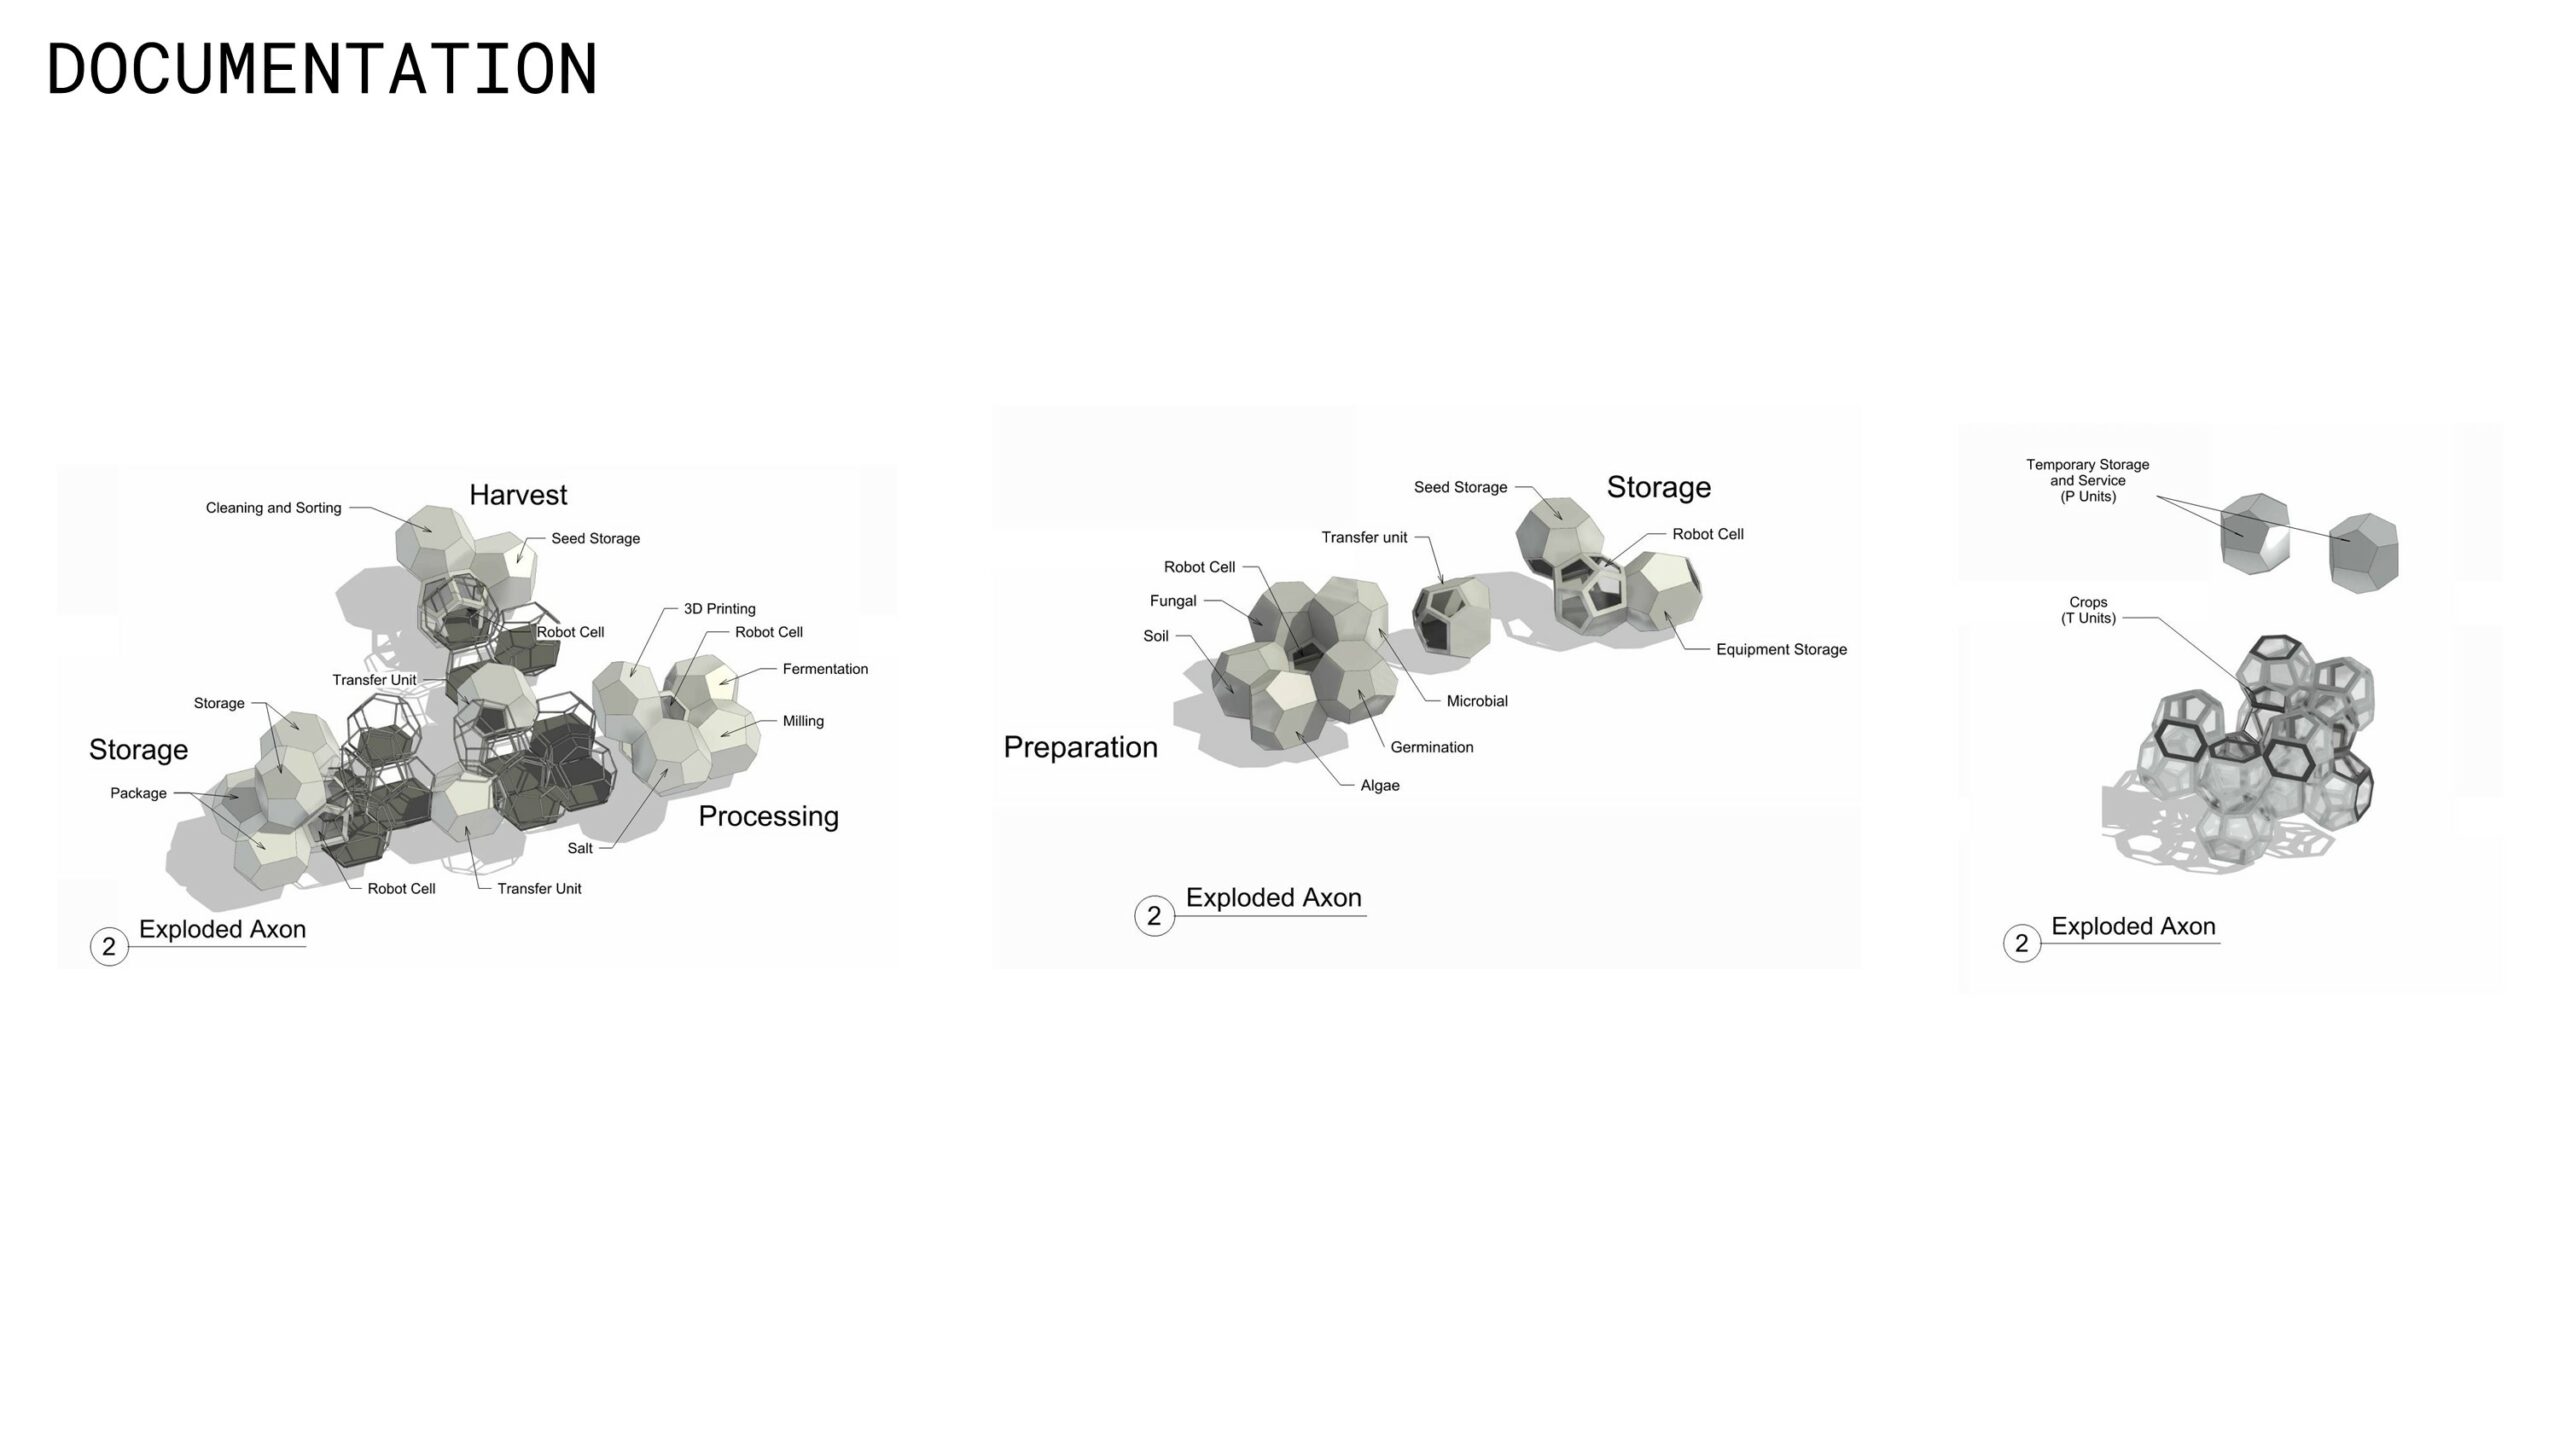
Our group utilized Rhino.Inside Revit exclusively to document complex aggregation geometries. First, each cluster and crop module is based on six different adaptive families. Our base module shapes allowed us to parametrically design adaptative “penta” and “hexa” panels, both with and without glazing, to construct the geometry. Parametrics include cluster name, shape, materials, solid panel area, and glazing area. The panels are envisioned as structural blown glass, thus using in situ resources and limiting the need for water.
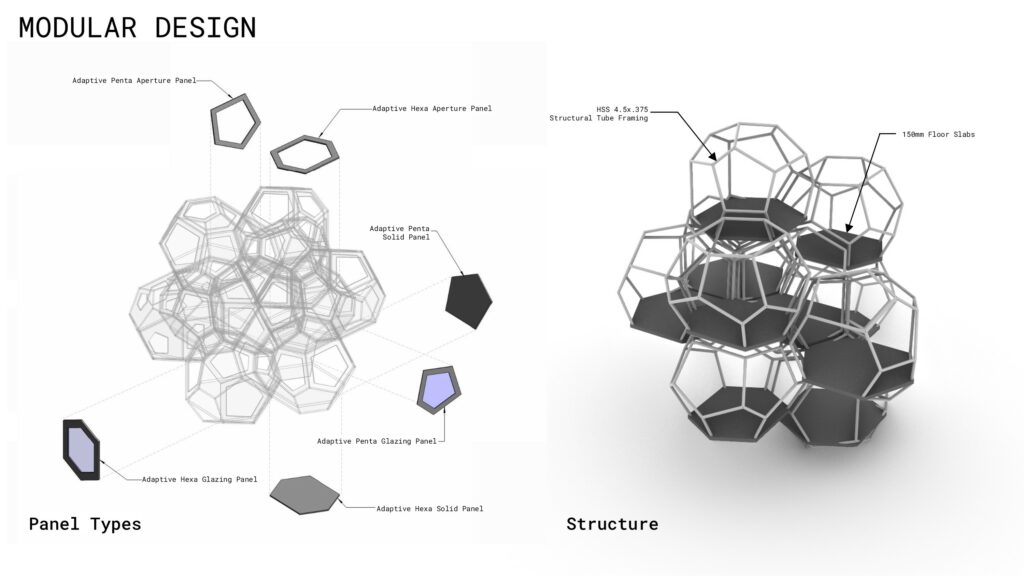
The corridor utilizes two quad adaptive families, one with glazing and one solid. For both the clusters and corridor, vertices are extracted from a Speckle stream trough a custom Grasshopper script. At first, we tried building each cluster as a Revit file and linking into a master file. However, we discovered that it is very difficult to orient Revit links and given our 3D aggregation and complex orientations, this method proved ineffective. Secondly, we attempted to utilized Model Groups within Revit but found it laborious to extract the necessary shared parameters needed to create meaningly schedules and filtered views. Finally, it is possible to create and use nested families; however, this would have resulted significant re-work to our process. Given these constraints, we used adaptive families directly based on vertices gathered from our deconstructed block method to document.
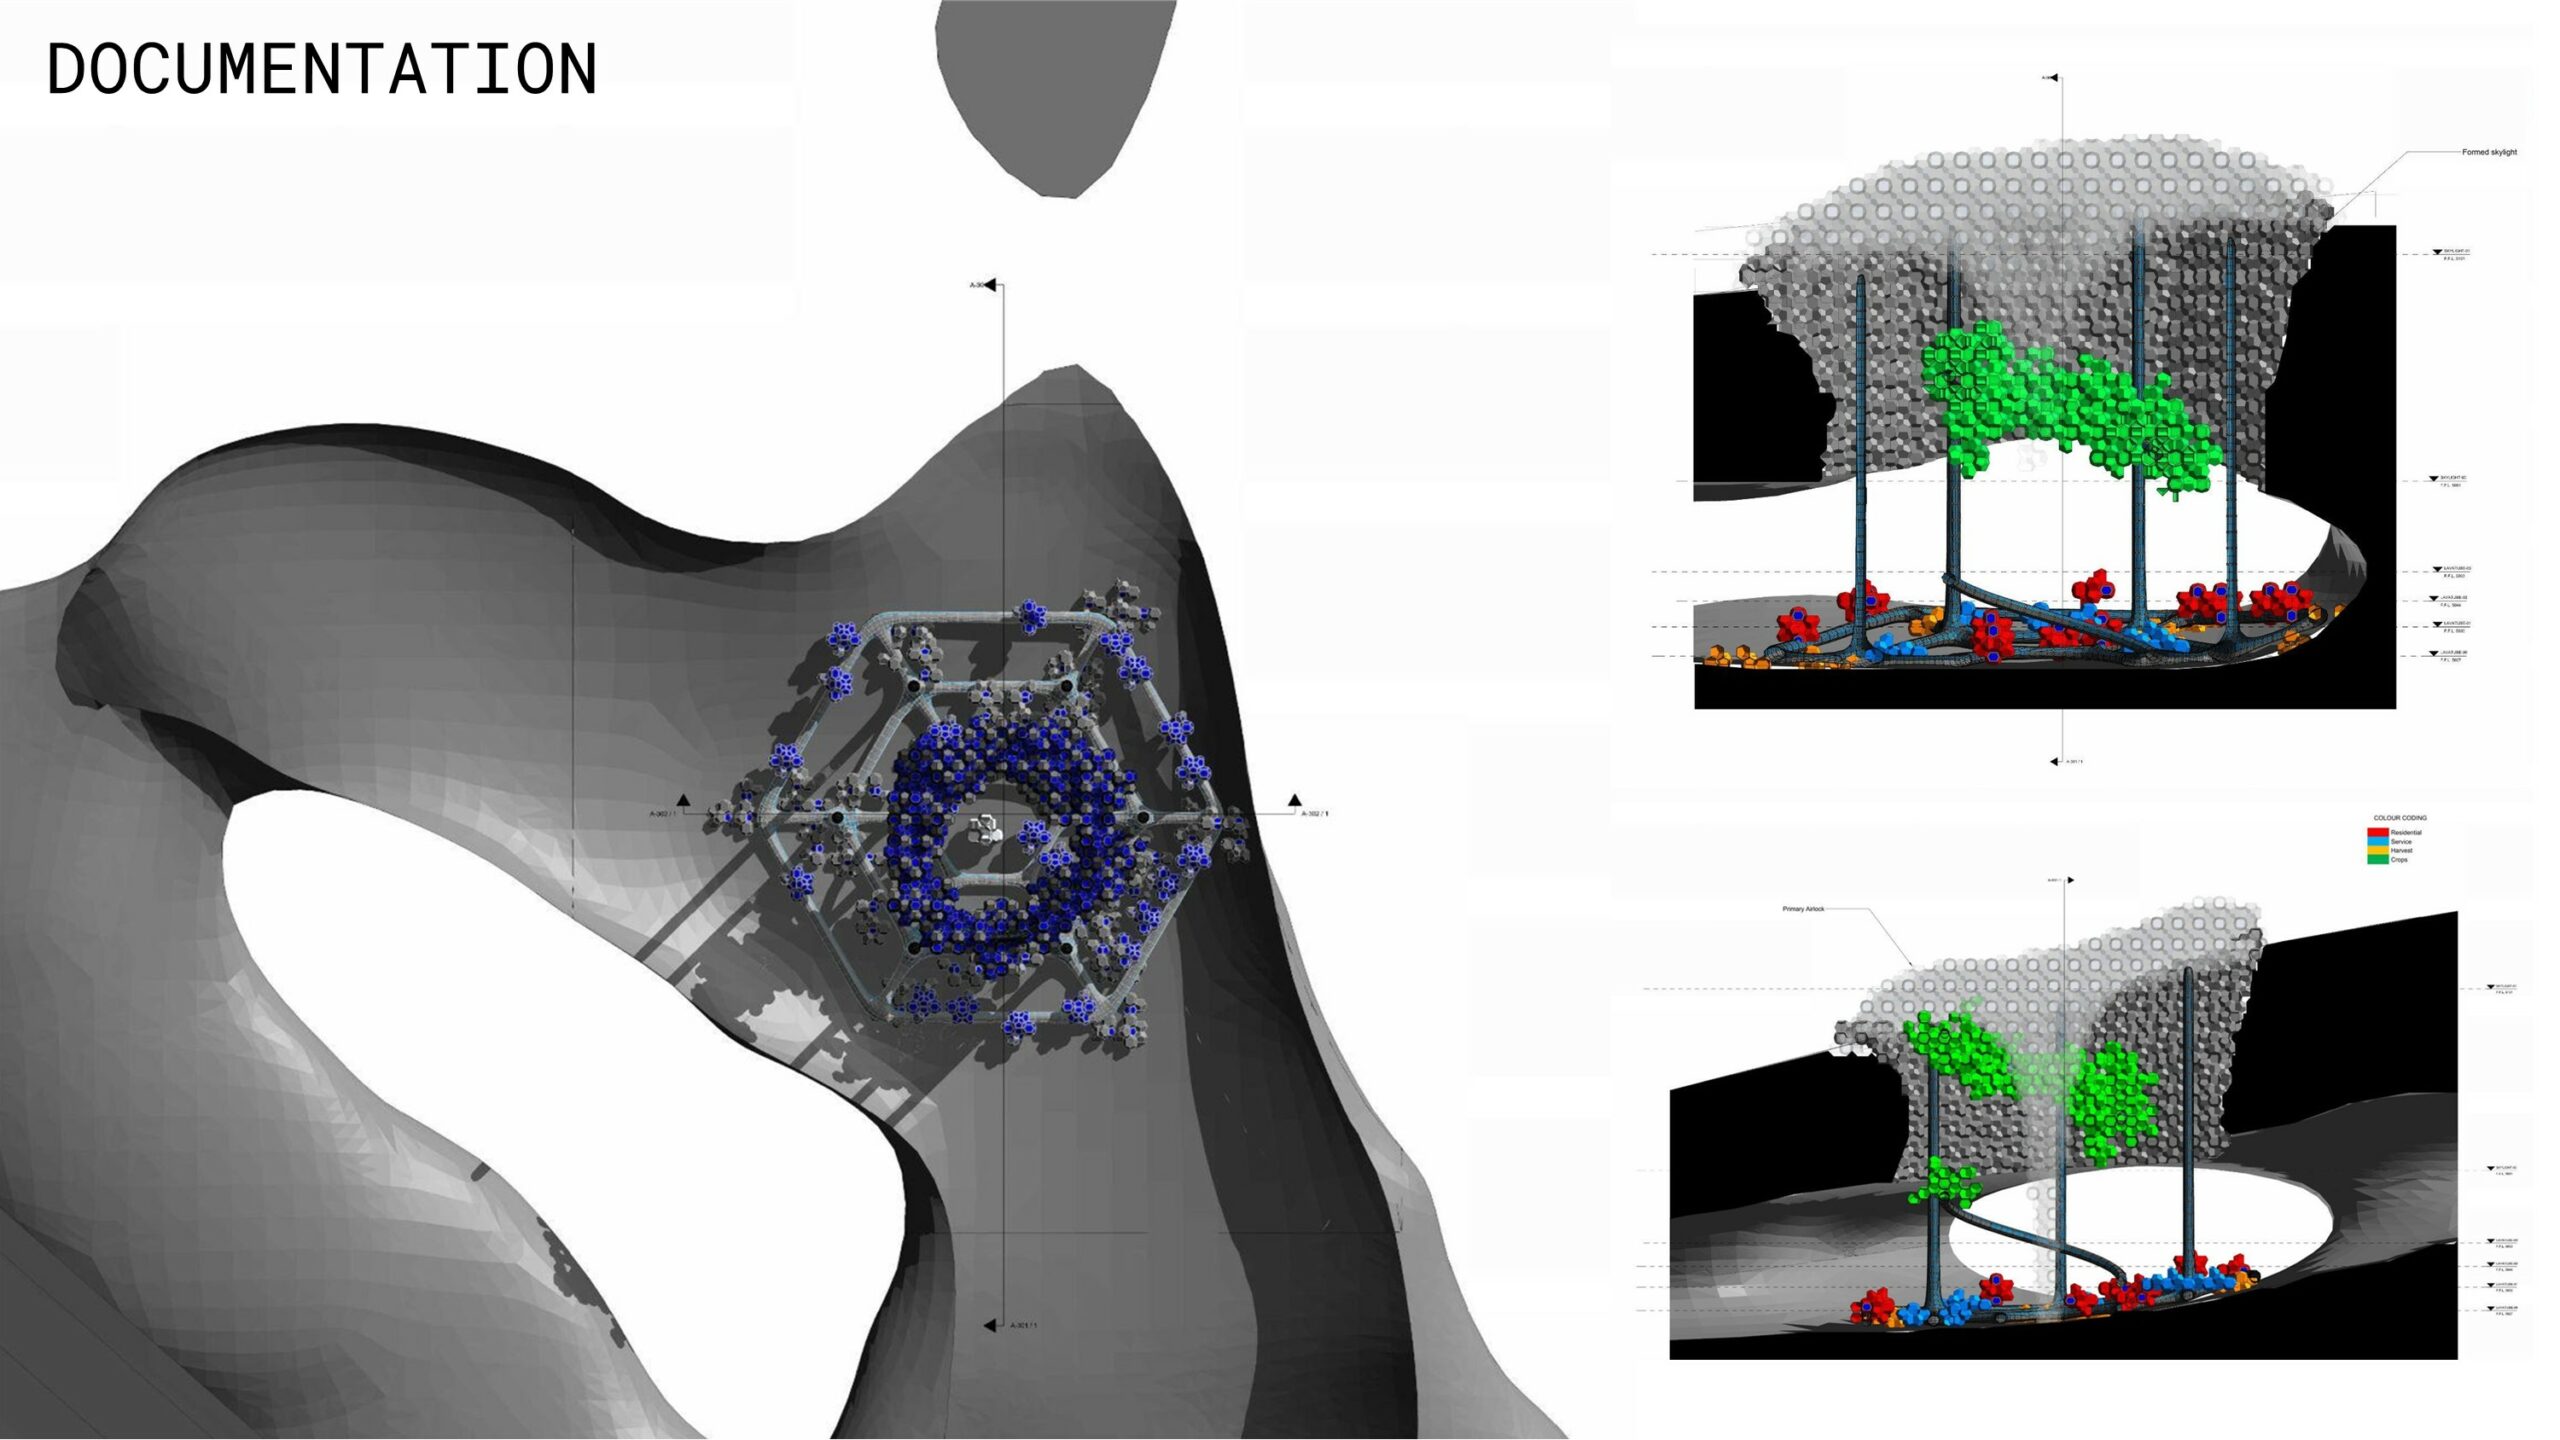
The final documentation includes plan views of the main aggregation within the lava tube. Color-coded sections illustrate the architecture and programmatic relationship to the site. Furthermore, by using shared parameters within our adaptative families, we were able to create filtered views and schedules. For example, we have documented the clusters with specific clusters for easy visual organization. A color-coded schedule further breaks out the quantity, material, and panel areas associated with each cluster. A detailed sheet focused on the corridor organizes the quad panels via a color-coded filter and schedule as well as exploded axonometric views. Finally, detailed 3D structural models, annotated exploded axons, plans, and sections thoroughly describe each cluster: residential, service, and harvest.
Throughout this process, we learned about Revit best practices. While challenging, this process will certainly help us improve future BIM efforts and create more effective and novel workflows.