Introduction
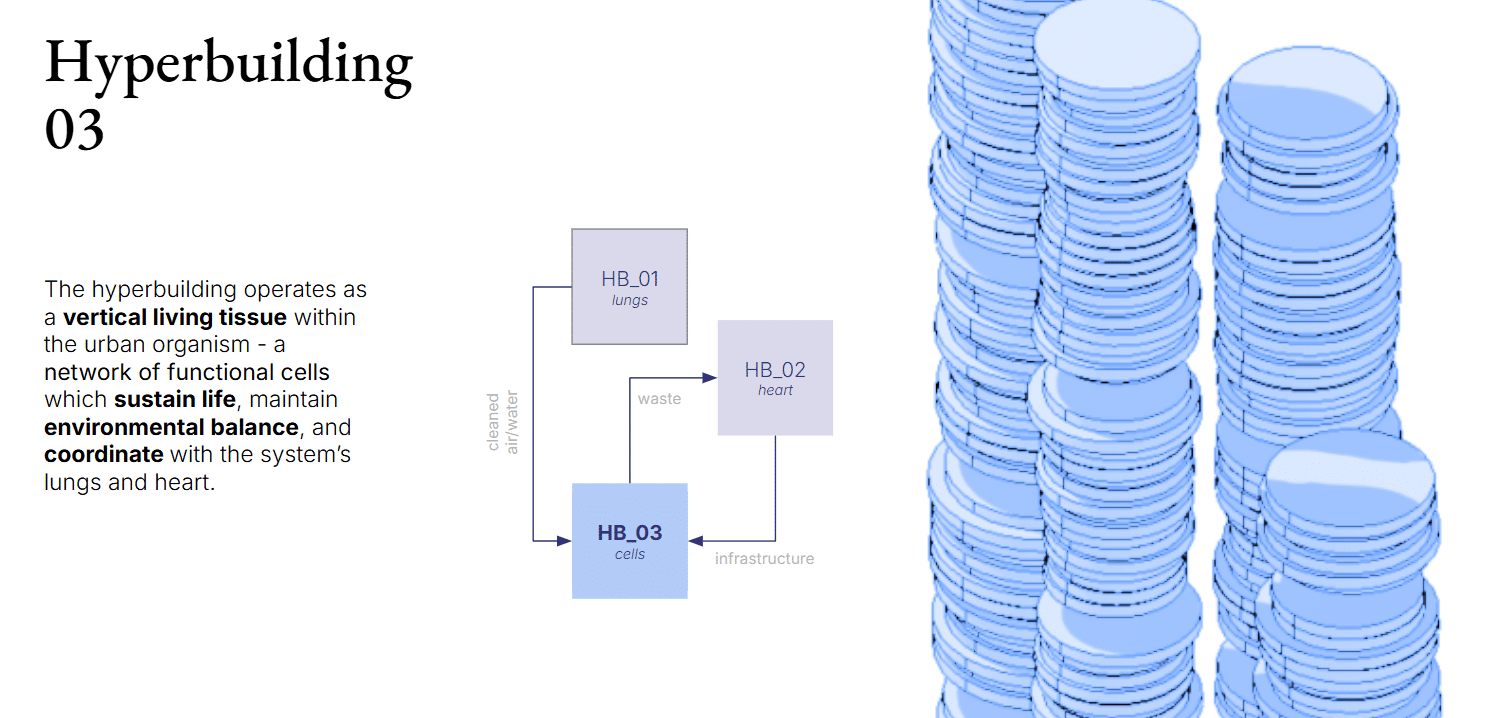
Hyperbuilding 03
In our project, the building is conceived not as an isolated object, but as a vertical living tissue within the broader human organism of the “Vertical Machine”. Much like a network of functional cells, it sustains life, maintains environmental balance, and coordinates with the system’s “lungs” and “heart.” This biological metaphor guided the performance metrics we chose to measure—metrics that capture interconnection, environmental responsiveness, and spatial well‑being.
Data System
Building Performance Analytics
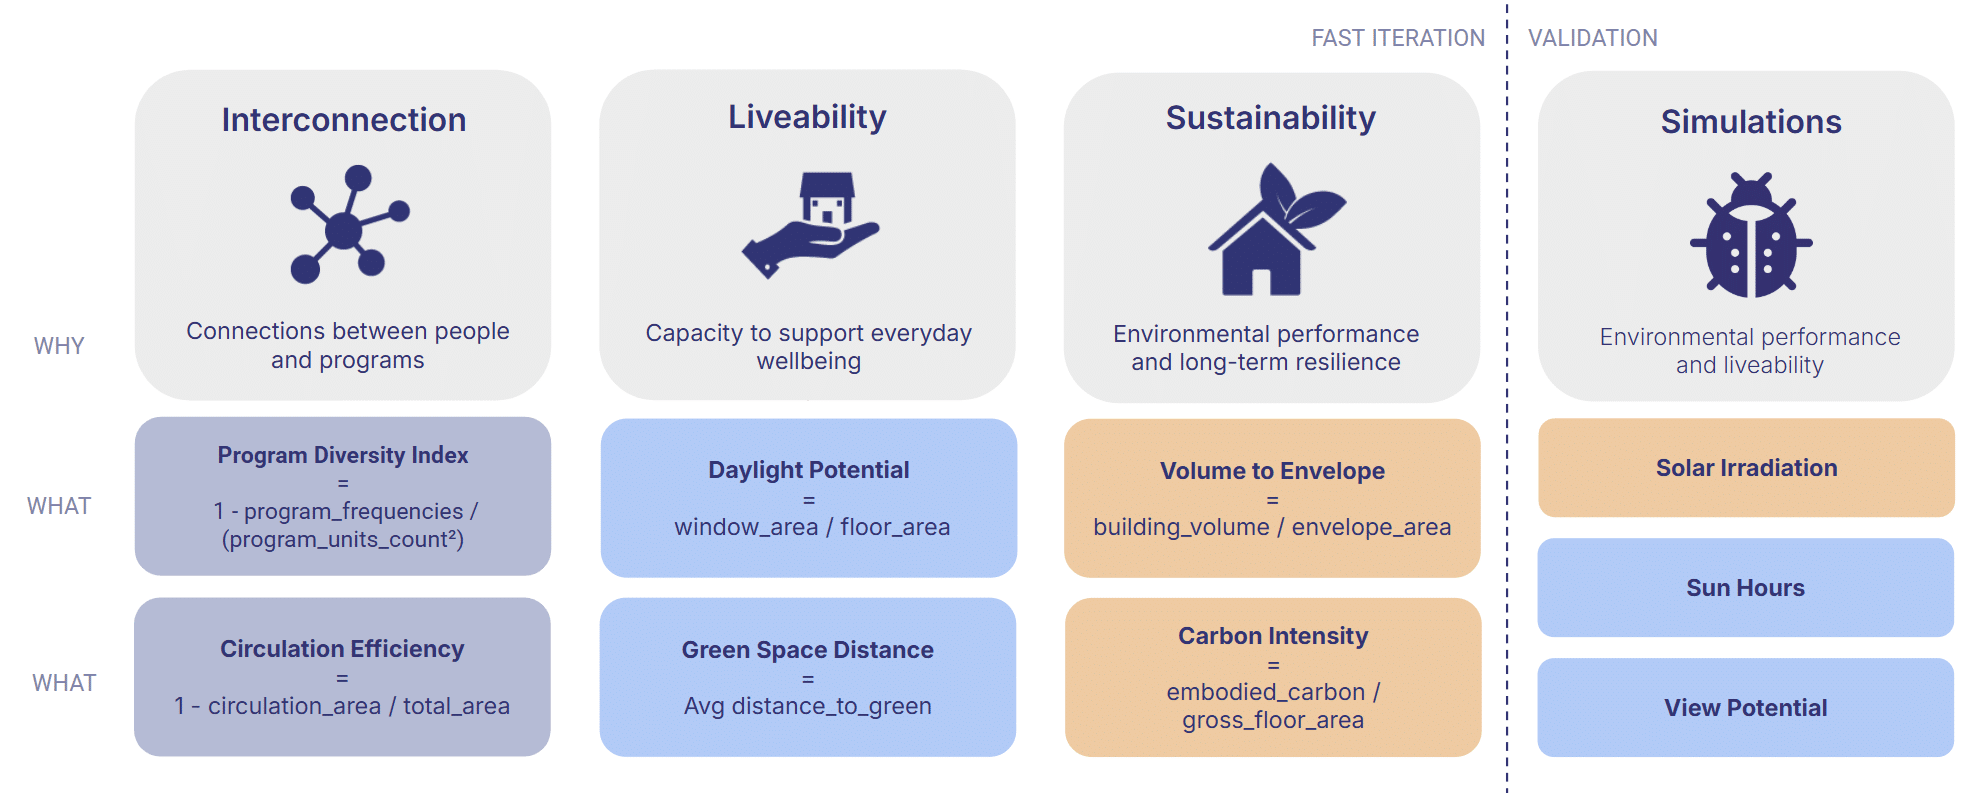
To understand the building’s role within its urban ecosystem, we evaluated:
- Interconnection, expressed through program diversity and circulation patterns
- Efficiency variability, measured through life‑potential indicators and proximity to green spaces
- Sustainability, assessed through volume‑to‑envelope ratios and carbon intensity
These fast‑to‑compute KPIs were complemented by a second layer of environmental simulations—more time‑intensive analyses that validate comfort, daylight, and overall well‑being.
Data Team Responsibilities
Our team was responsible for designing the entire data infrastructure that supports this workflow. This included:
- Establishing the data structure, naming conventions, and templates
- Automating the data flow across platforms
- Consolidating everything into a single source of truth
- Coordinating with all other teams to ensure consistency
- Developing the dashboard, the main interface for exploring KPIs in real time
The dashboard allows the team to navigate the building, compare scenarios, and understand performance at a glance.
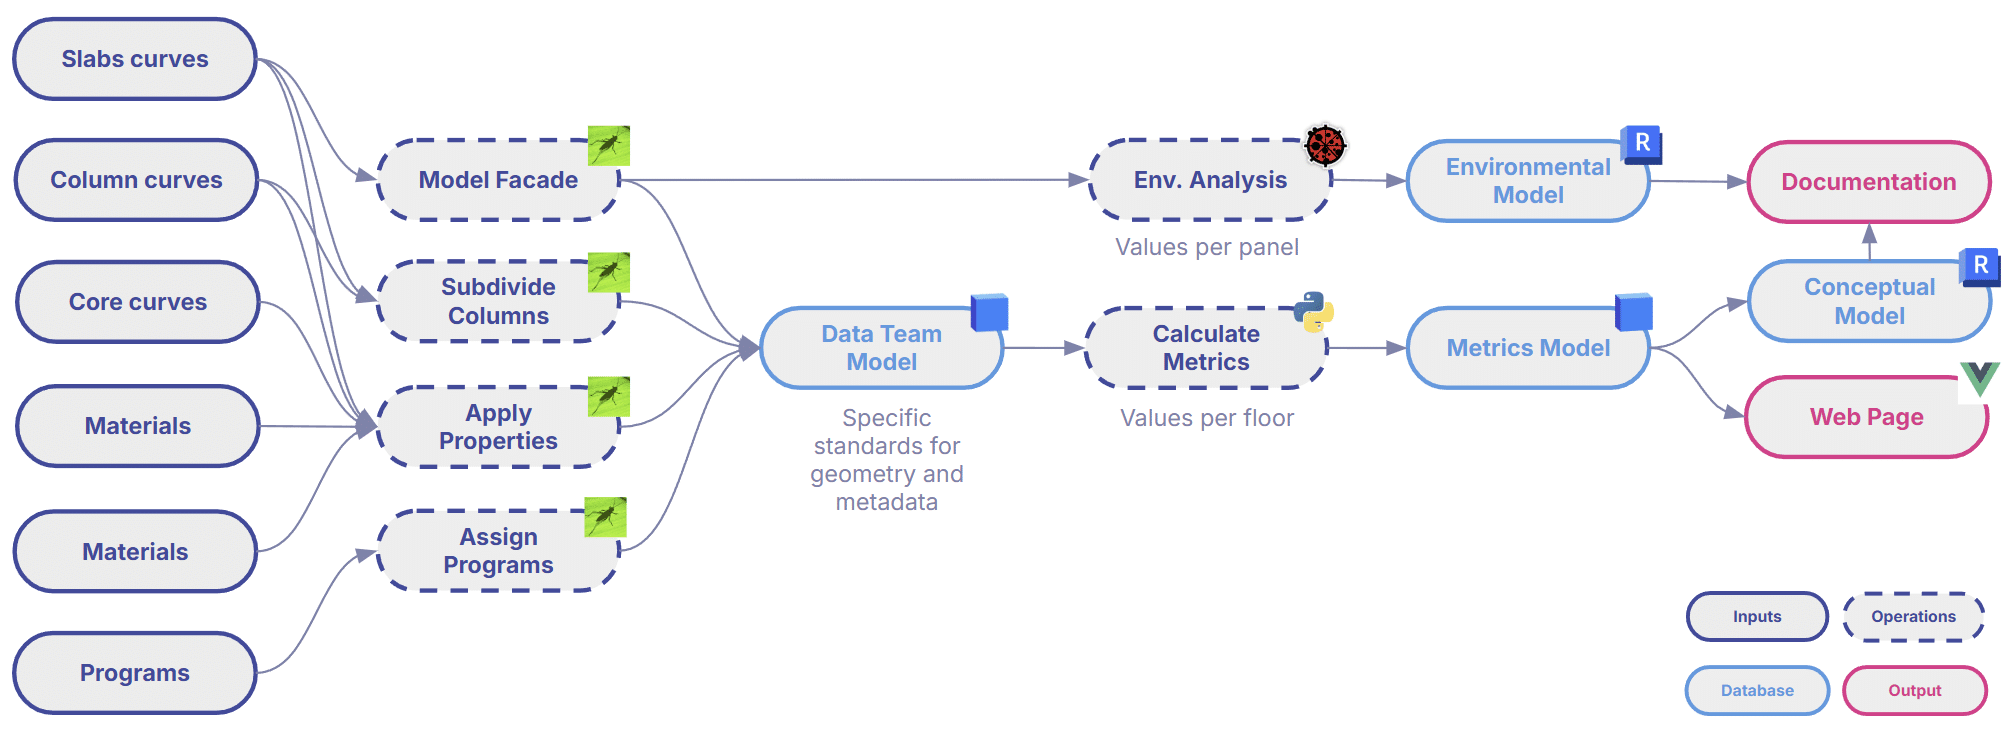
Data Flow
The process begins with a minimal set of inputs in Grasshopper: generative curves, materials, and progress definitions. From there:
- Geometry is enriched and assigned all necessary properties.
- The model is pushed to Speckle, which standardizes geometry and structured data.
- An automated KPIs engine calculates the metrics in real time and publish results to a new Speckle mode.
- The dashboard reads KPIs directly from the enriched Speckle model.
- Through Grasshopper and Revit Inside, both KPIs and simulations results are assigned to geometry and sent to Revit for documentation.
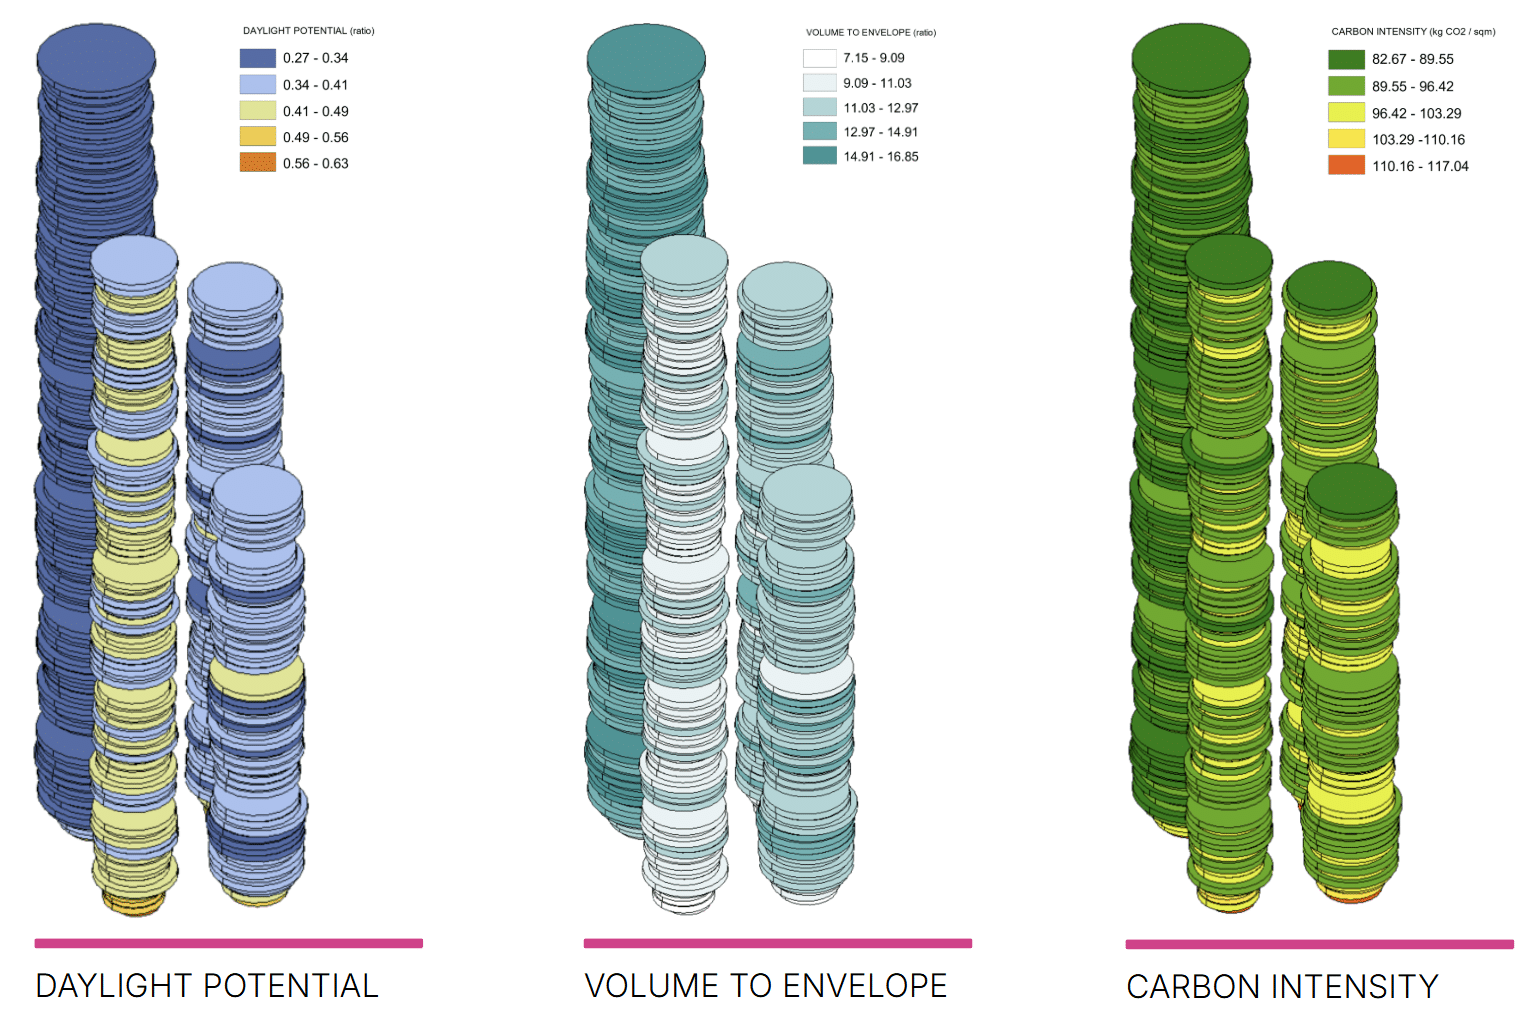
Data Representation
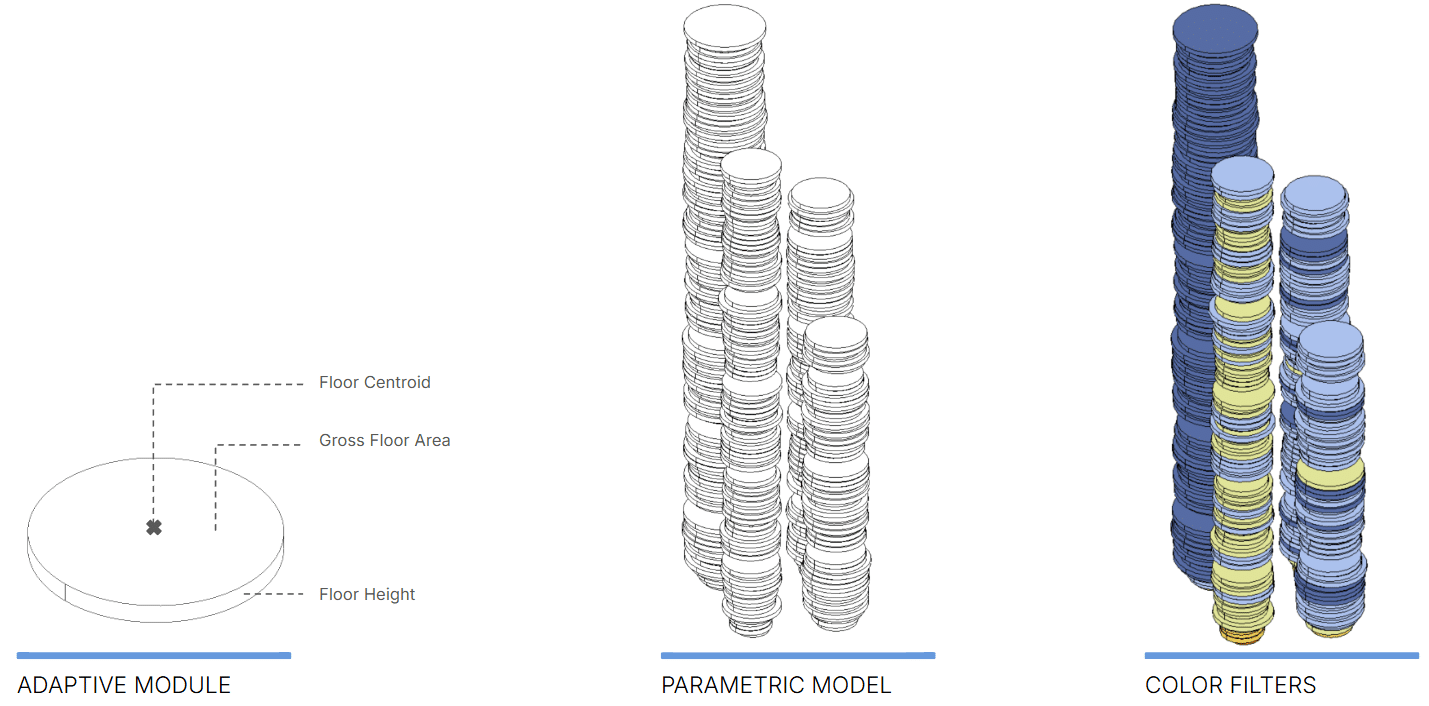
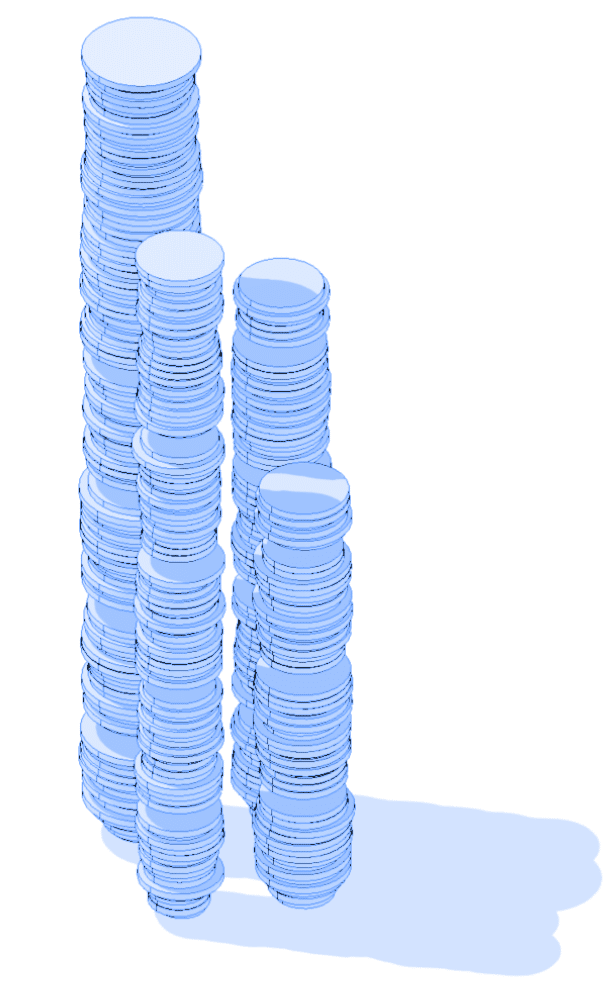
KPI Abstraction Model
In our first model, ach floor’s centroid coordinates, gross floor area, and floor‑to‑floor height drive an adaptive component that produces a clean, abstracted representation of the building. Color filters communicate the metric result for each floor clearly and intuitively:
- Daylight potential
- Volume‑to‑envelope ratio
- Carbon intensity
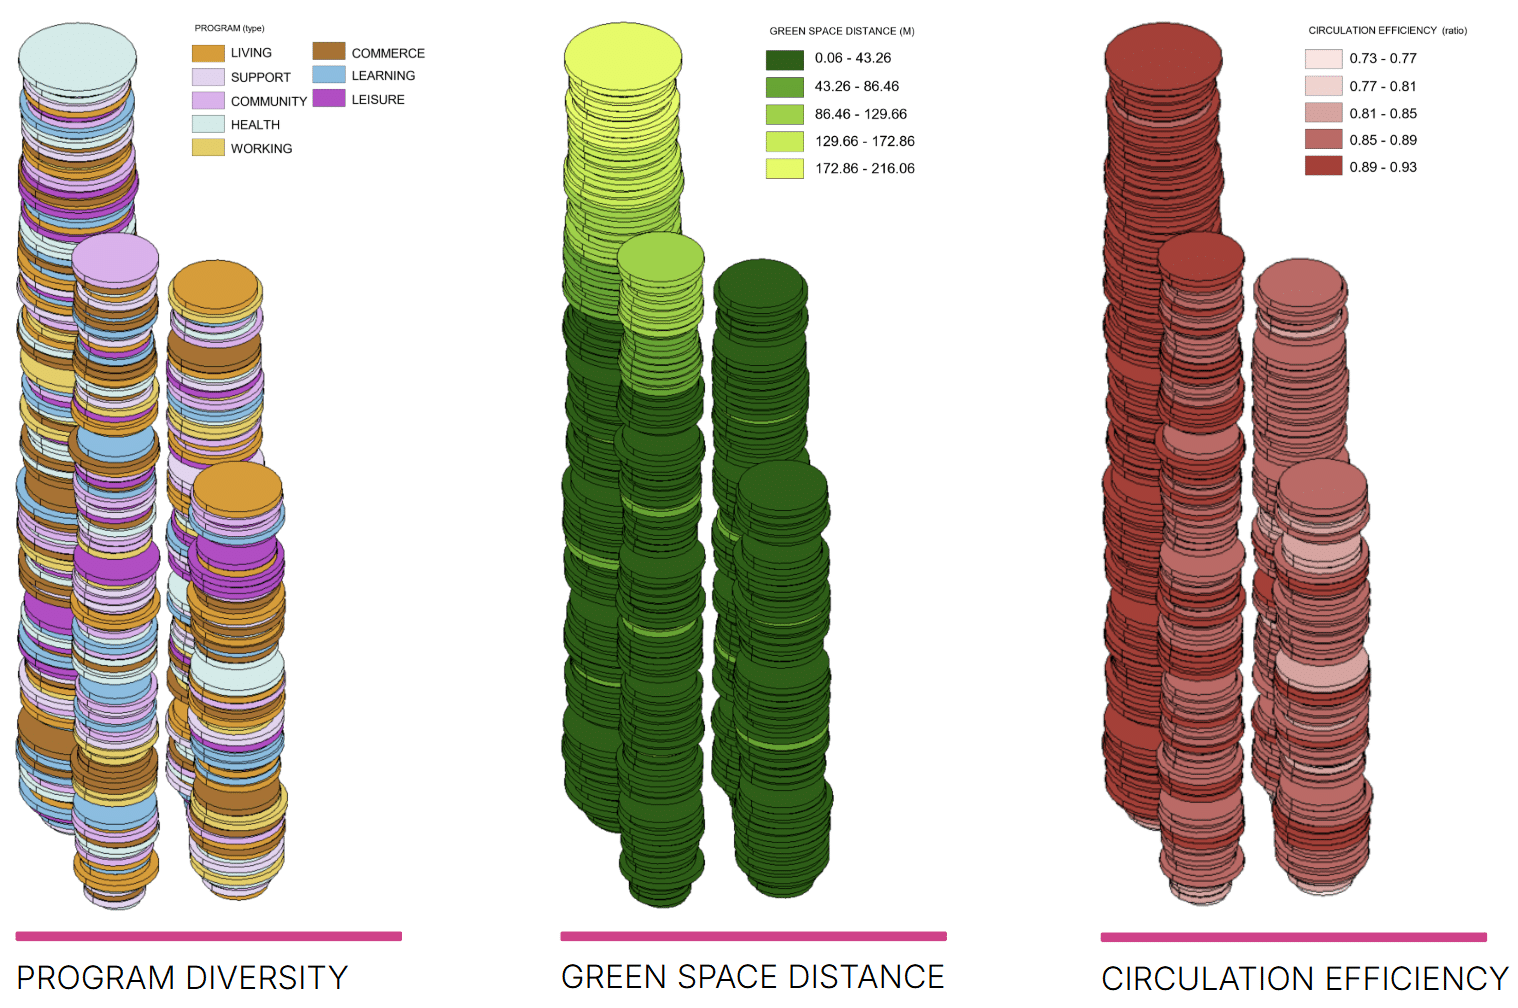
- Program type
- Distance to green spaces
- Circulation efficiency
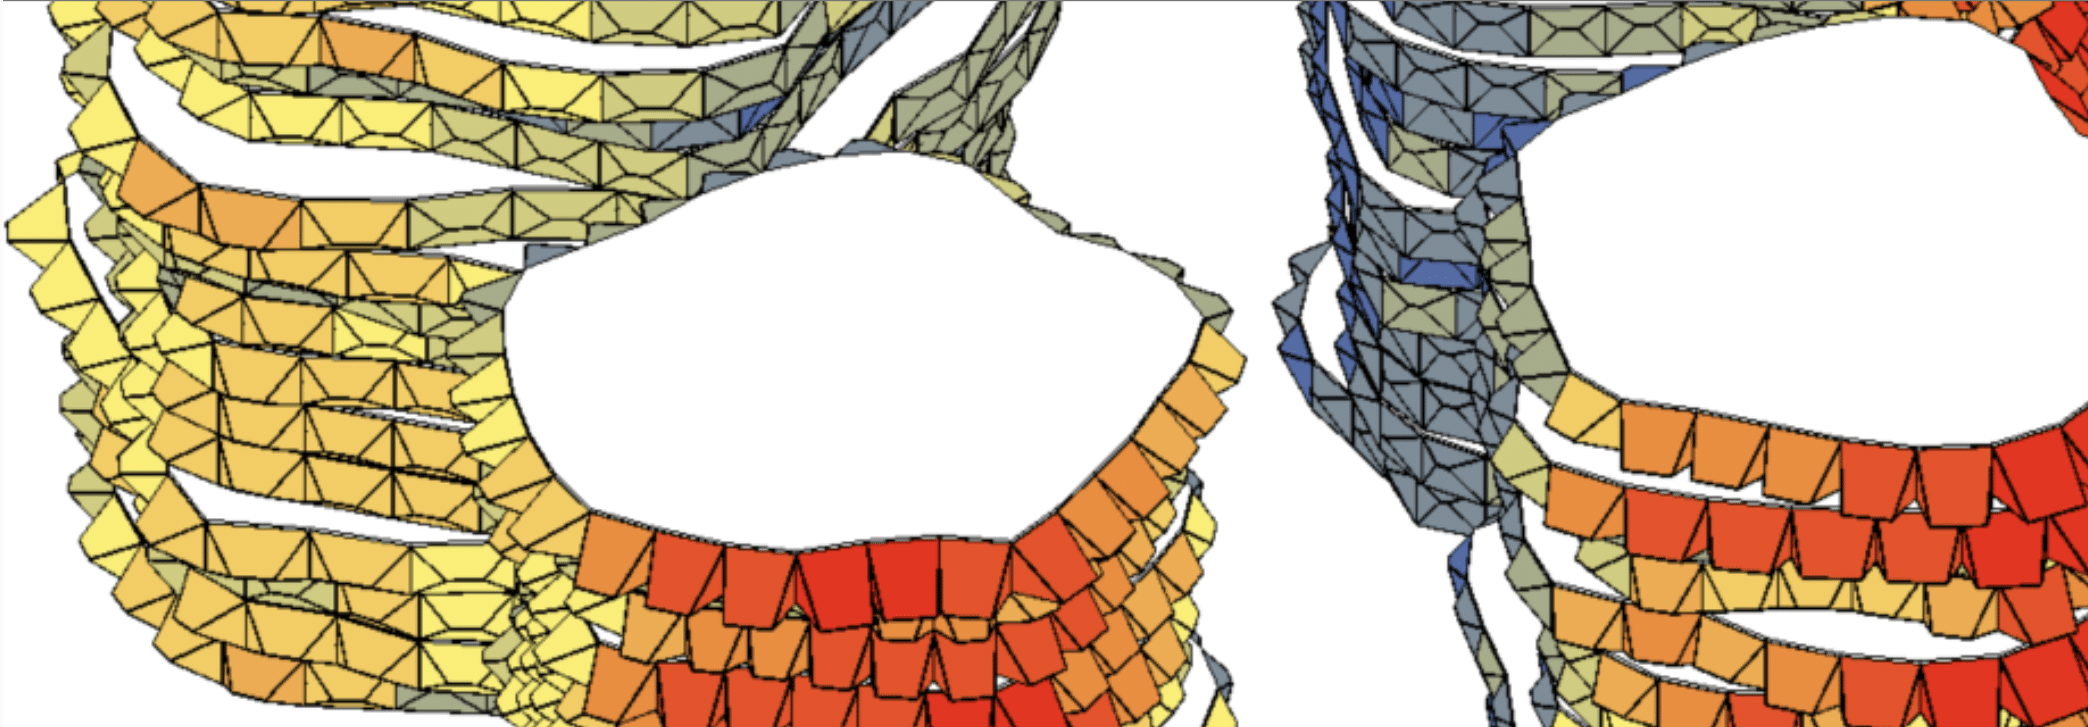
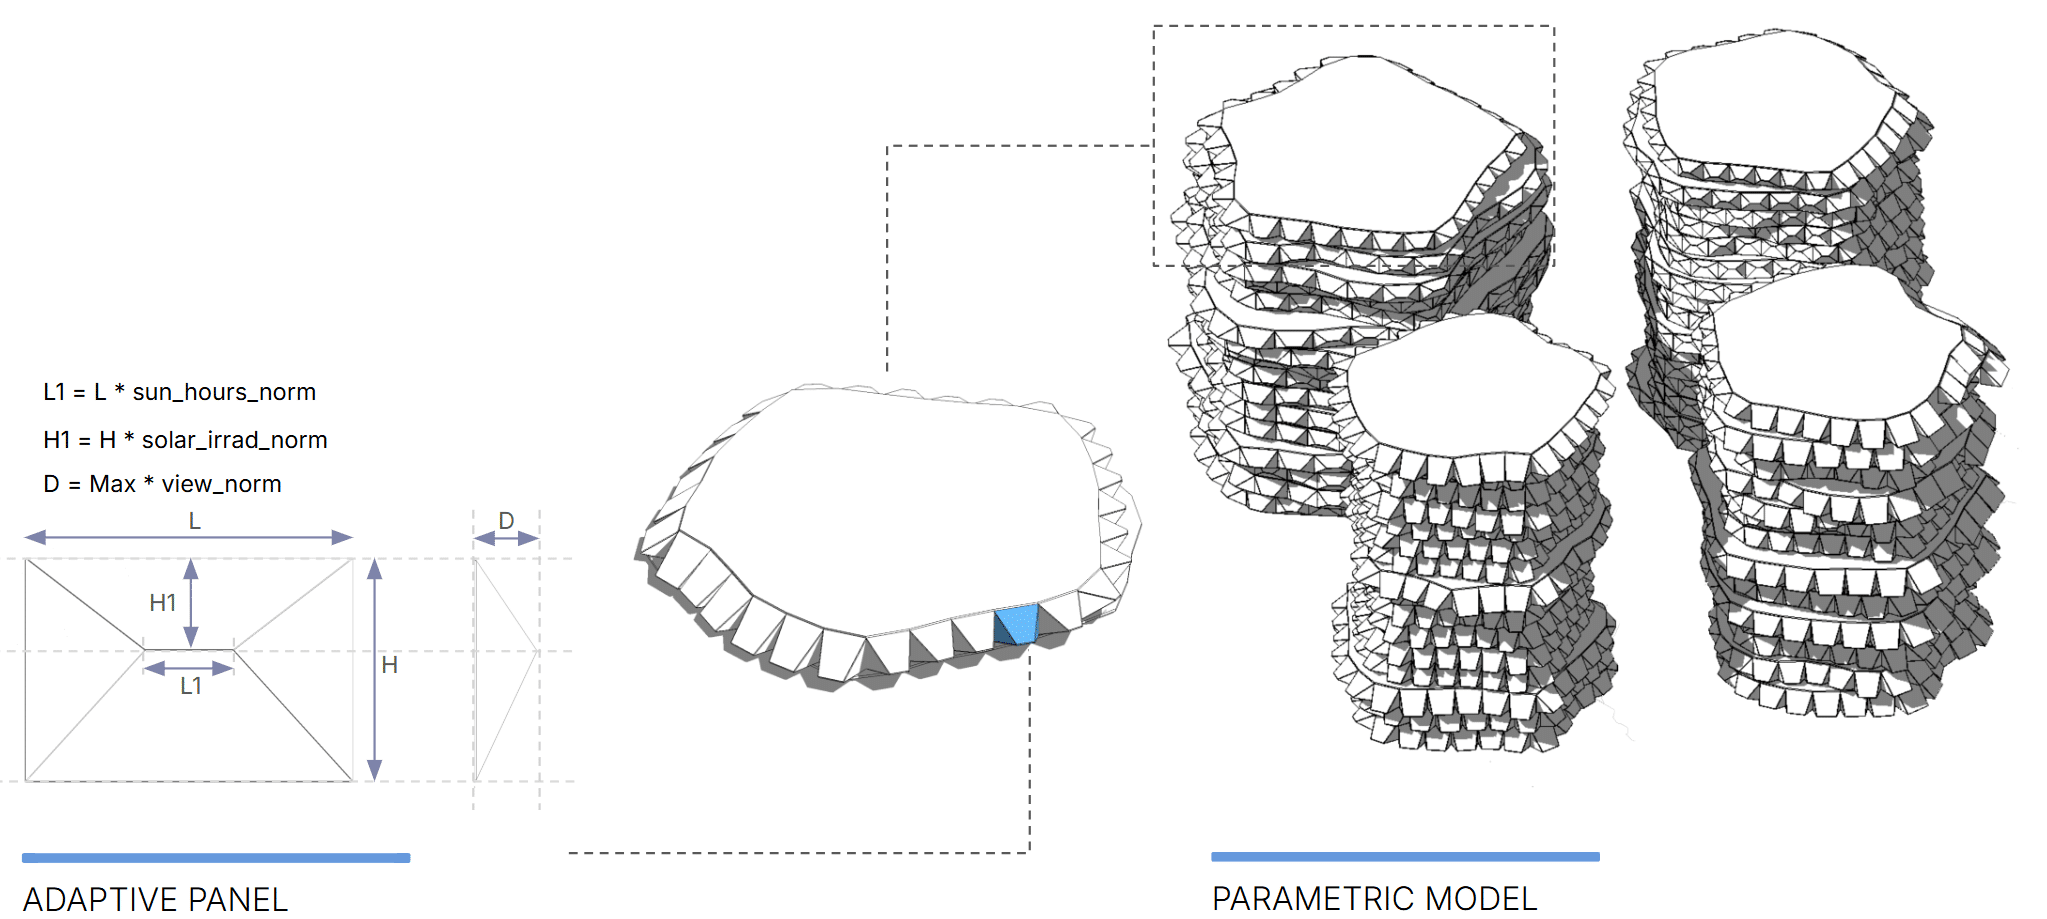
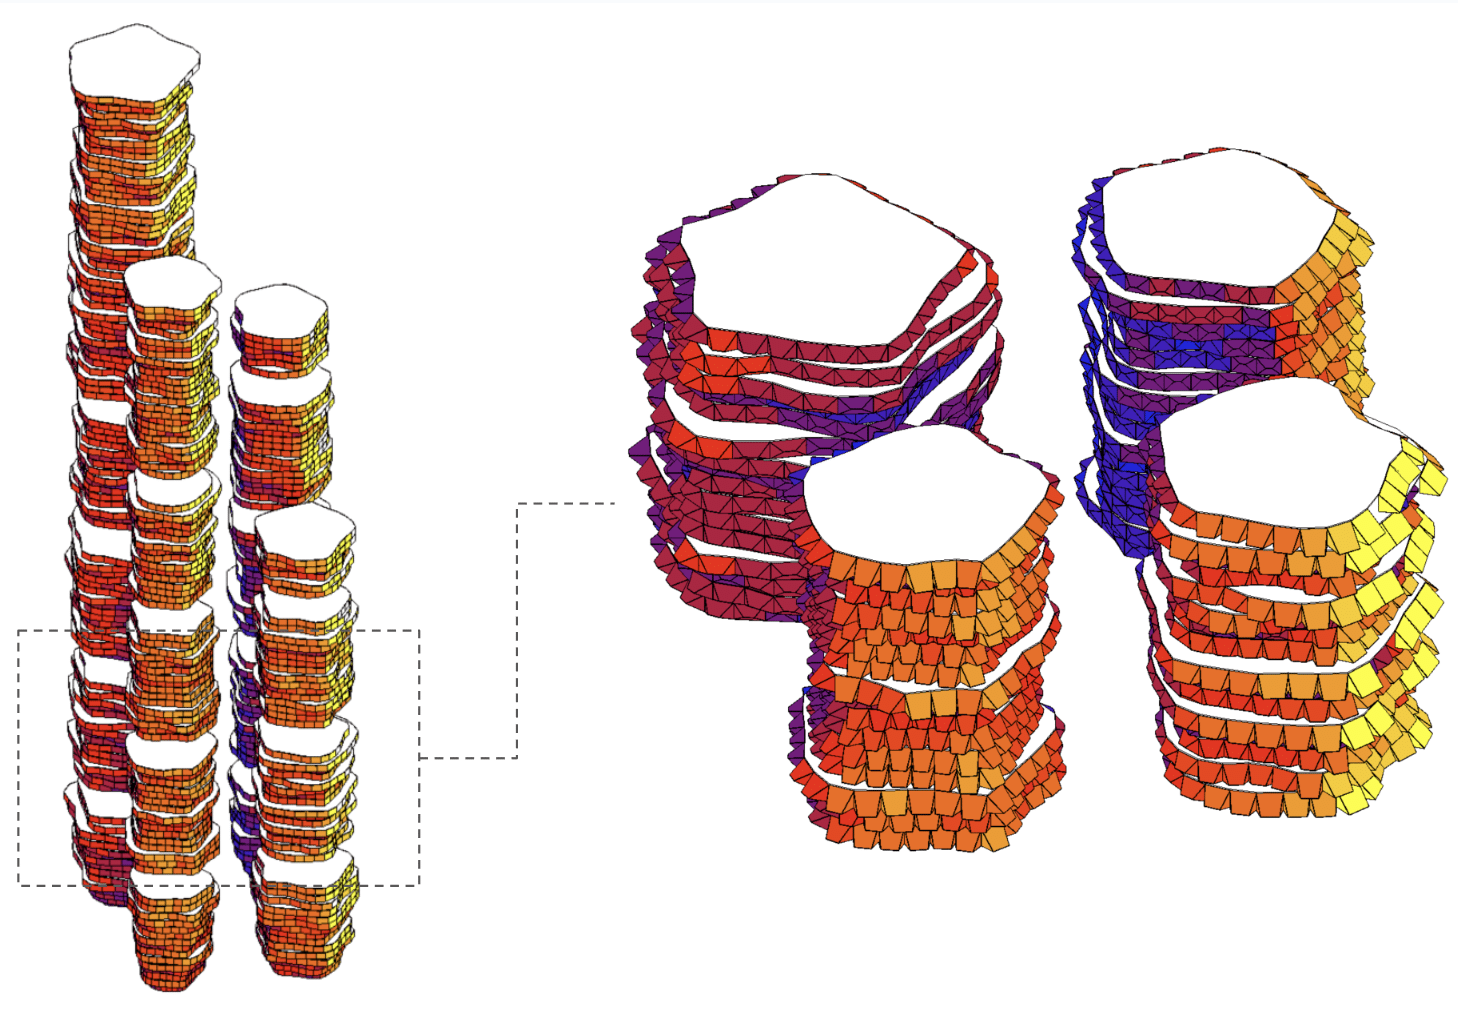
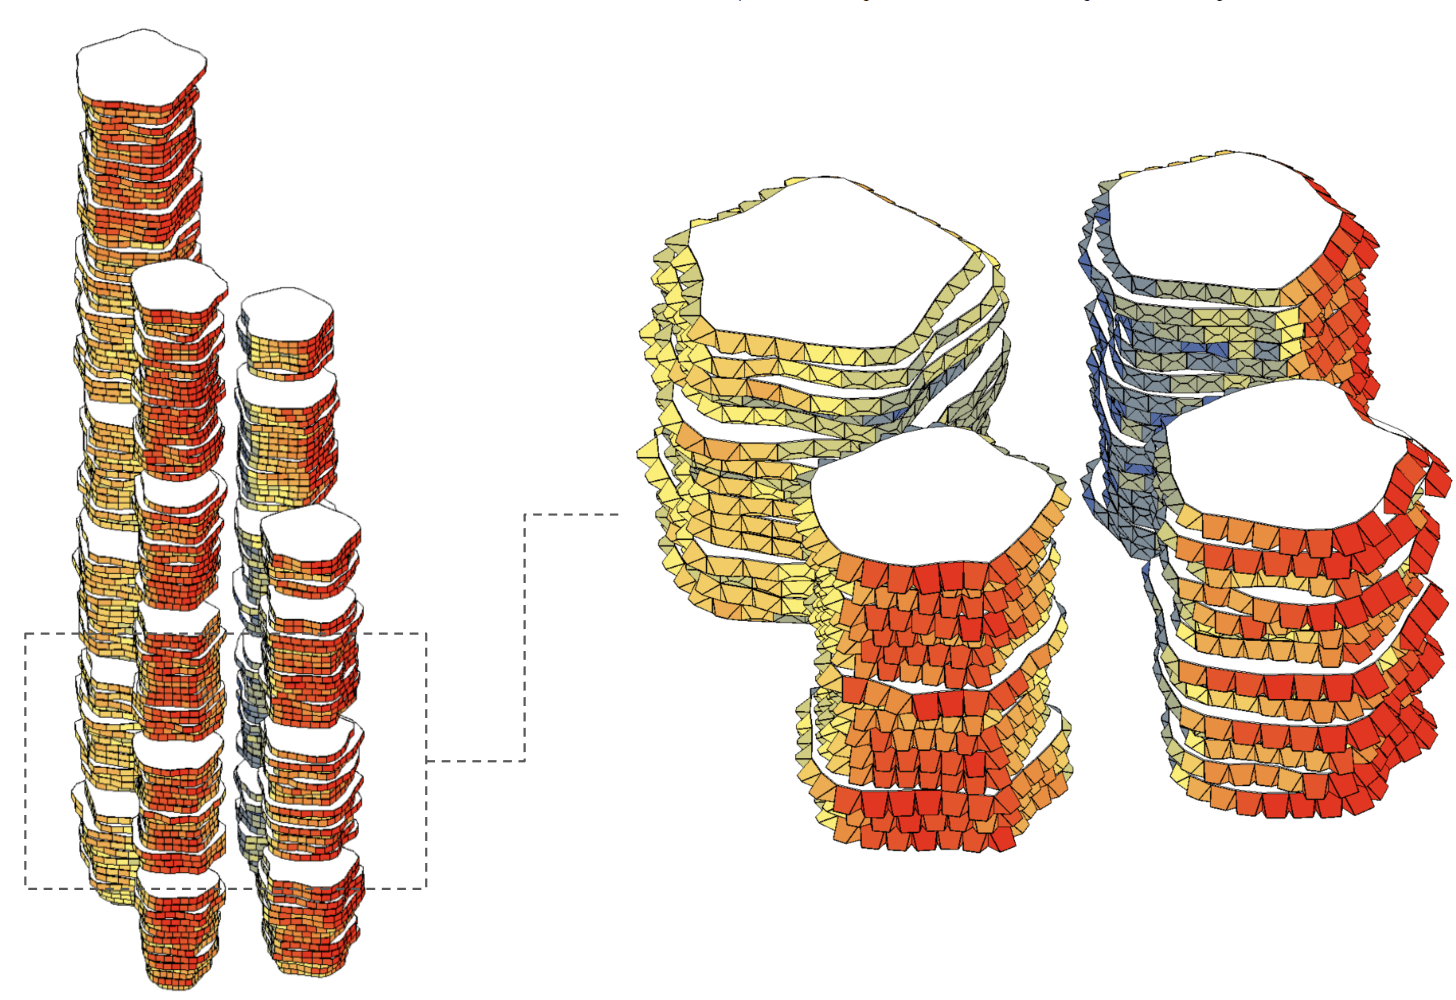
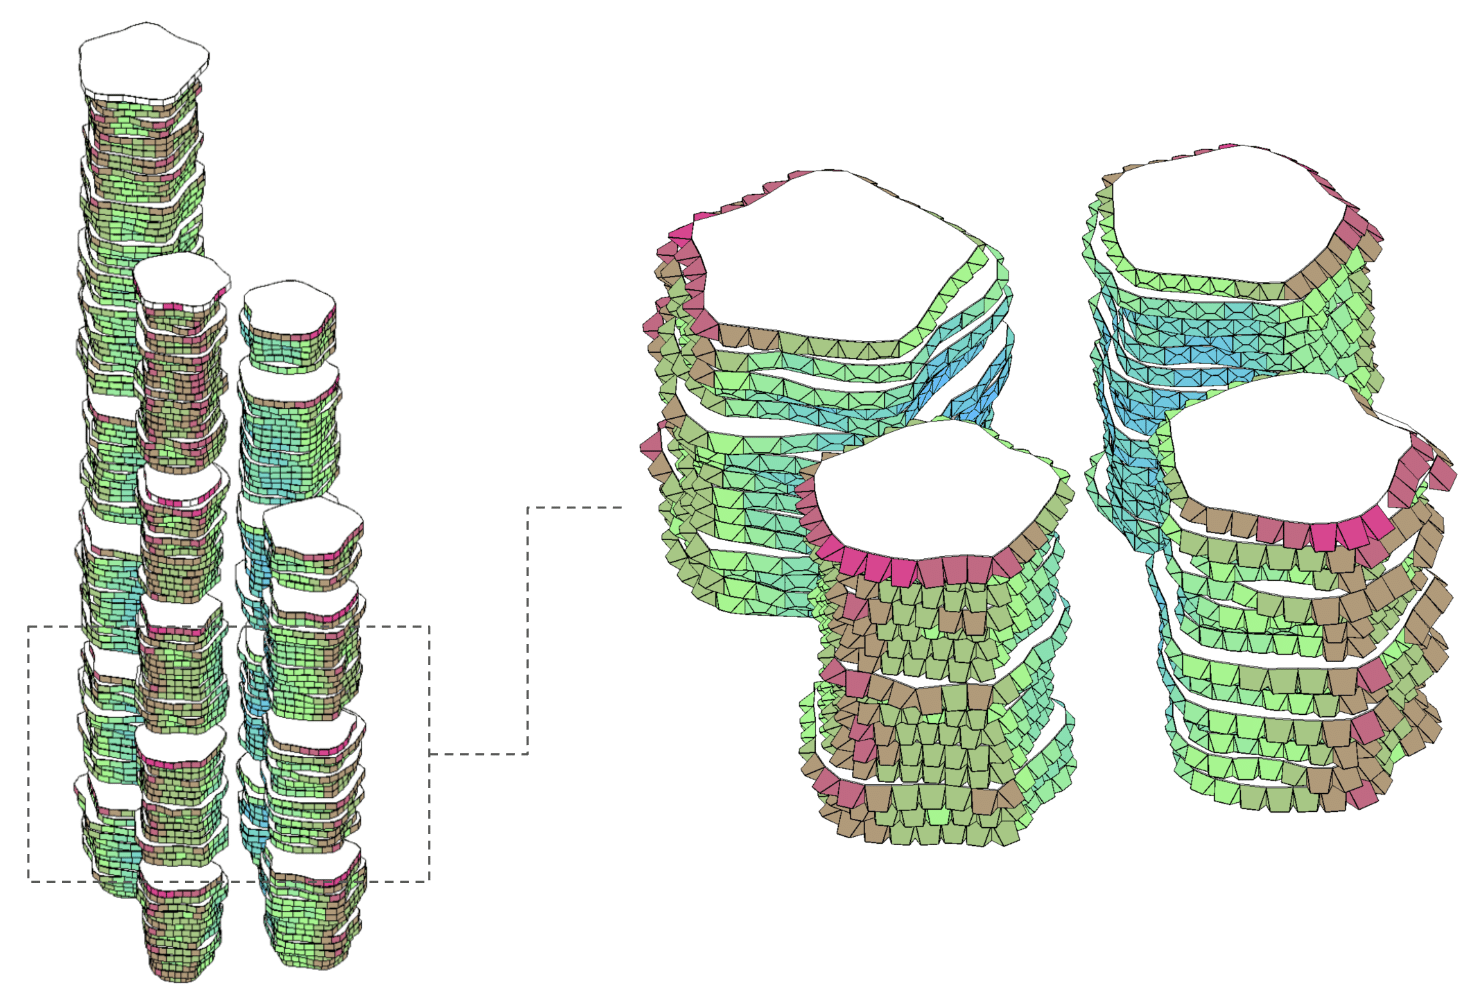
Facade Performance Representation
A second model handles the façade simulations. The façade panel—developed by the façade team—acts as a performance‑mapping device, translating environmental behaviour into geometry. Each panel responds to three parameters:
- Sun hours
- Solar irradiation
- View potential
This produces a façade representation that is visually expressive and directly informed by environmental performance, serving as a data‑driven abstraction rather than the final façade design.
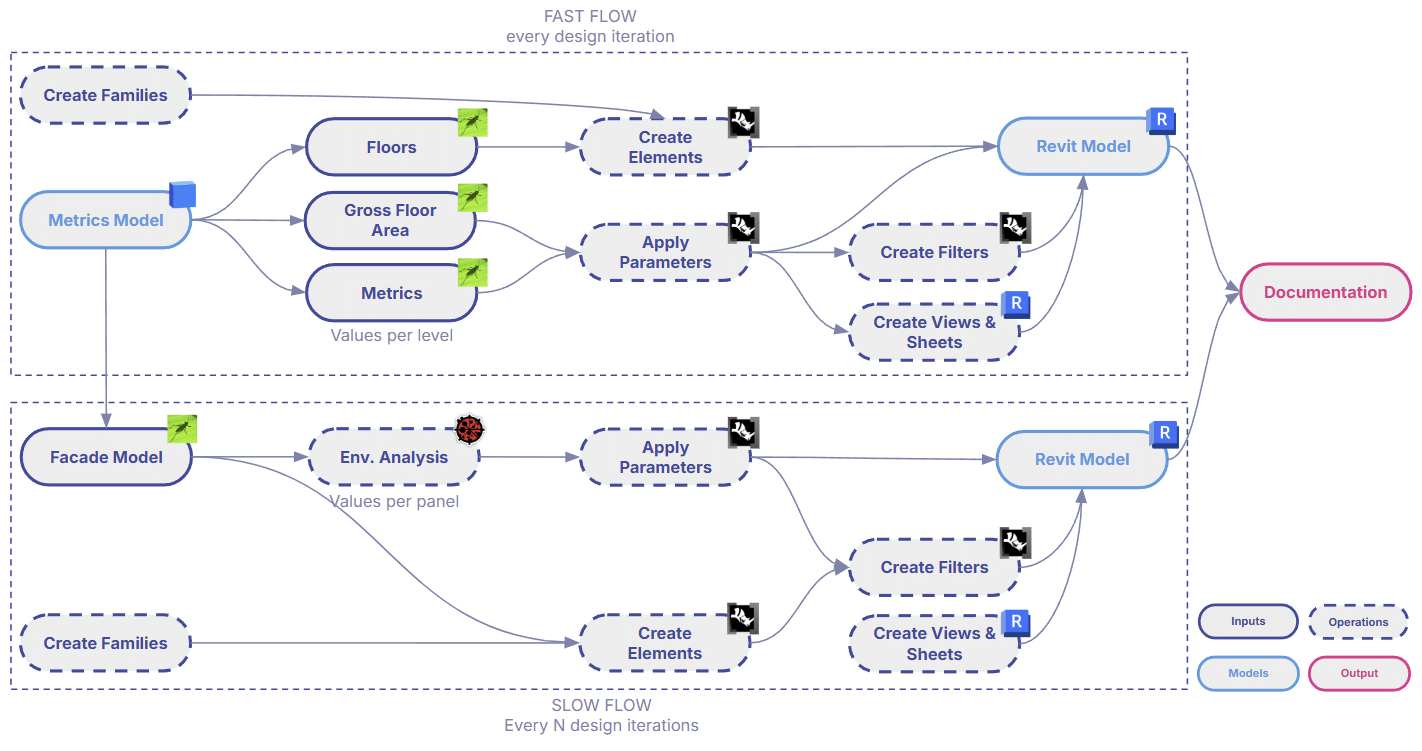
Methodology
The adaptive families earlier described are created in Revit, enriched with shared parameters. Then the fast (per-floor metrics) and the slow (facade simulations) flow follows four step each:
- Matrix model (Speckle) and facade model (Grasshopper) provide the base data.
- Floor‑level KPIs are abstracted from Speckle model Grasshopper.
- Panel‑level environmental metrics are computed using Ladybug Tools.
- Rhino.Inside is used to create the adaptive components from points, assign parameters, KPI results and environmental data zo each geometry.
- Rhino.Inside is used also for automatically generate color filters
- Revit generates views, schedules, sheets and organizes the visual narrative.
The output becomes a comprehensive documentation set: plans, axonometries, legends, and diagrams that tell the story of spatial and environmental performance.
Final Results
Massing-related KPIs
Program-related KPIs
Sun Hours
Solar Irradiation
View Potential
Together, these datasets form a sequential, integrated narrative of how the building performs and behaves.
Conclusions
Achievements
- Consistent ground‑truth data across platforms
- Automatic updates of the 3D model with each new version
- A unified workflow connecting generative design, simulation, and documentation
Limitations
- Environmental simulation and facade modeling require hours for every iteration
Next Steps
- Increase automation for faster iterations (automatically generate views and sheets)
- Develop further abstractions for more intuitive representation