PROBLEM
- Current maps are too coarse (250–1000 m scale). Cities map heat islands at city scale, missing micro-scale variations
- People experience heat at the street scale. Narrow streets and dense blocks can be several degrees hotter, unseen by satellites.
- Street-level temperatures vary by 5–12°C inside the same block, making coarse UHI maps insufficient for adaptation.
- Cities do not have accessible, scalable, and regularly updated Street-level heat maps that can guide where to plant trees, add shade, or protect vulnerable groups.
SOLUTION
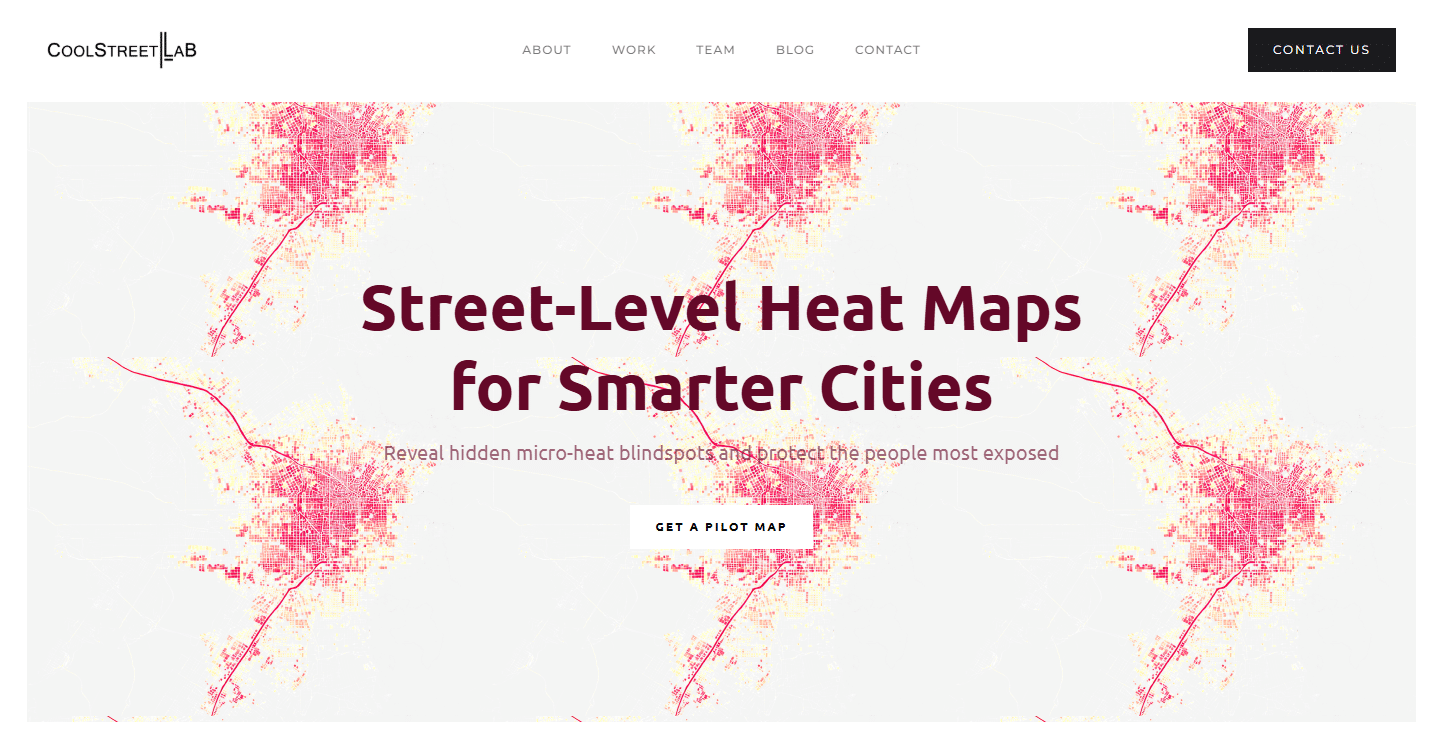
CoolStreets Lab provides scalable, practical micro-scale heat-risk maps that help cities identify where to cool, shade, and protect their most vulnerable areas.
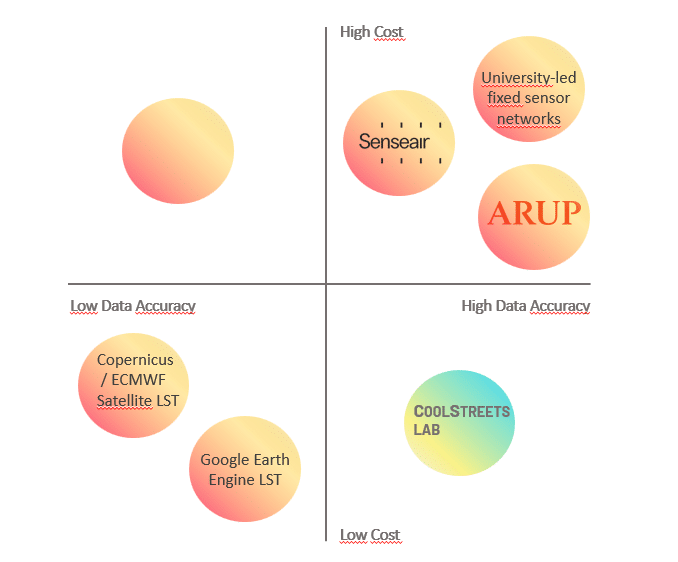
COMPETITION
- Satellites are coarse and miss street-level variation.
- Fixed sensors are accurate but expensive and not scalable.
- Consulting studies are slow, costly, and not repeatable.
BUSINESS MODEL
Target Customers
- City climate adaptation teams → need micro-scale heat data for shading, cooling, tree placement
- Urban resilience offices → must justify adaptation budgets with local-scale evidence
- Public-health departments → require heat-risk visibility for vulnerable groups
Business Model
- Per-project mapping fee → one-time micro-scale heat-risk mapping for a district/city
- Annual update subscription → yearly re-mapping to track changes & maintain up-to-date risk layers
- Sensor integration add-on → cities that want their own fleet get installation + calibration support
Early Validation
Expert Interviews
- 4 climate-adaptation and urban-environment experts
- All confirmed a data gap at the street-level scale
Key Insight
- Traditional UHI maps miss 5–12°C micro-scale variations, this directly affects shading, tree placement and cooling strategies.
Municipality Feedback
- One adaptation team expressed interest in using mobile heat-risk layers
- Validation that cities lack fine-grained data for prioritising interventions
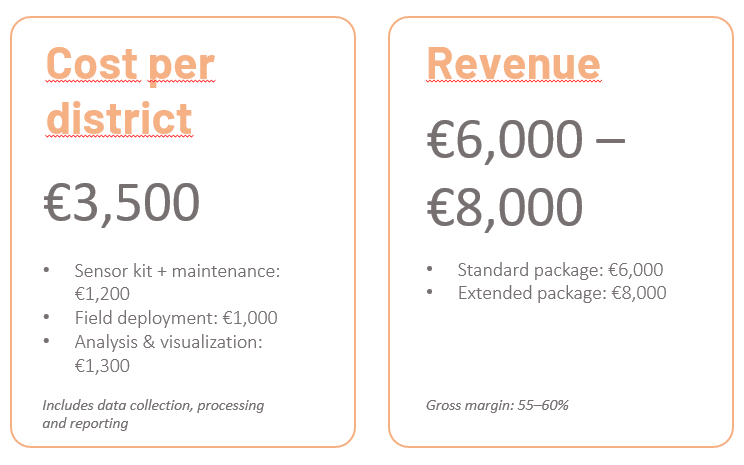
Unit Economics
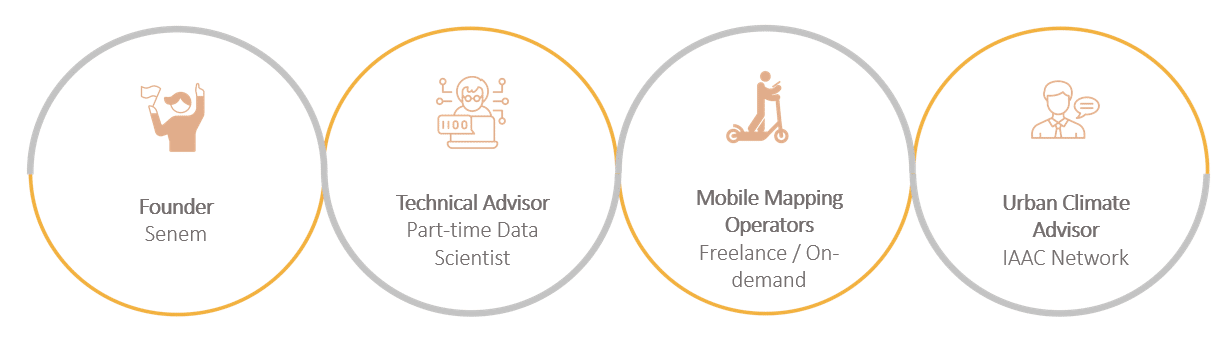
TEAM
FUNDING NEED
WHAT THIS COVERS
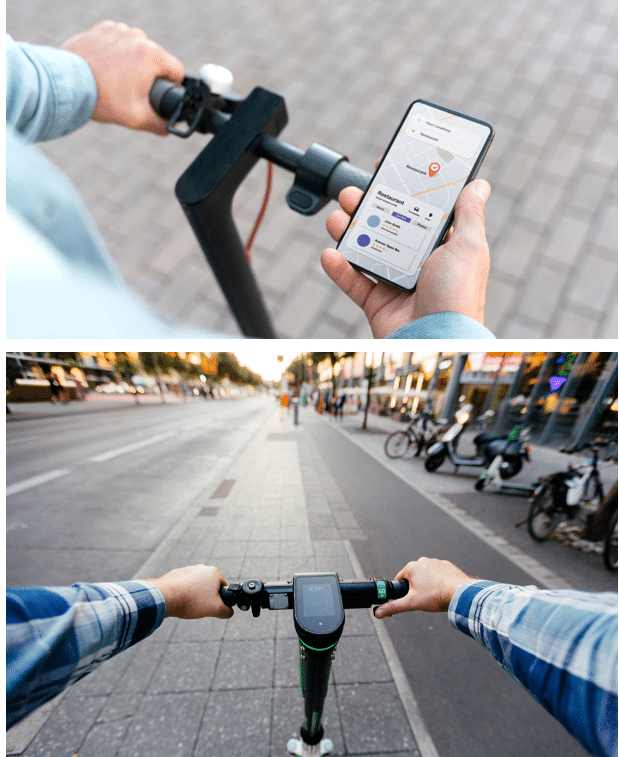
- Sensors + calibration
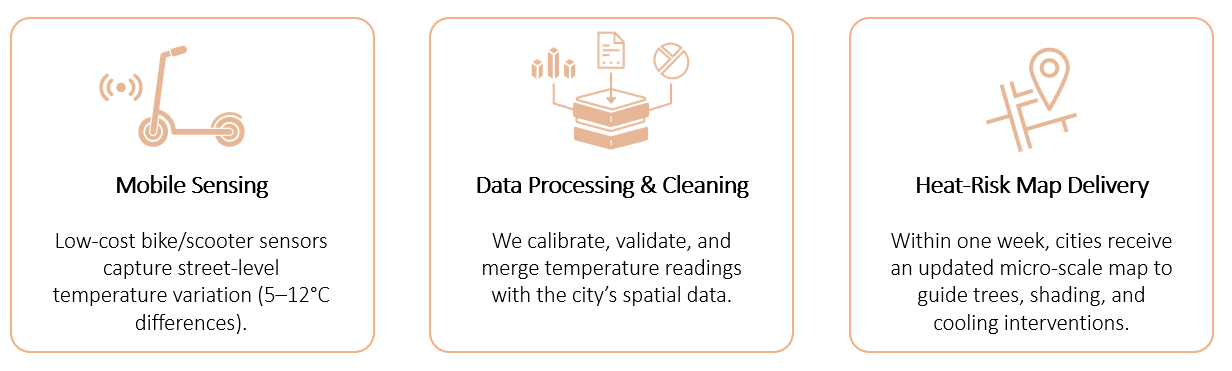
- Field operators (bike/scooter runs)
- Data processing (cloud + advisory)
- 1 complete district-scale heat-risk map
- Public-facing pilot summary
WHY THIS AMOUNT
This is the minimum budget required
to validate the sensing workflow, map
delivery pipeline, and 1-week turnaround
model.
RUNWAY & OUTCOME
- Validated sensing methodology
- Standardized “1-week map package”
- Testimonials + early metrics
- Basis for annual subscription model
- Clear cost structure for scale-up
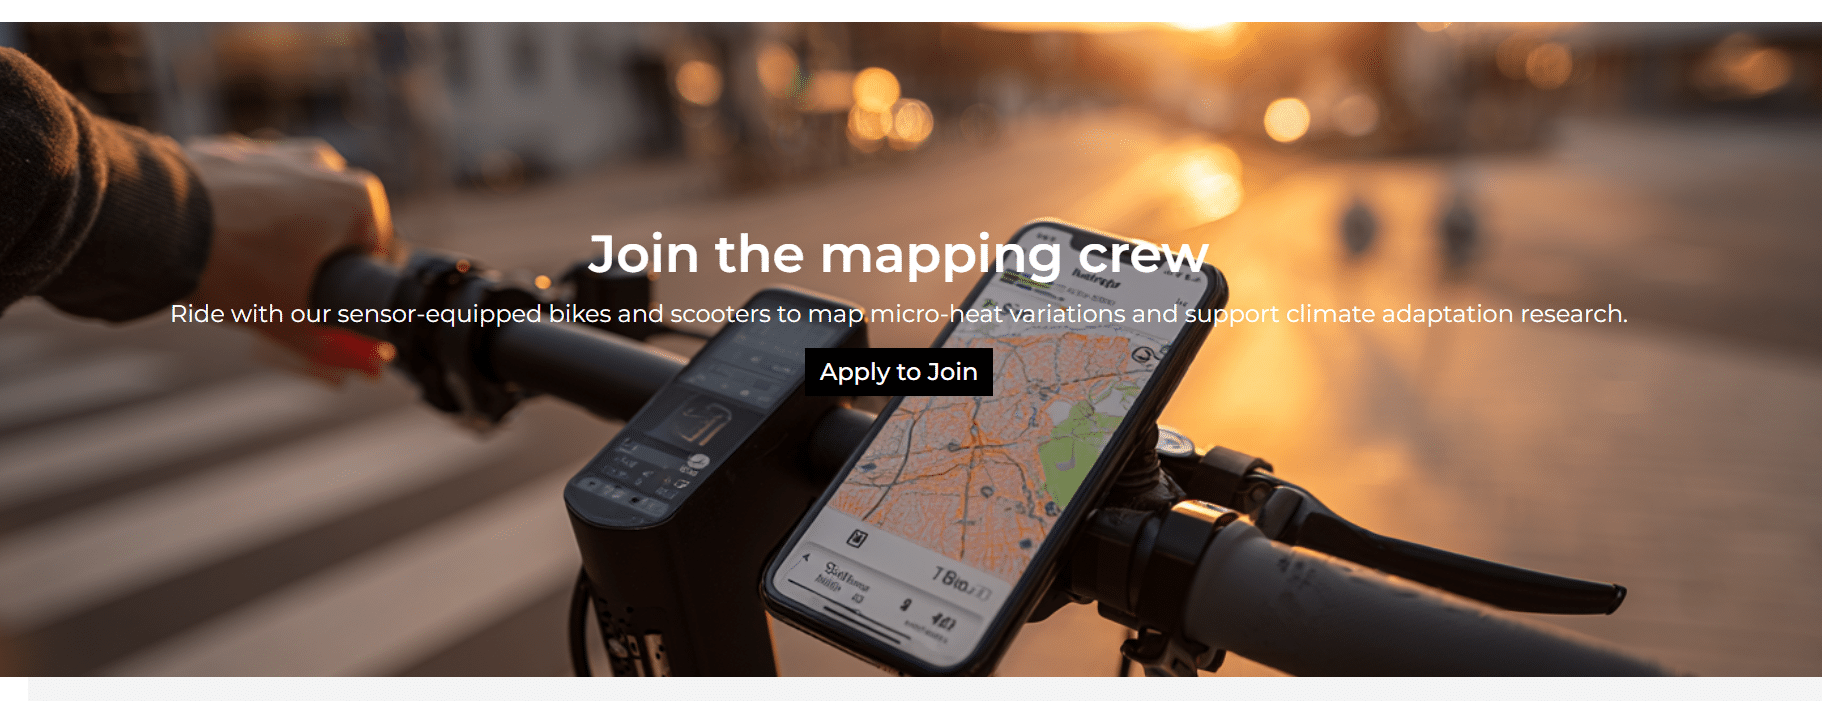
CALL TO ACTION