
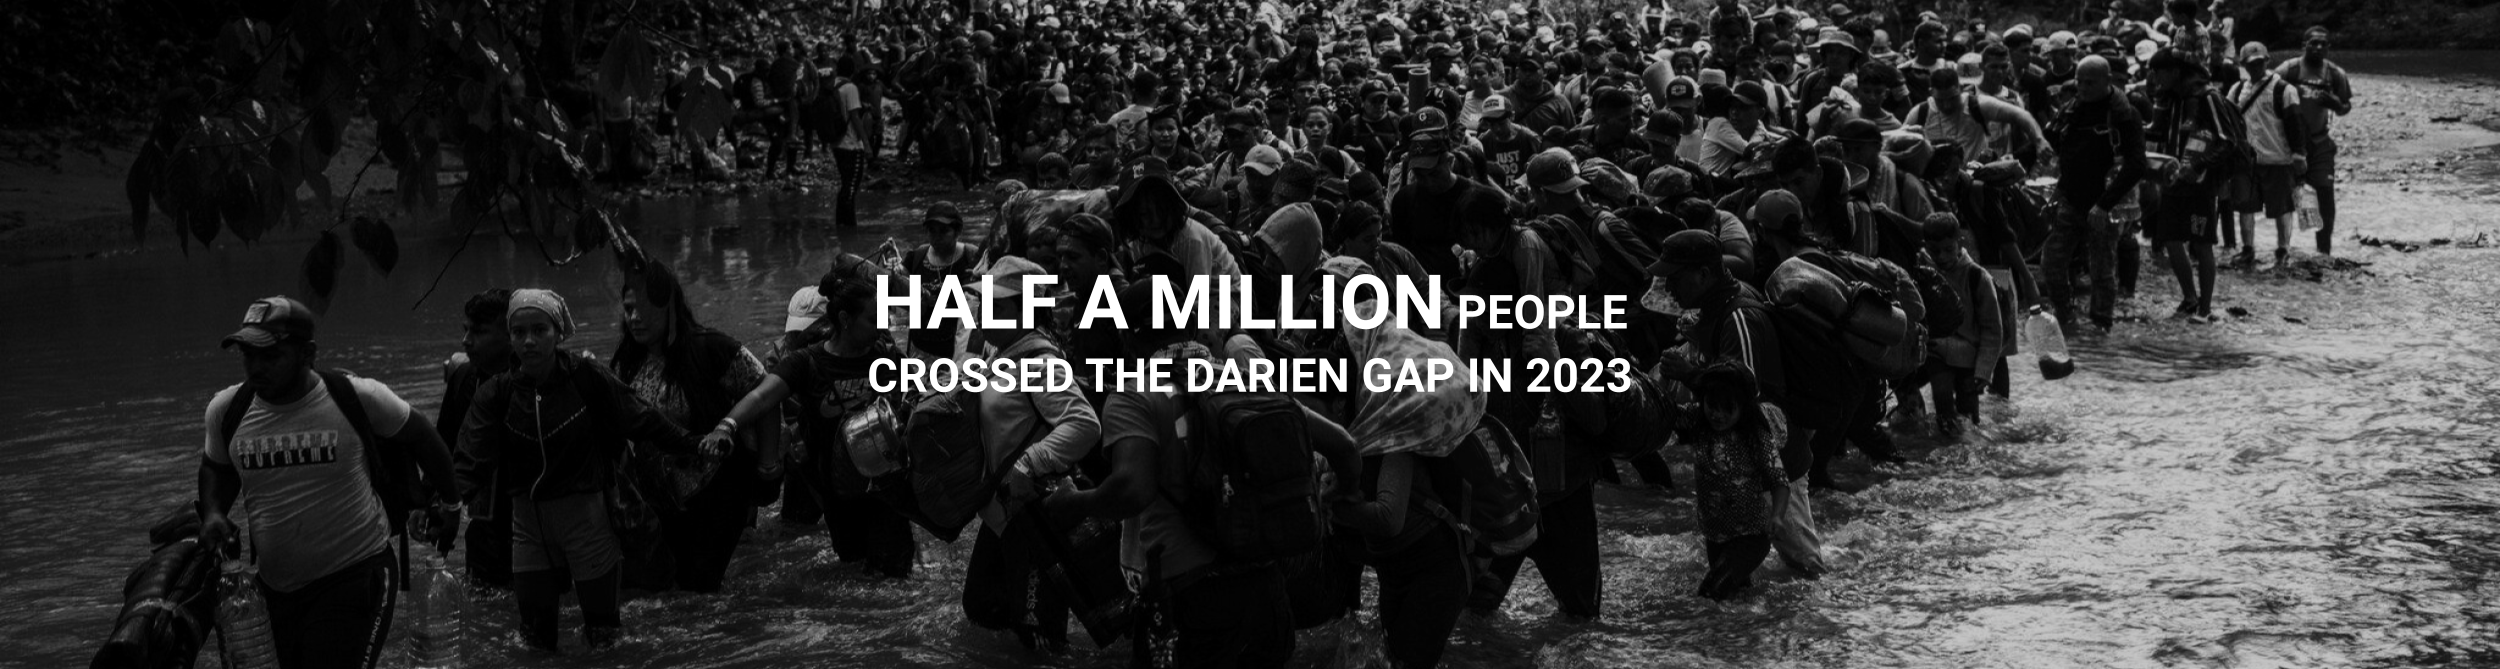
Imagine a massive highway stretching from Alaska all the way down to the tip of Argentina. That’s almost possible through the Pan-American Highway, except for one crucial interruption: the Darien Gap. The Darien Gap is a sprawling, dense jungle separating Panama and Colombia, an obstacle that breaks the otherwise continuous highway. But the Gap isn’t just a missing stretch of asphalt. In 2023 alone, over half a million people decided to trek through this terrain1 to get, mostly, to the United States. As of today, the Darien Gap is one of the most critical migration paths in America.
However, despite the high traffic in the area, most of the migrants embark on their journeys with limited knowledge of the real conditions and hazards that they will face on the trail. Multiple testimonies reveal a lack of awareness regarding the length of the journey, the physical demands, and the financial resources needed to survive.
This information gap has devastating consequences. Many embark on the trek unprepared, lacking the proper supplies and facing financial stress that can disable their progress. The true cost (both emotional, physical, and financial) of crossing the Darien Gap remains blurry, adding another layer of risk to this migration route. According to Doctors Without Borders2, just in the first half of 2023, there were 35,912 medical consultations including 673 pregnant women and 206 cases of sexual violence.

How can we use mapping to support informed decision-making for migrants and institutions involved in the Darien Gap?
Methodology
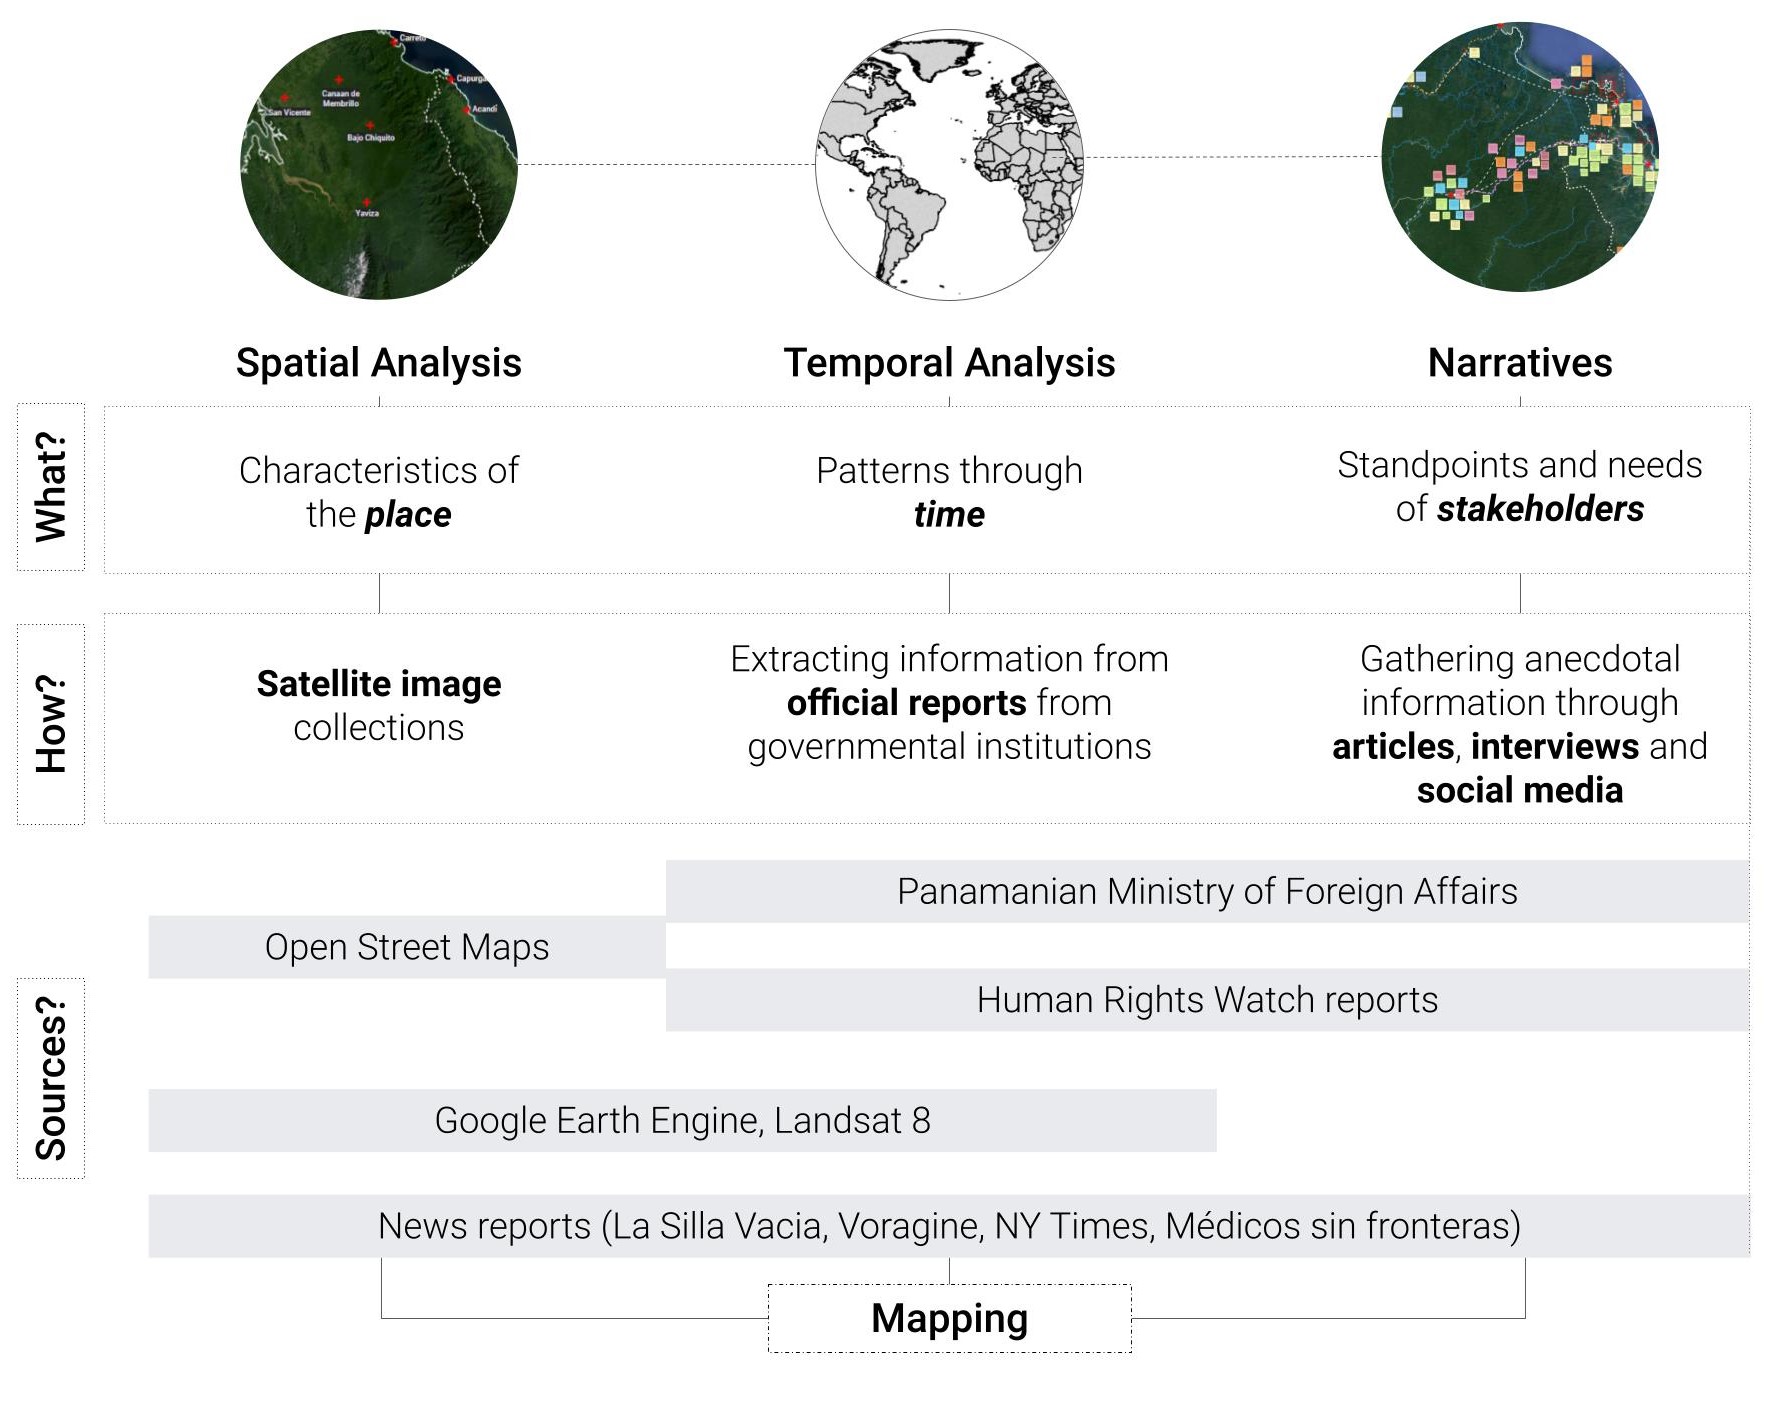
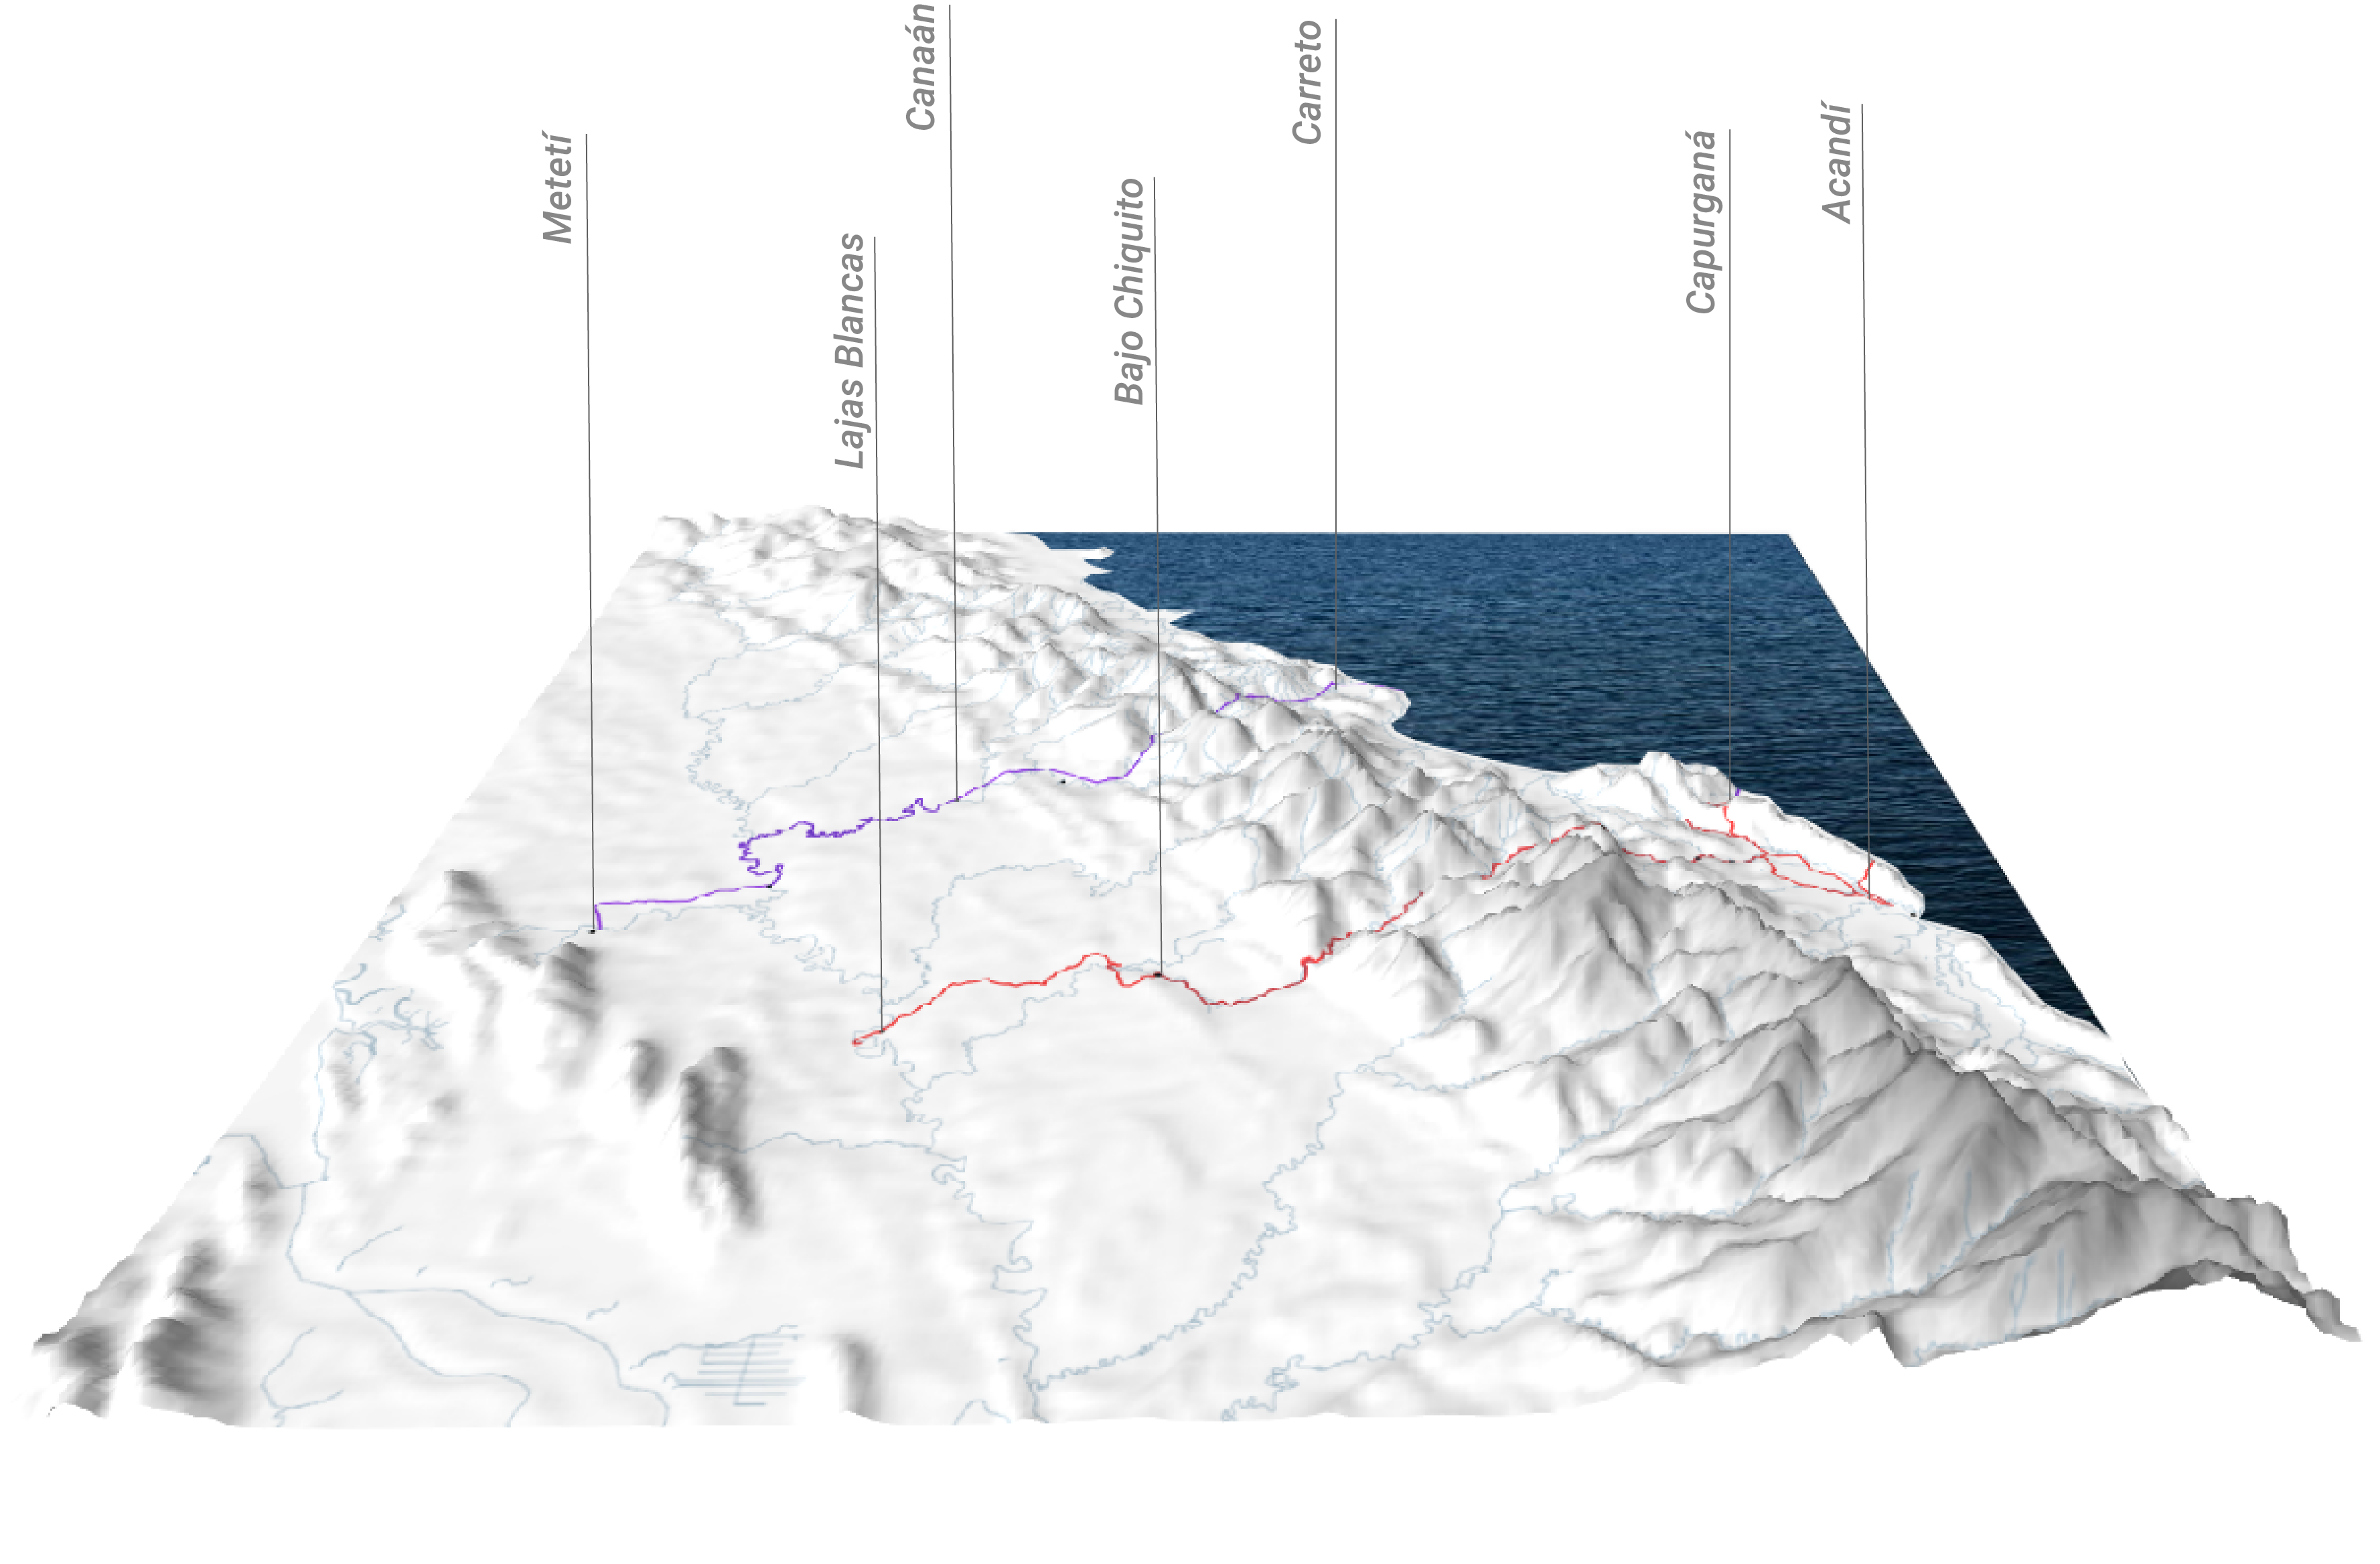
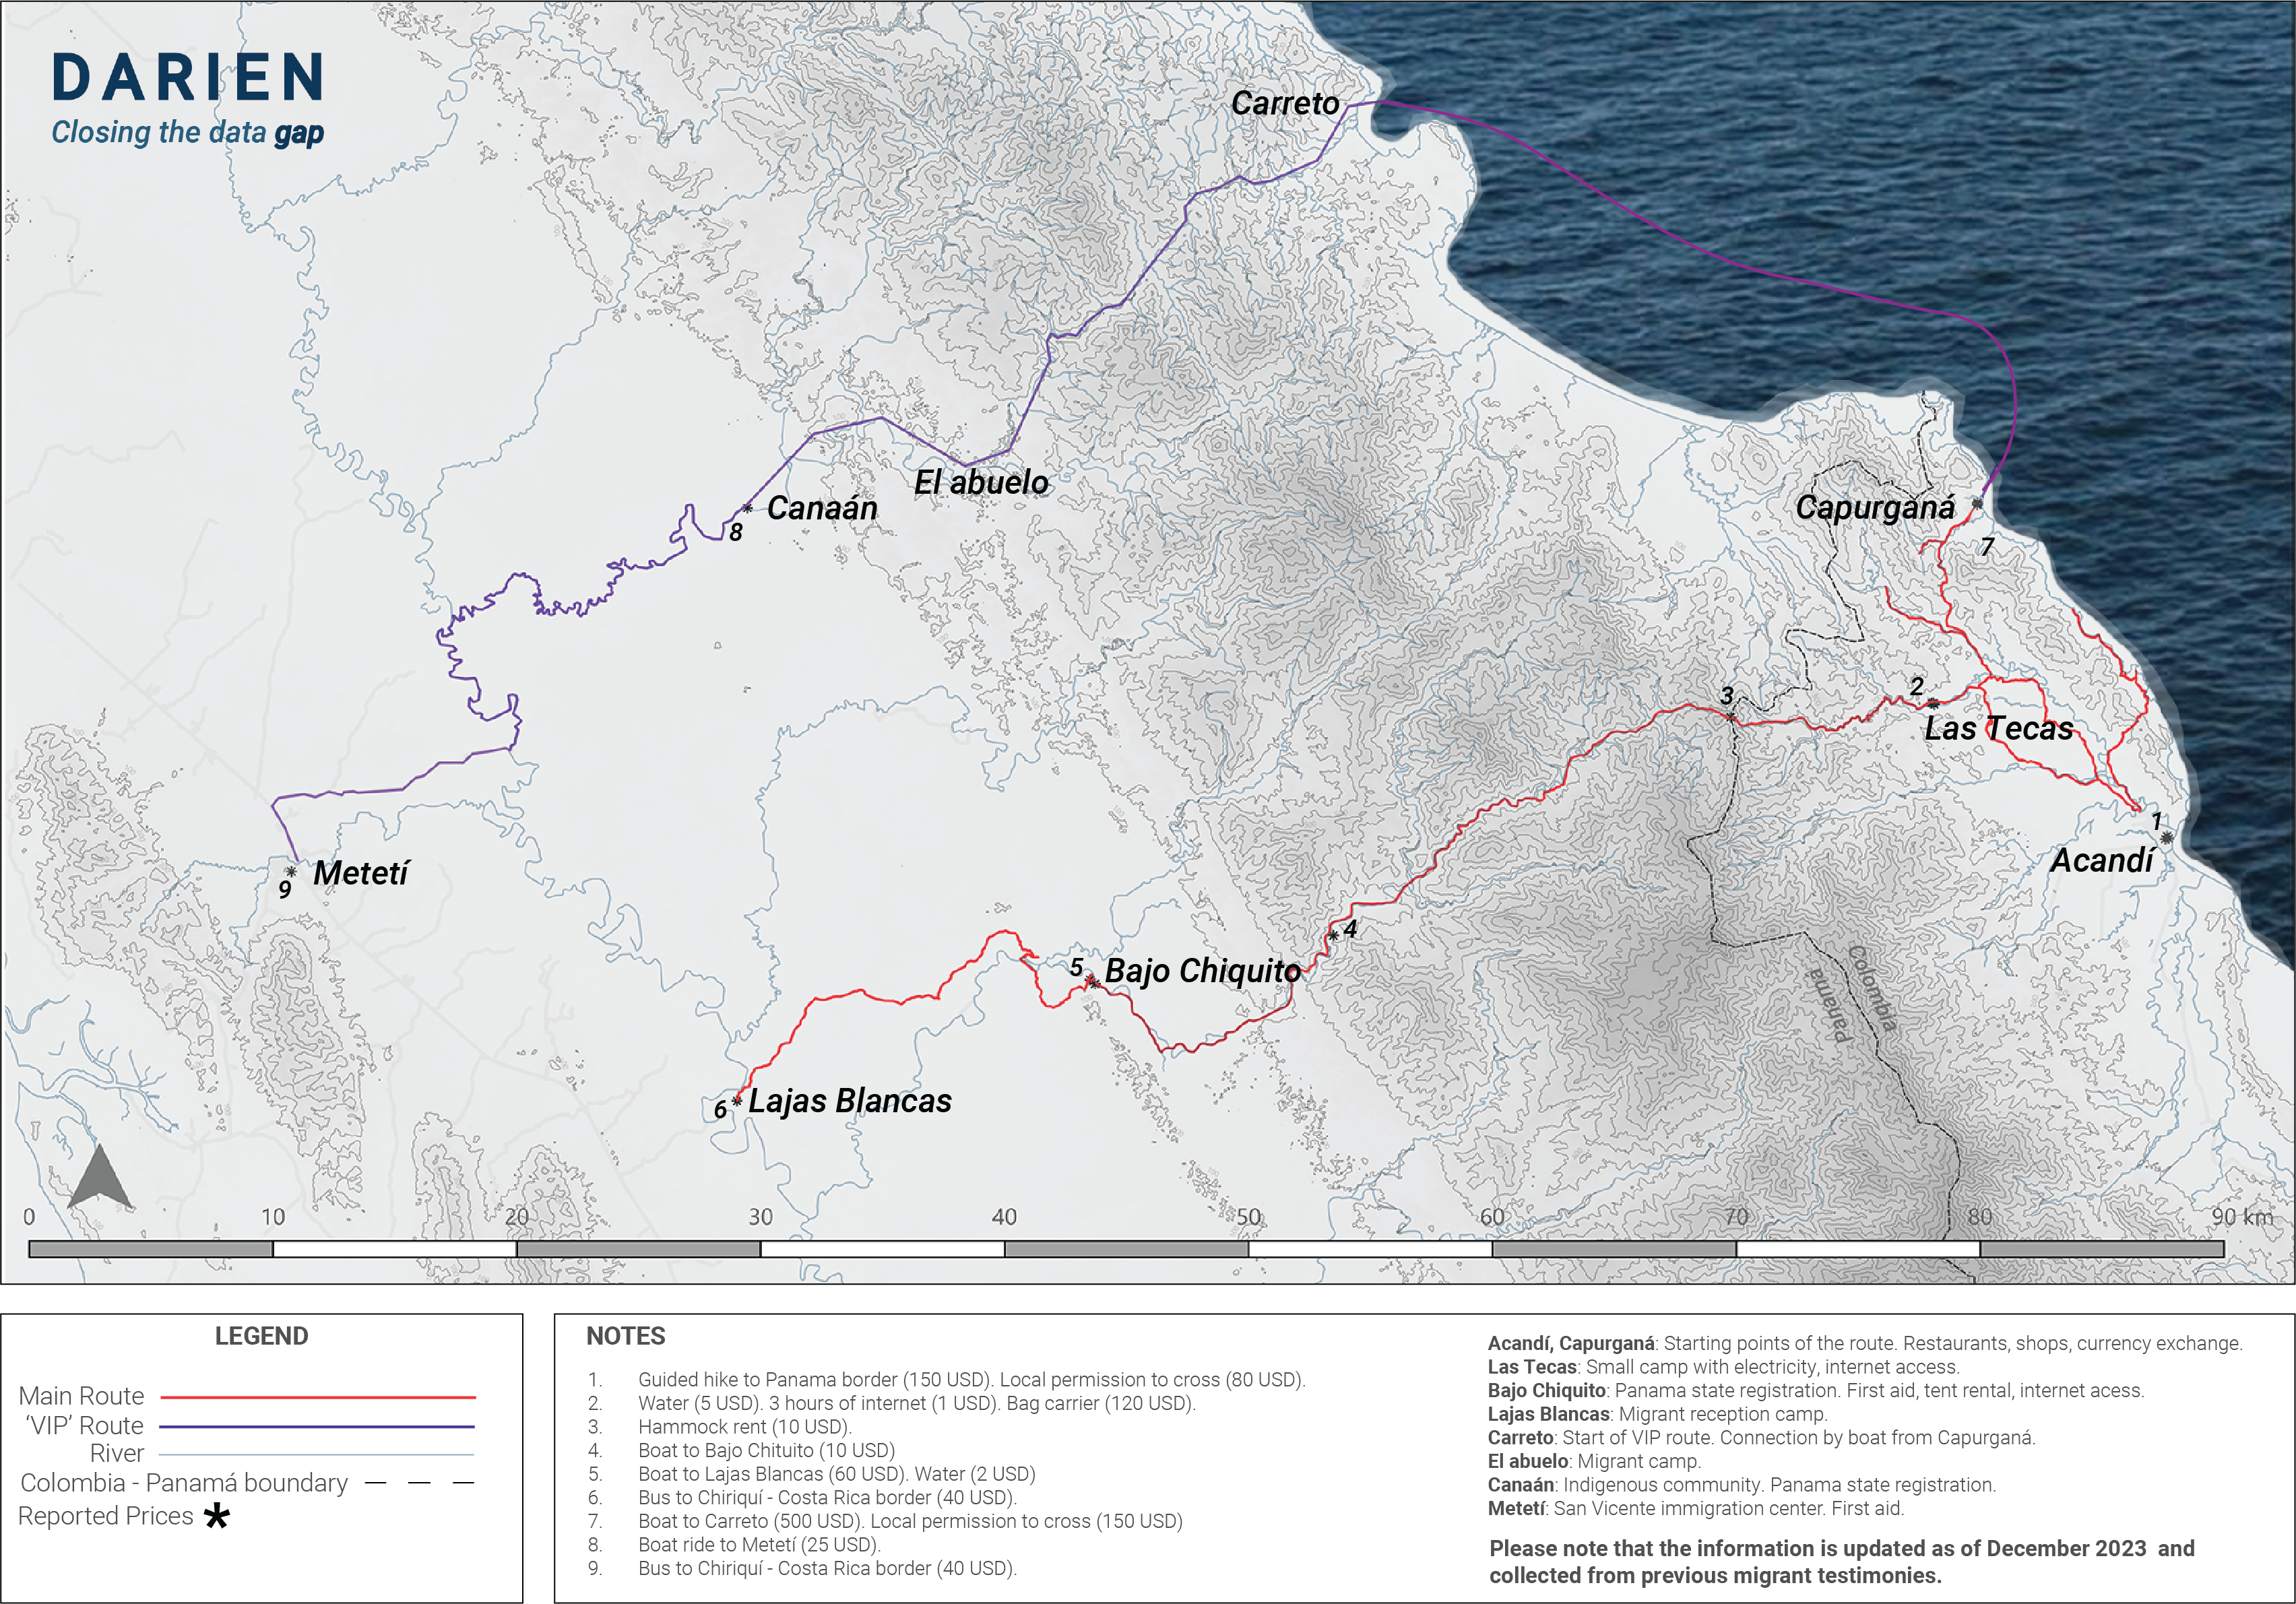
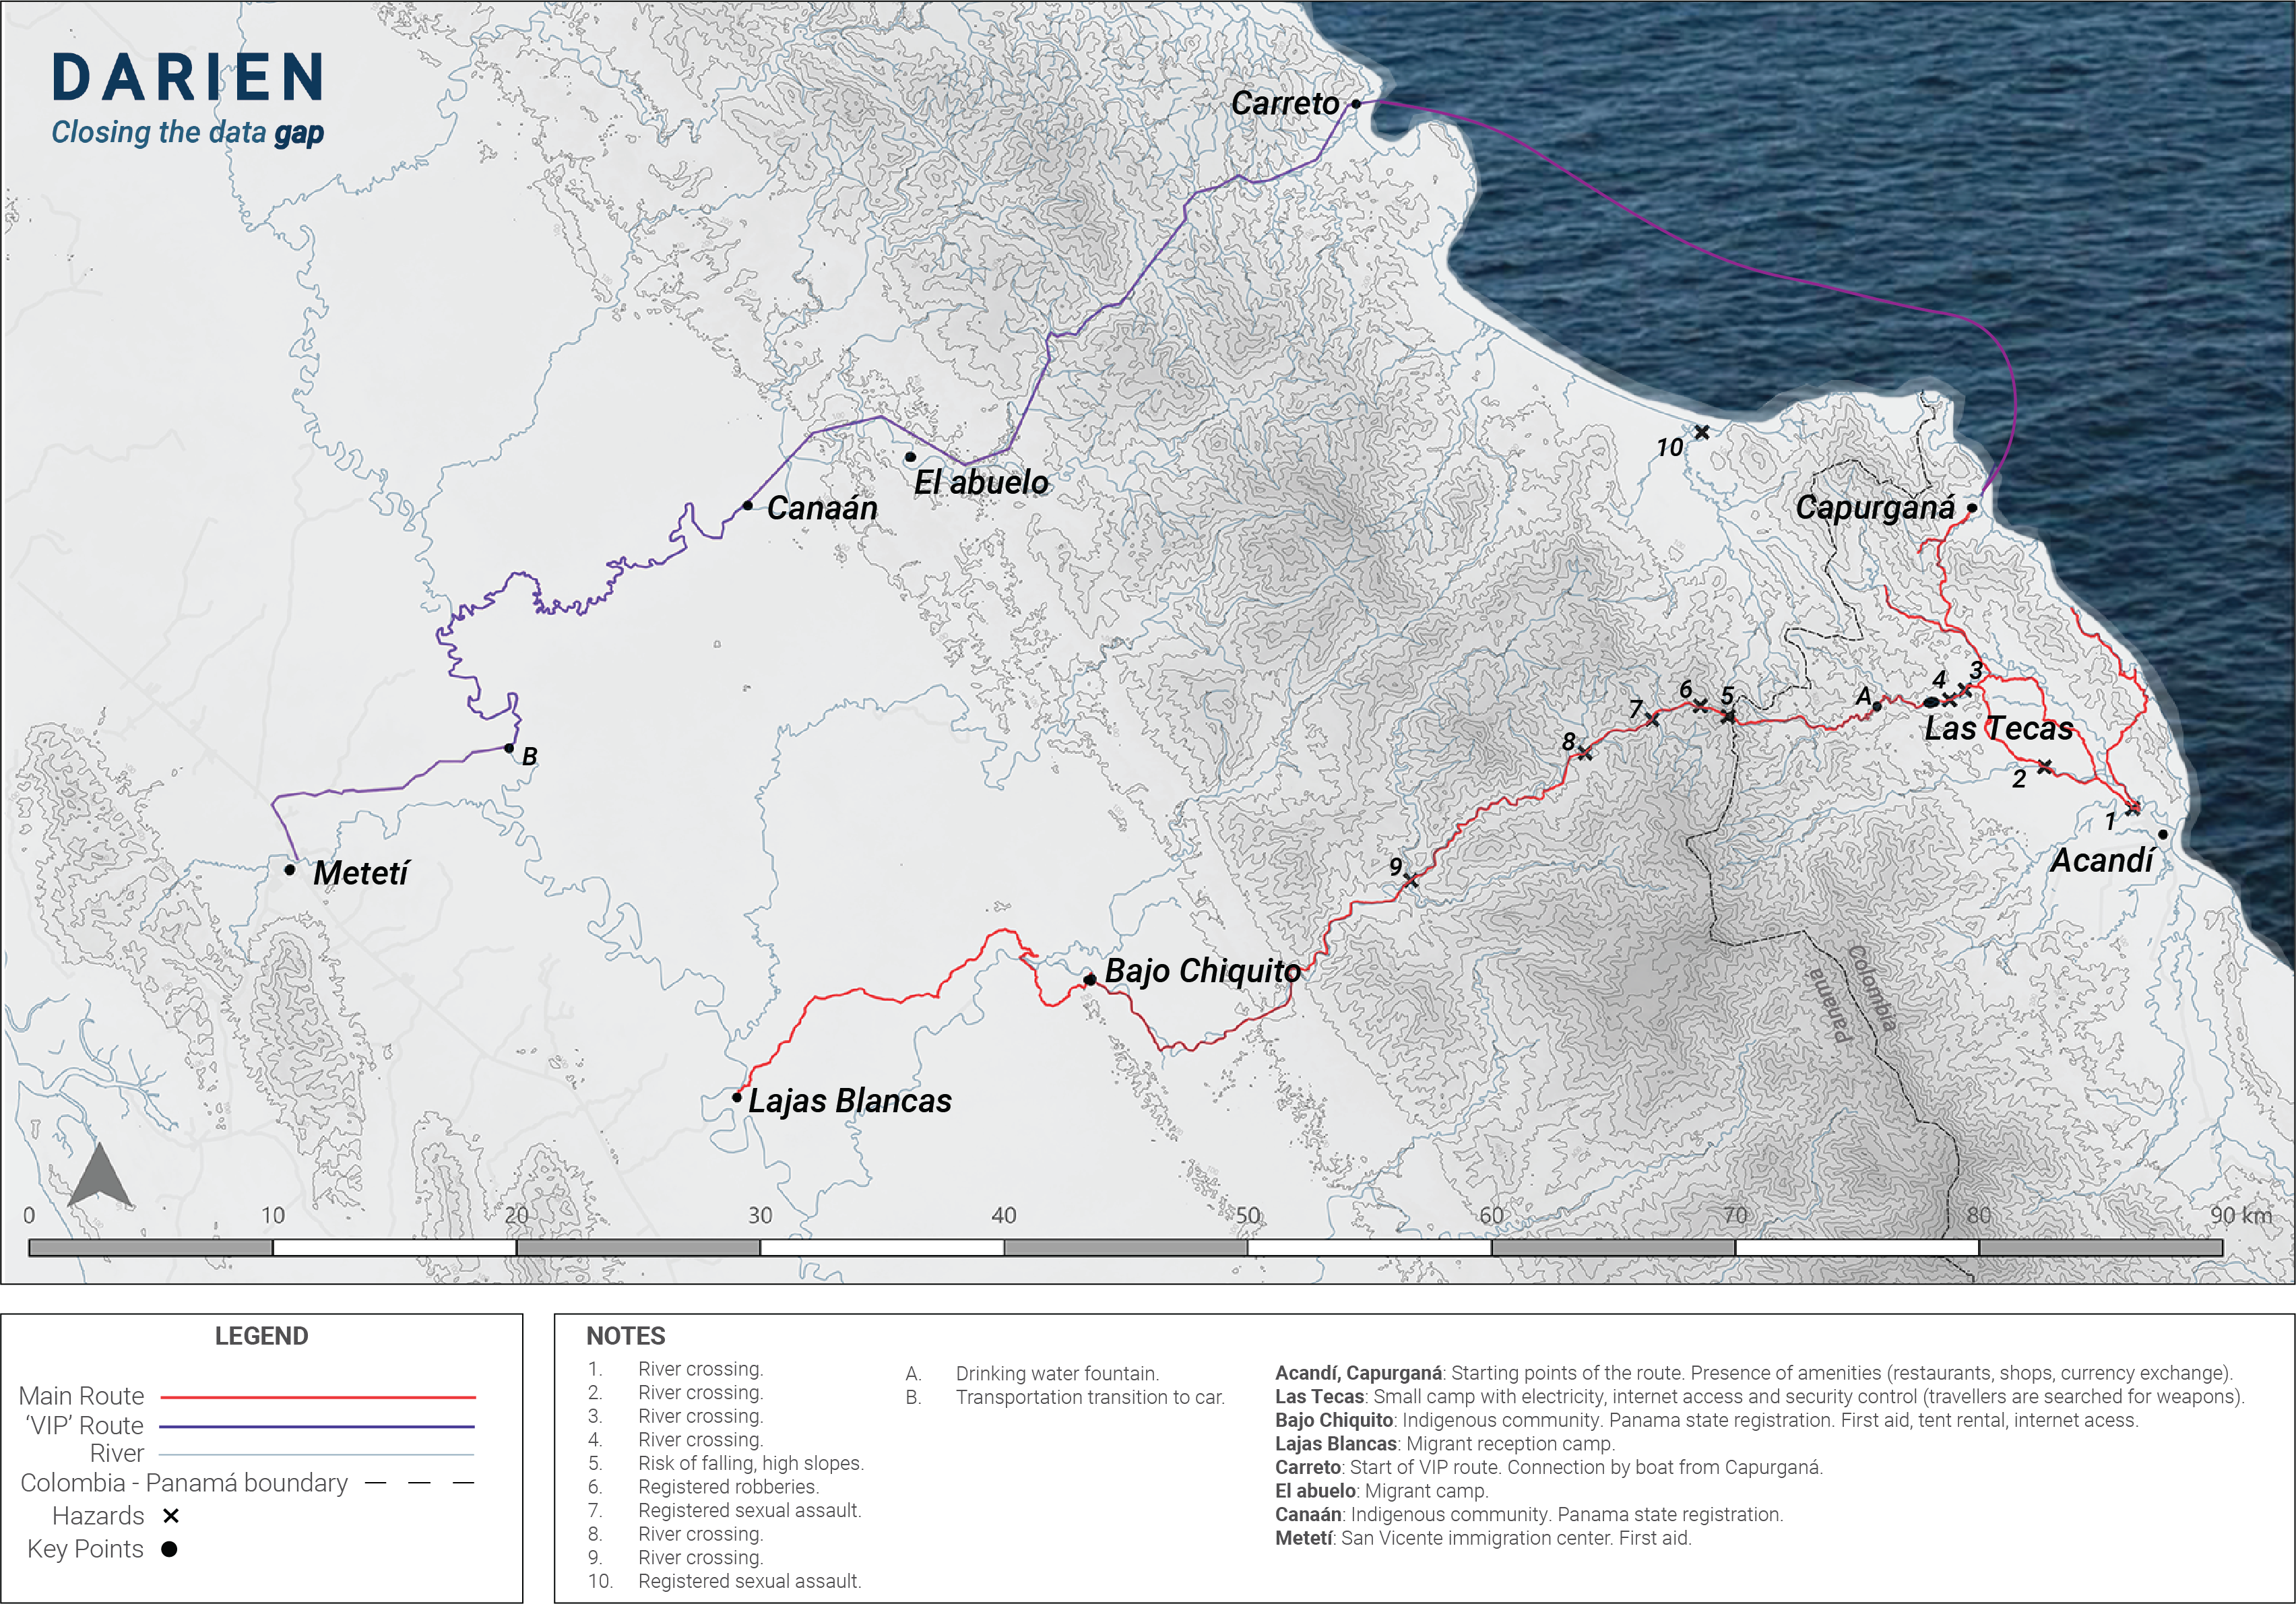
Spatial Analysis: the spatial analysis involved analyzing satellite imagery from Landsat 8, Google Earth Engine, and OpenStreetMap data to identify potential migration routes, natural hazards (like river crossings and challenging topography), and the presence of any communities or resources along the way. By overlaying this data and corroborating it with information collected from news reports, tentative routes of approximately 100 kilometers with multiple river crossings and both uphill and downhill sections were established. This spatial analysis provides a more concrete picture of the Darien Gap’s layout and potential dangers for migrants.
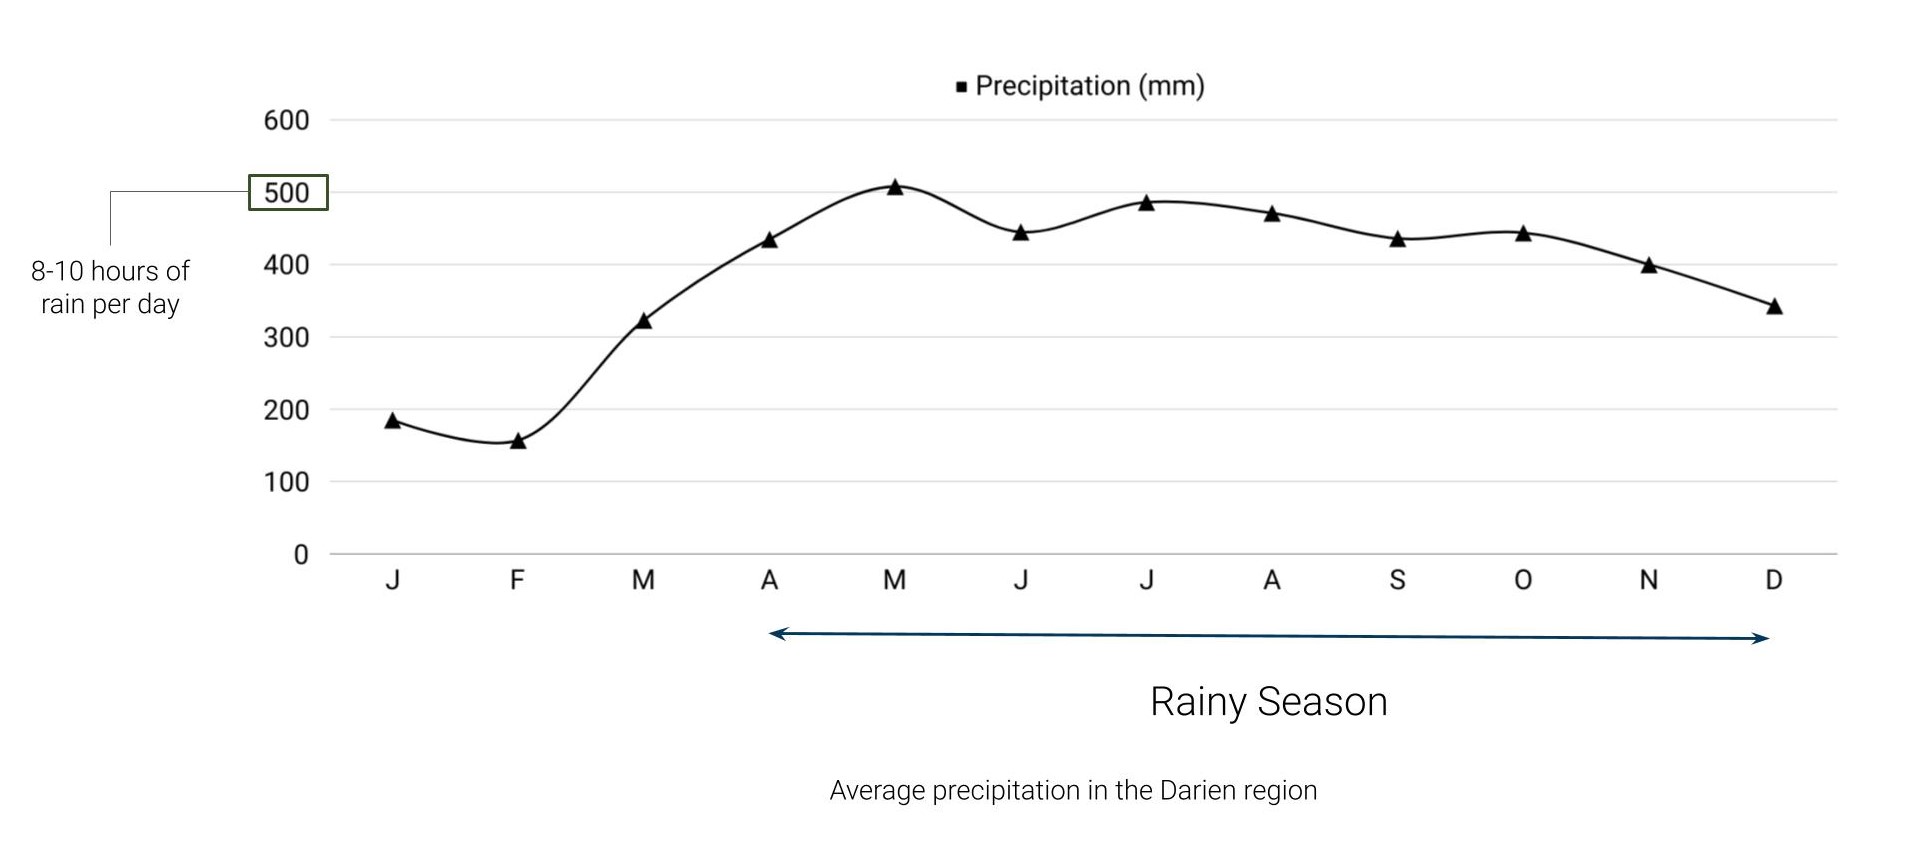
Temporal Analysis: the temporal analysis involved examining yearly weather patterns, focusing on precipitation data. By analyzing this data, we identified a significant increase in rainfall from April to December. This temporal analysis has crucial implications for migrant safety. During these rainy months, river crossings become more dangerous due to stronger currents and potential debris carried by floodwaters. Additionally, the increased rainfall can trigger more frequent landslides.
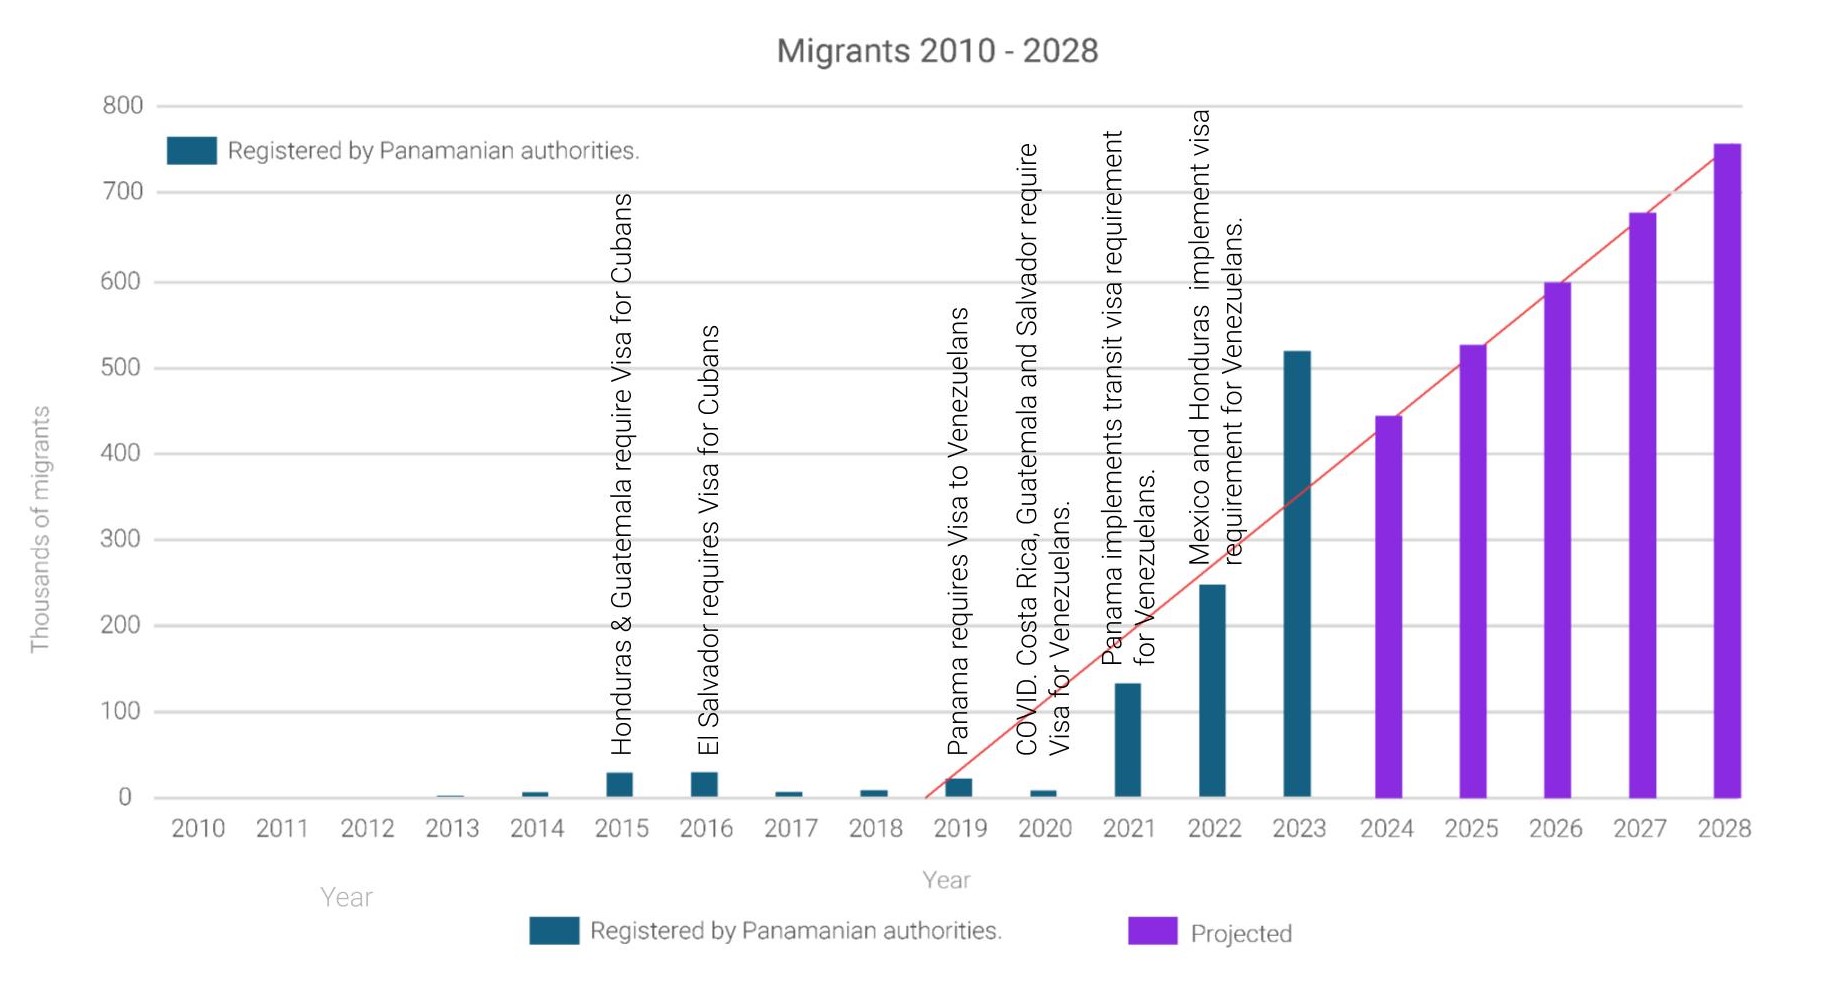
To gain a more comprehensive understanding of migration patterns through the Darien Gap, the methodology also delved into a larger temporal analysis of migrant origins. This involved examining data on migrant nationalities over a set period (2011-2023). By analyzing this data, we could potentially identify trends in migrant source countries, leading to understanding the reasons behind migration flows and potentially pinpointing areas where targeted support or awareness campaigns could be implemented.
Since data suggests Venezuelans and Cubans are the predominant migrant groups crossing the Gap, visa policy changes for these countries were examined. A correlation was observed between these visa changes in Central America and a rise in the number of migrants attempting the Darien Gap route. Additionally, the methodology employed projections to estimate potential future trends. By analyzing past increases in migration numbers, the research forecasted what the flow of migrants through the Darien Gap might look like in the coming years if the current trajectory continues. This projection can serve as a critical tool for stakeholders to prepare for and address potential challenges.
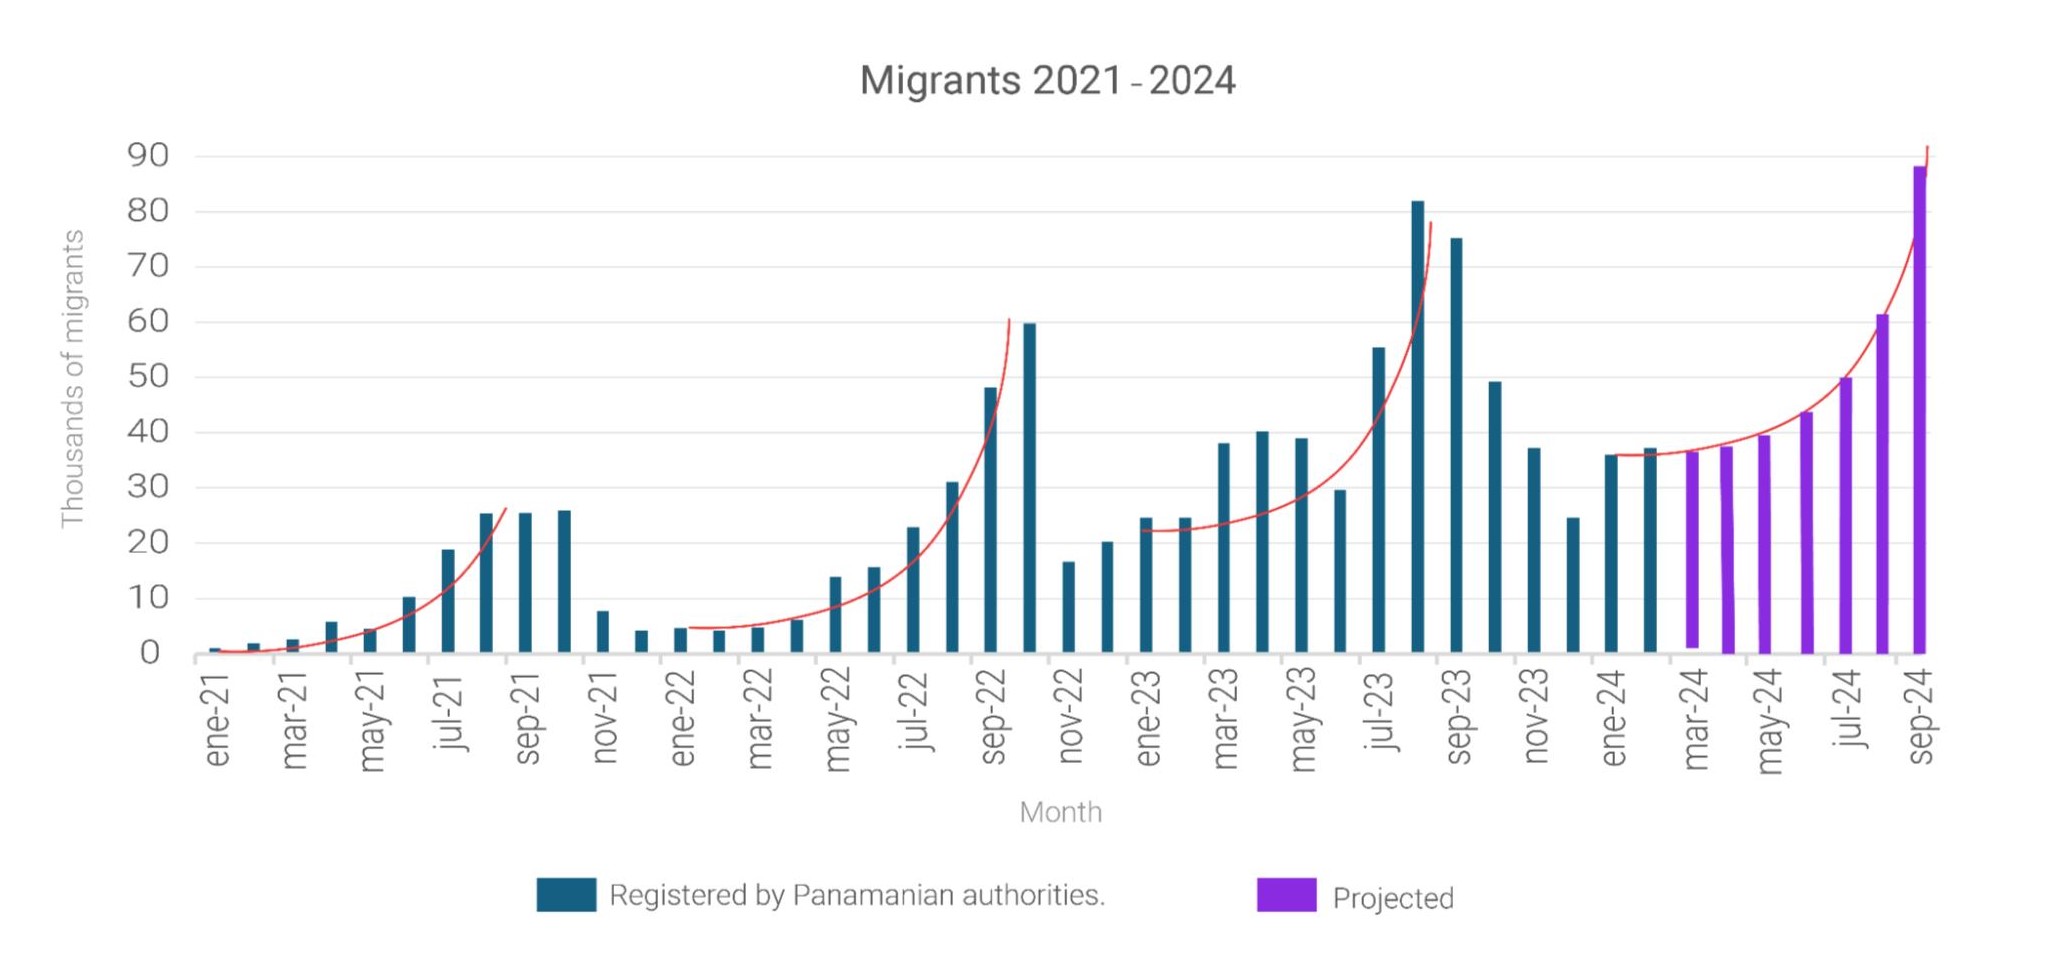
Finally the research examined temporal patterns within a year to further refine the understanding of migration flows. Data revealed a concentrated migration period from January to September, with a drastic decrease in attempts during the latter months. This seasonal trend suggests migrants strategically plan their journeys, aiming to avoid the Darien Gap during November-December. Migrants might be wary of reaching their destination countries during the holiday season (late November to December) when border policies could be subject to change or resources might be limited due to holiday closures.
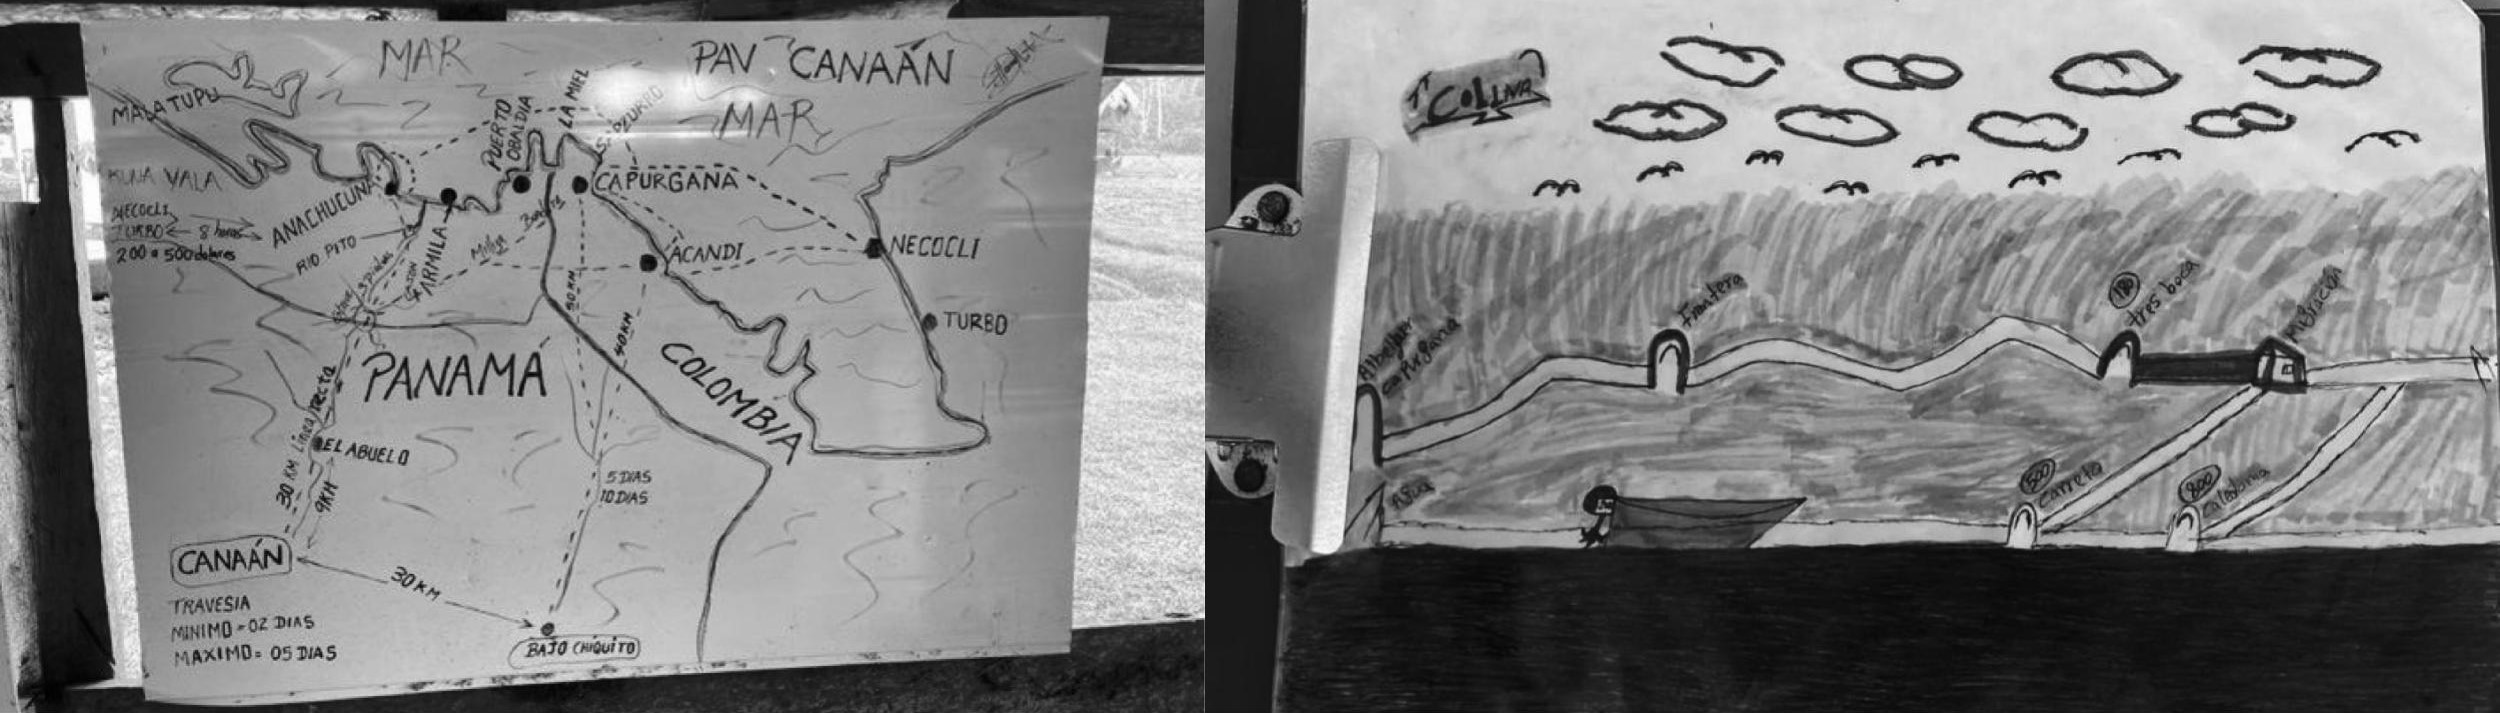
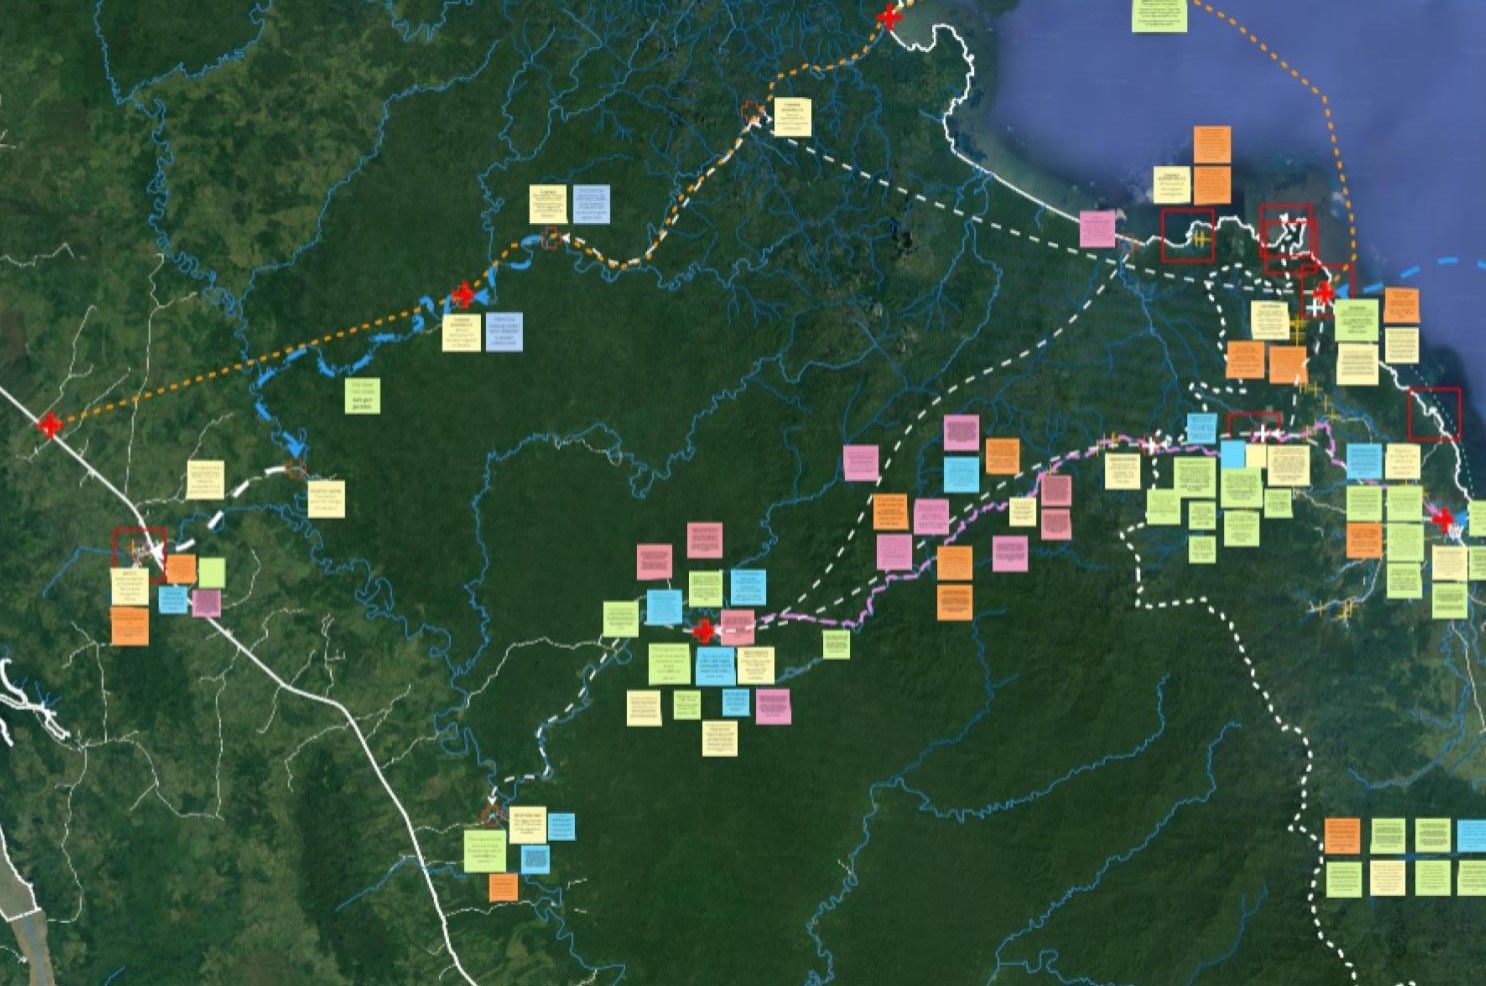
Narrative Analysis: the narrative analysis involved collecting news reports and social media accounts focusing on migrant journeys through the Darien Gap. By meticulously filtering through this content, we extracted any information that could be tentatively georeferenced. This included details like specific locations mentioned in passing, descriptions of landmarks, or references to natural features. Once extracted, this information was plotted onto a color-coded map, creating a narrative layer that complemented the more objective data. The map utilized different colors to categorize information: economic aspects with prices for crucial supplies, locations of potential hazards like dangerous river crossings, key points of interest on the route, and even the availability of any amenities like basic shelters. This approach aimed to capture the human dimension of the Darien Gap, providing a glimpse into the lived experiences of those transiting this path, while offering practical information for informed decision-making.
Objective: Aggregating anecdotal information and official reports into spatial data that can be easily accessed and understood for all stakeholders.
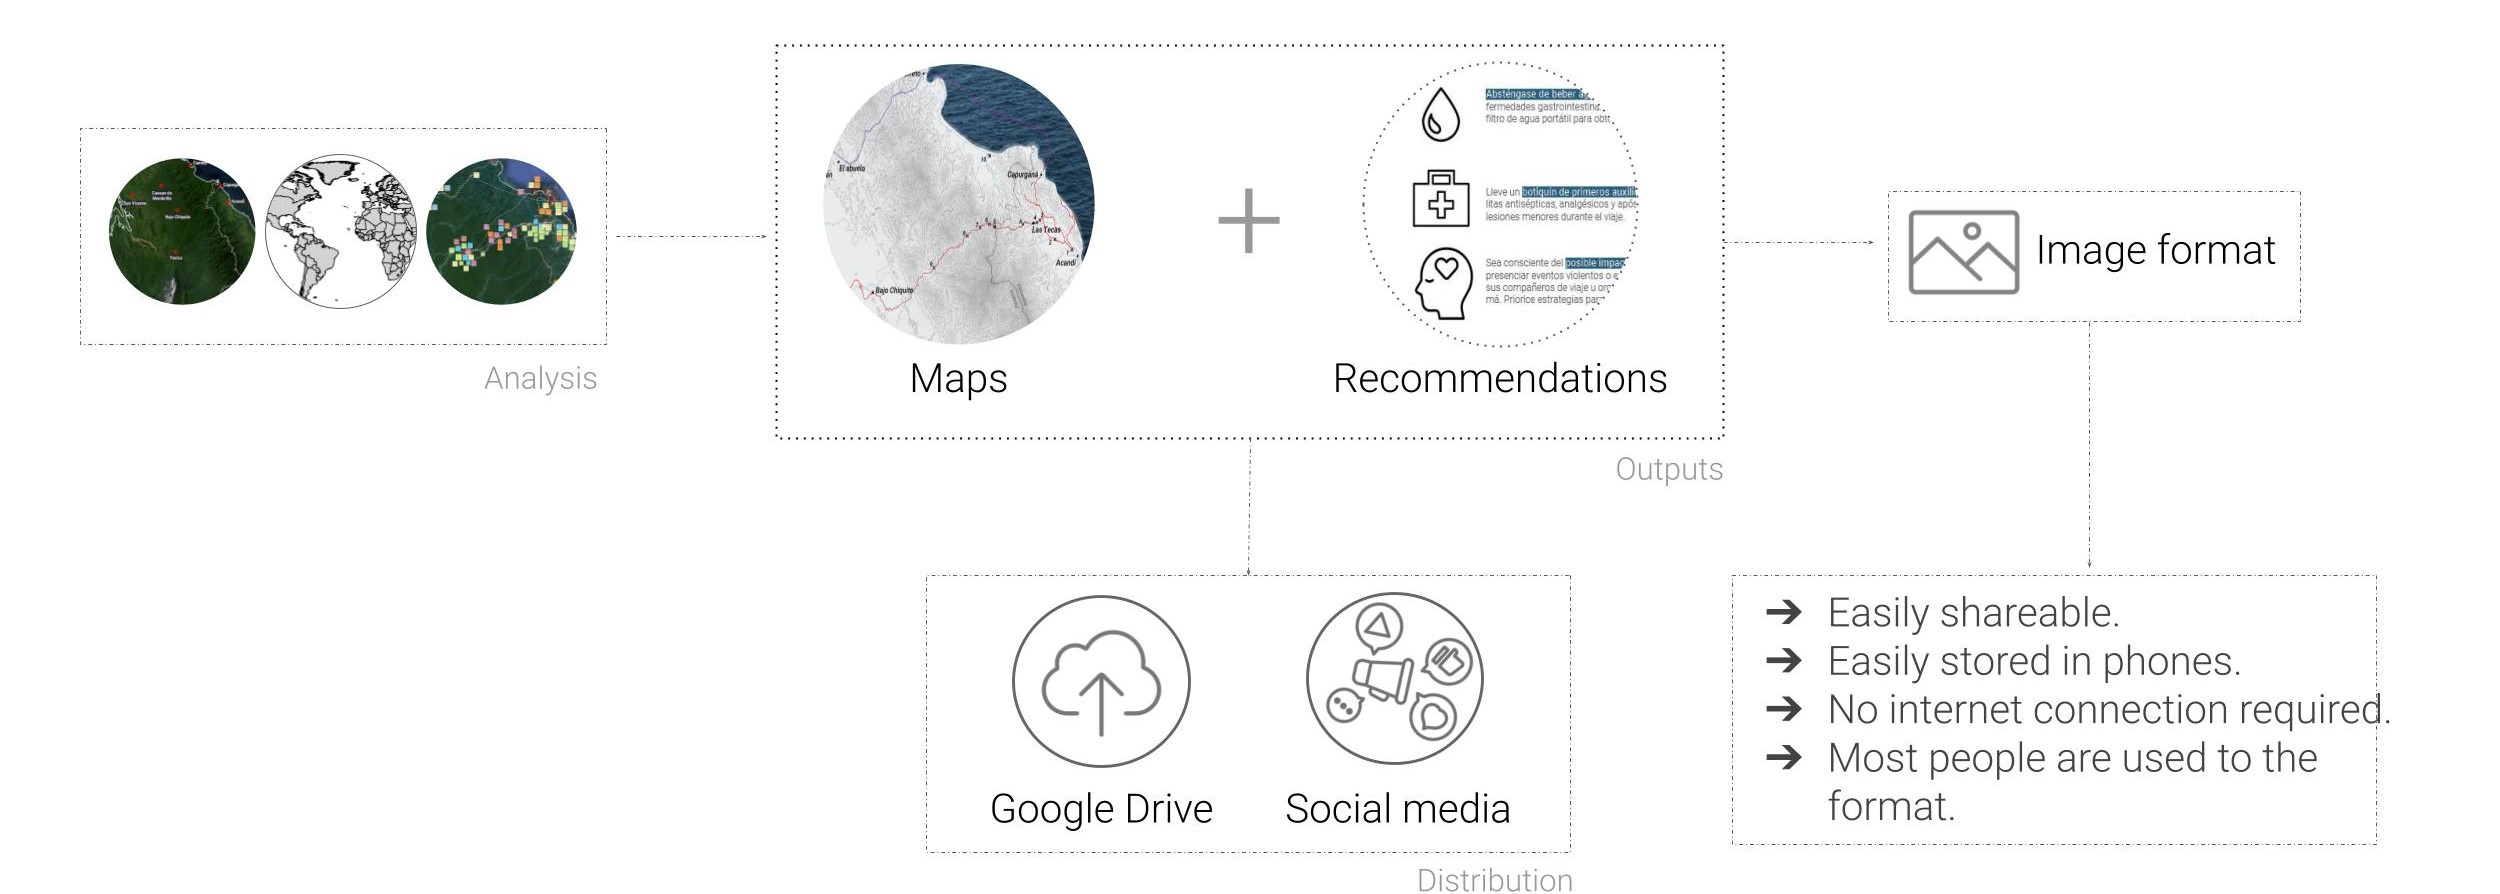
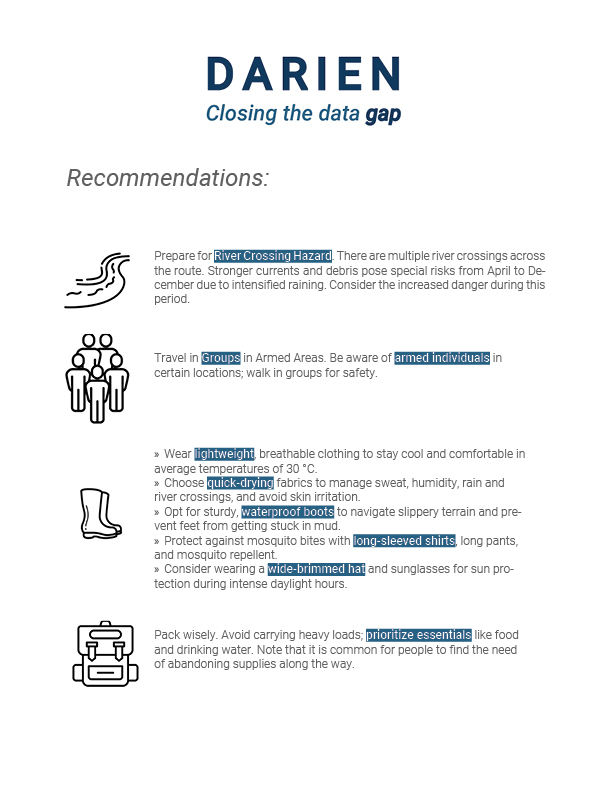
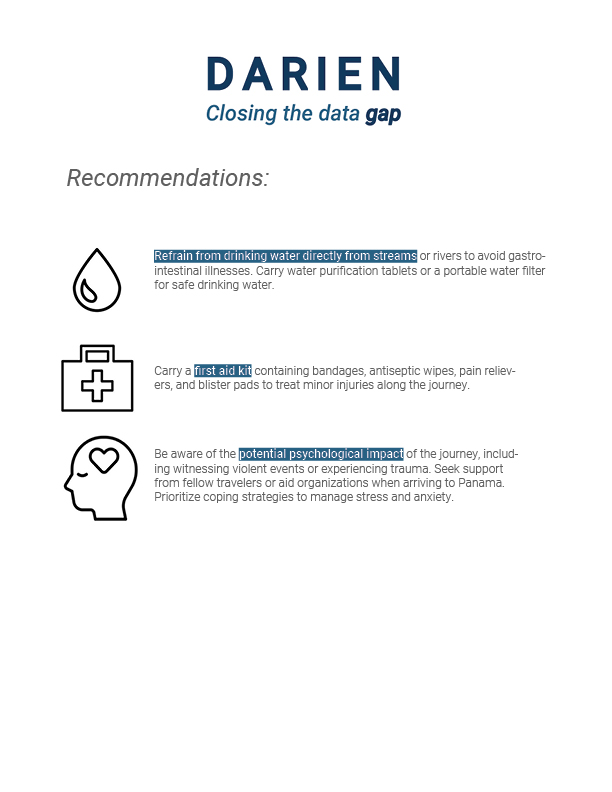
To empower informed decision-making, Darien: closing the data Gap proposes a user-friendly set of downloadable maps and recommendations specifically tailored to the Darien Gap. By aggregating the previously introduced data – including spatial information on routes and hazards, temporal insights on weather patterns, and even narrative accounts from migrants themselves – the project aims to create a comprehensive picture of this challenging journey. These maps will be saved as readily accessible image files (.jpg or .png), ensuring they can be opened on most mobile phones without an internet connection. This format caters to the widespread use of smartphones among migrants and avoids the limitations of internet access in remote areas. Ultimately, this easily downloadable resource aims to equip both migrants and relevant institutions with the knowledge needed to navigate the Darien Gap with greater awareness and preparation.
Potential Next Steps:
- Expanding Accessibility: Creating a KMZ file containing all georeferenced key locations identified in the analysis. This file would be compatible with Google Earth and Google Maps, offering a more interactive experience for users.
- Multilingual Support: Recognizing that most migrants hail from Spanish-speaking countries, all recommendations should initially be translated into Spanish alongside the existing English version. This ensures everyone can access crucial information in their native language.
- Dynamic Updates: The current maps are static, but we envision creating feedback loops. This will allow users to report changes in routes, prices, or hazards, ensuring the maps remain up-to-date and reflect the evolving reality of the Gap.
- Dissemination and Collaboration: Several NGOs actively work within the Darien Gap. We see them as ideal partners for distributing the maps and recommendations. By working together, we could ensure this vital knowledge reaches the hands of those who need it most.
References:
