Our BIMSC studio project centers on designing a ‘hyperbuilding’ in Tokyo’s Minato Ward—a self-sustaining development that integrates closed-loop ecological systems like on-site food production, photovoltaic energy generation, and industrial modules. The building includes mixed-use zones for amenities, services, and commerce, all anchored by a transit hub built into a podium above Shinagawa Station, supporting the four towers above that are joined by bridging connections.
The project is divided into six teams. We’re part of the data team—the only non-design group—responsible for managing and coordinating data across the project. The five design teams focus on structure, residential, services, industrial, and facade systems.
Team Roles
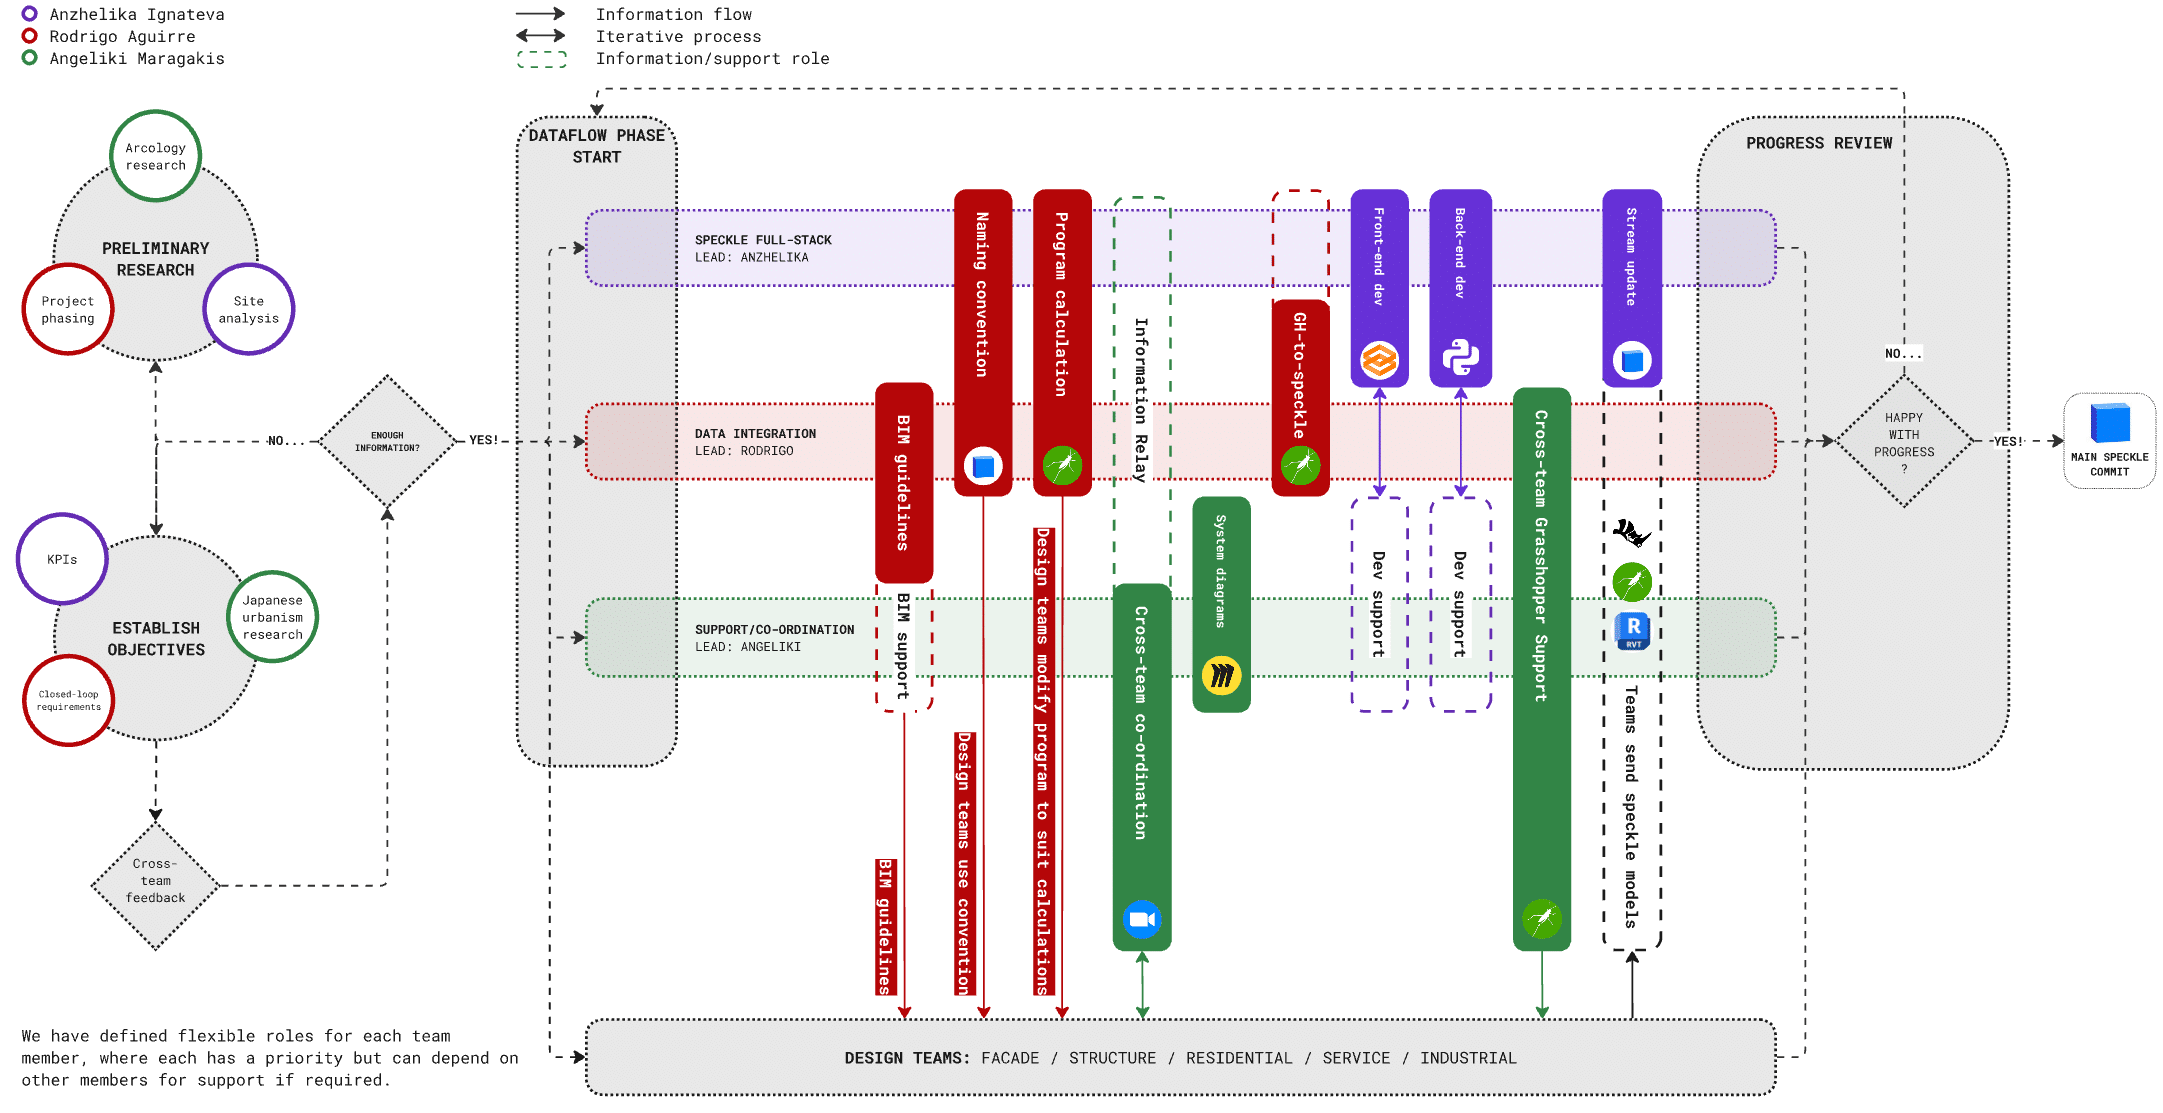
The data team’s role focused mostly on the development of a data visualisation dashboard to track design team key performance metrics (KPIs) to evaluate overall building performance. We found ourselves handling data from many different platforms, and so chose to use Speckle as a data-agnostic intermediary service between softwares to send and receive this data.
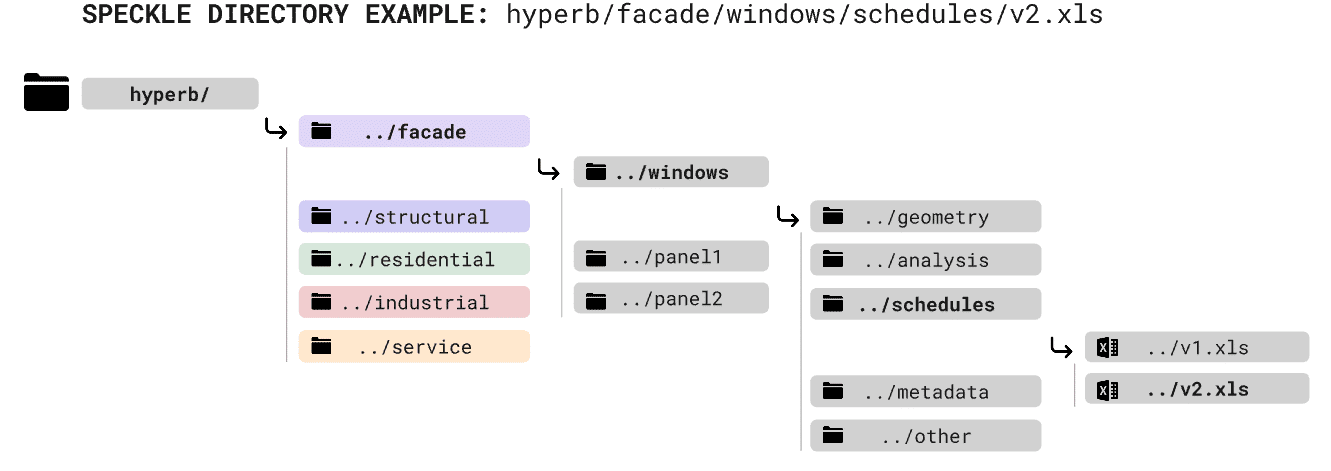
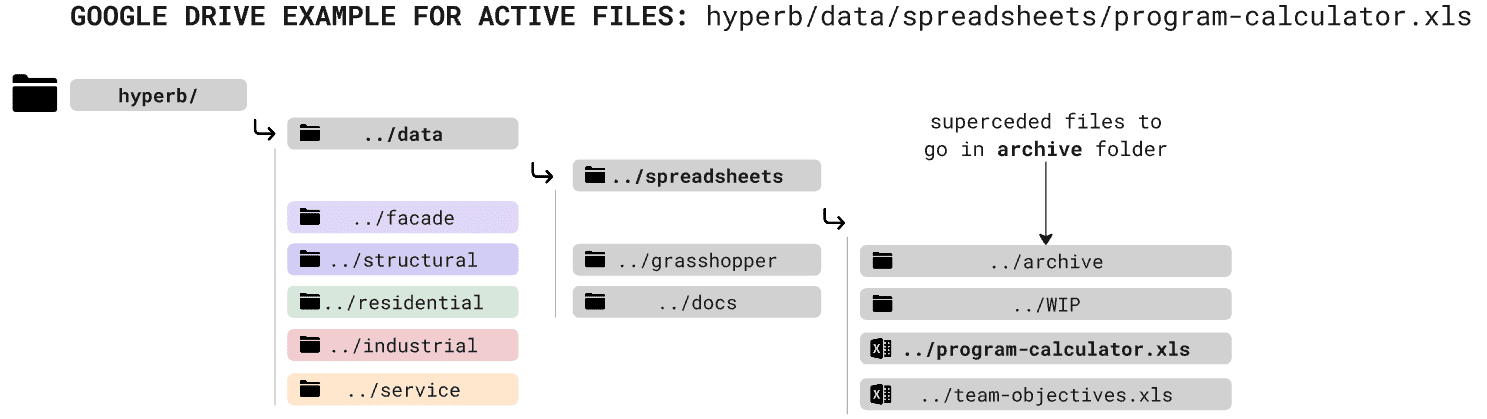
For ease of data extraction and legibility, we devised directory structures for our two primary data exchange services (Speckle and Google Drive):
As the only non-design focused team (but with a wealth of grasshopper expertise), we also offered grasshopper support to the design teams as needed to relieve key bottlenecks in the design process.
Team-specific Outputs // Data Dashboard
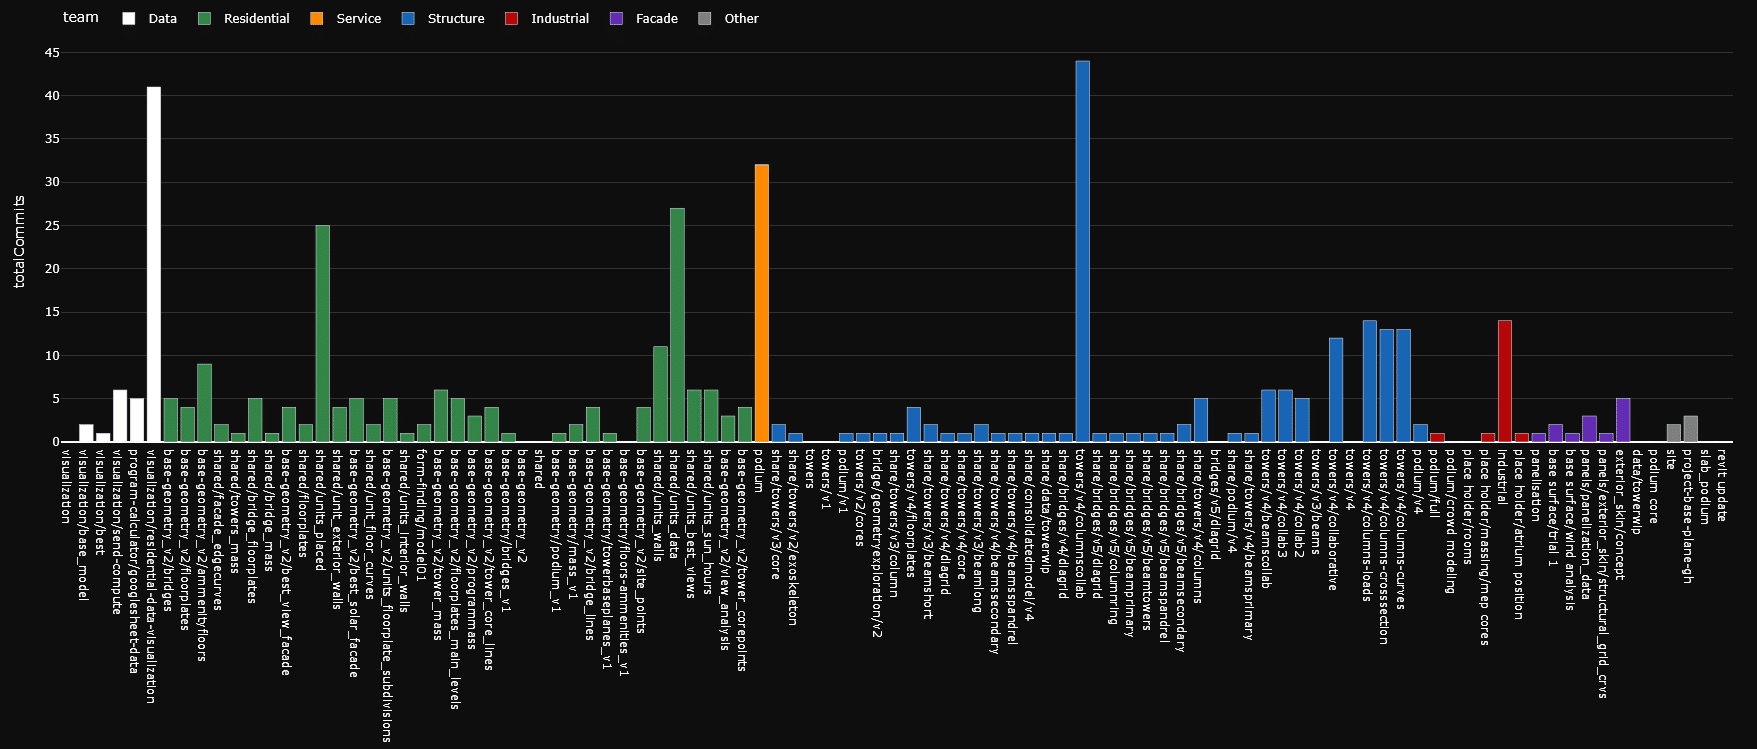
As a data team, we did not have any explicit design outputs. We developed a data dashboard using Gradio for Python that we deployed using HuggingFace. This allows us to to monitor design team activity and visualise all received data through either Google Sheets or Speckle iFrame integration, along with Speckle commits per model and design team.
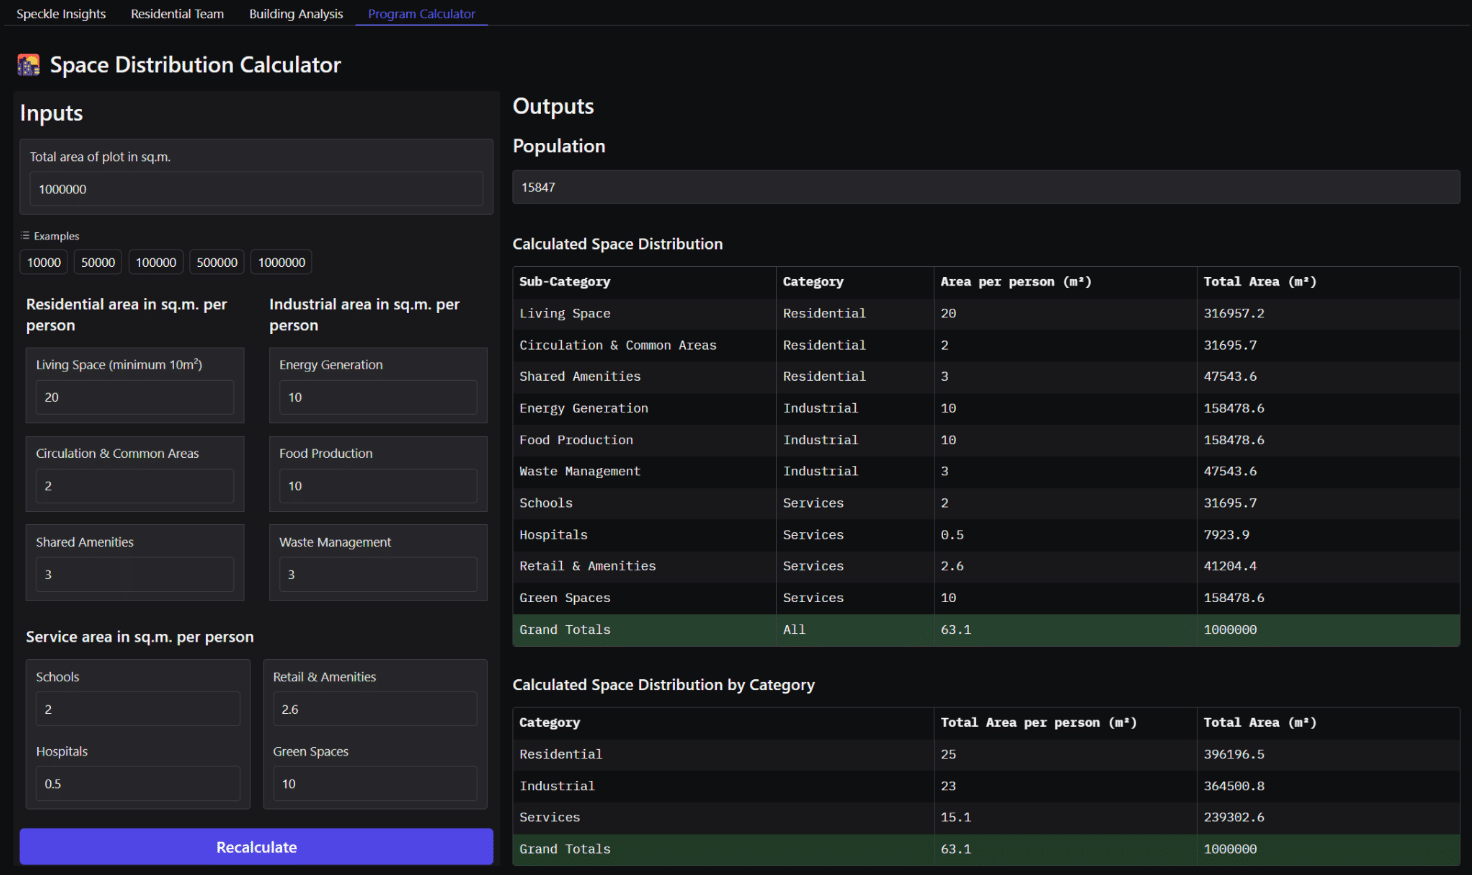
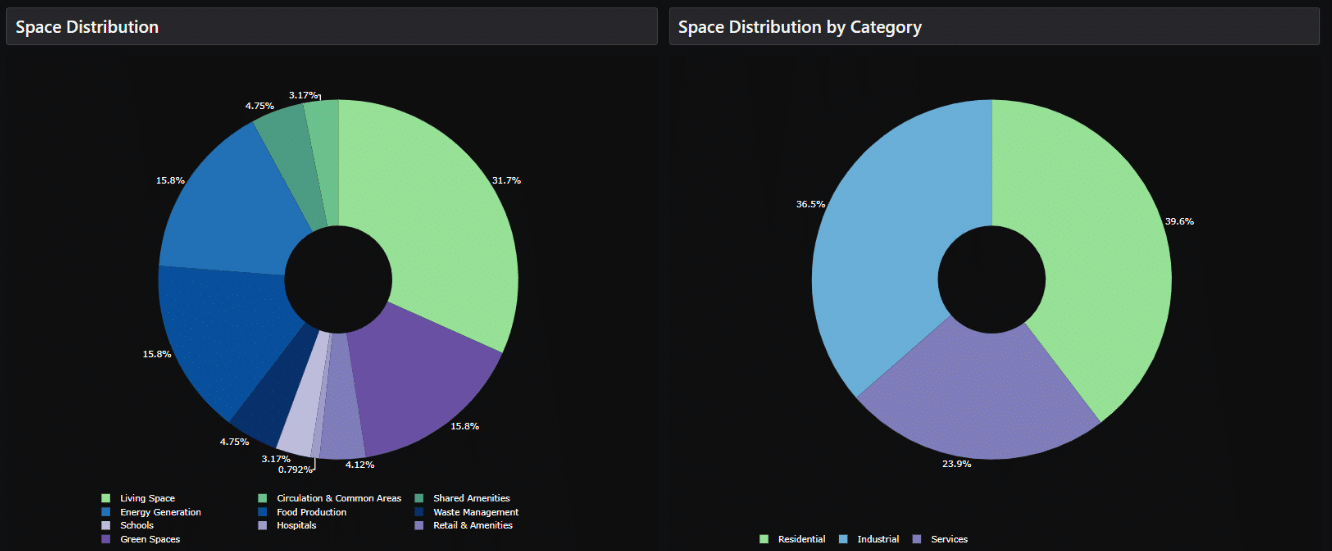
Space Distribution Calculator
At the early stages of our HyperB project, we created a basic program calculator. This tool receives total area and area per person in sq.m. for each category – residential, industrial, service – and fetches the data frames and pie charts showing the overall distribution of spaces along with the population number.
The application is designed to help to find the overall concept related to space distribution and find a population number optimized and aligned within teams.
External Collaboration Structure
To streamline collaboration, we set up an external workflow structure—mapping team inputs and outputs to help meet KPIs and reduce bottlenecks. We identified moments of transition between stages of conceptual modelling (categoried by their LOD) and segmented our development pipeline with cross-team reviews of all Speckle models.
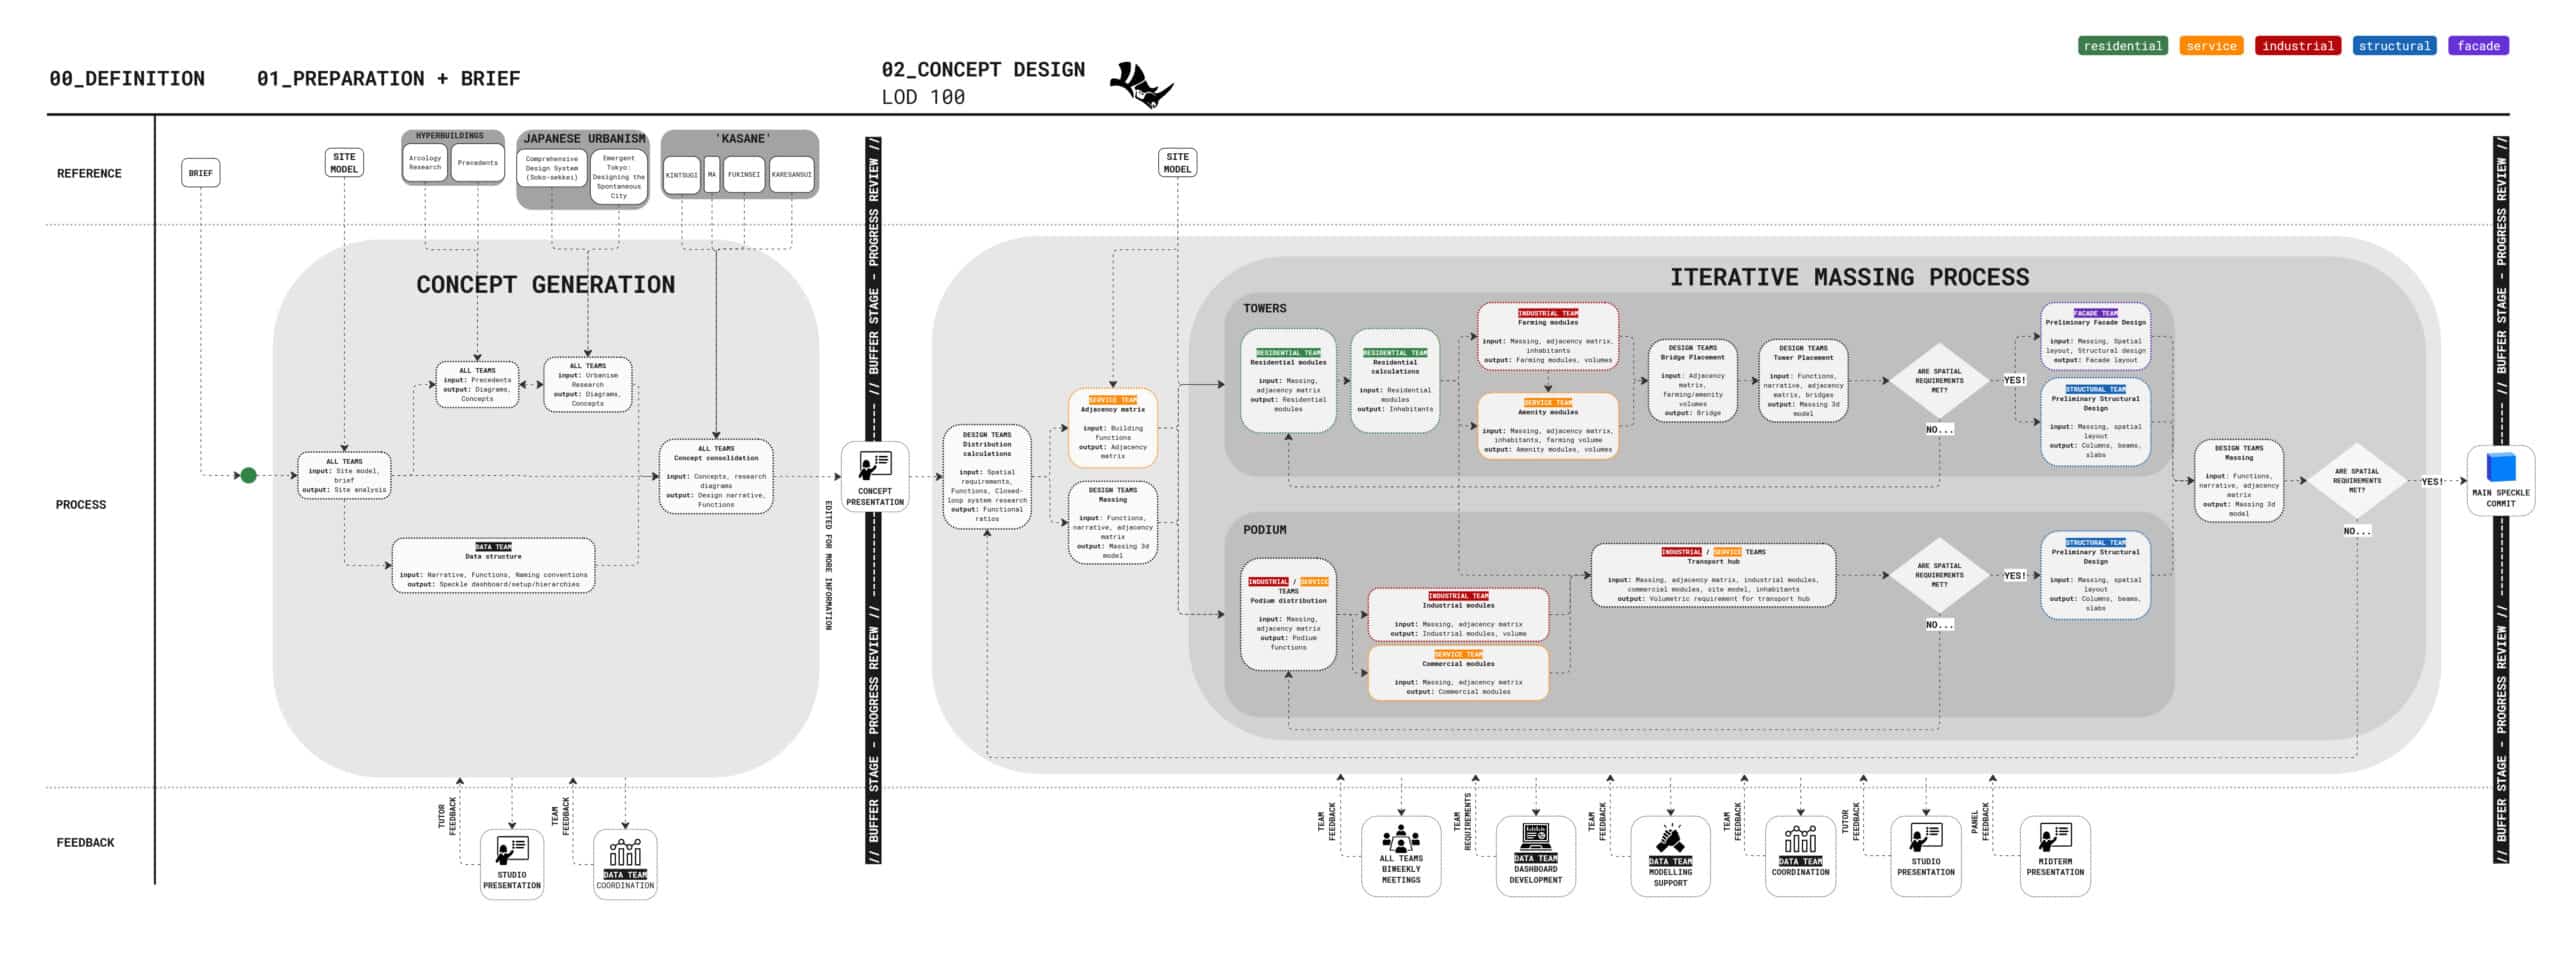
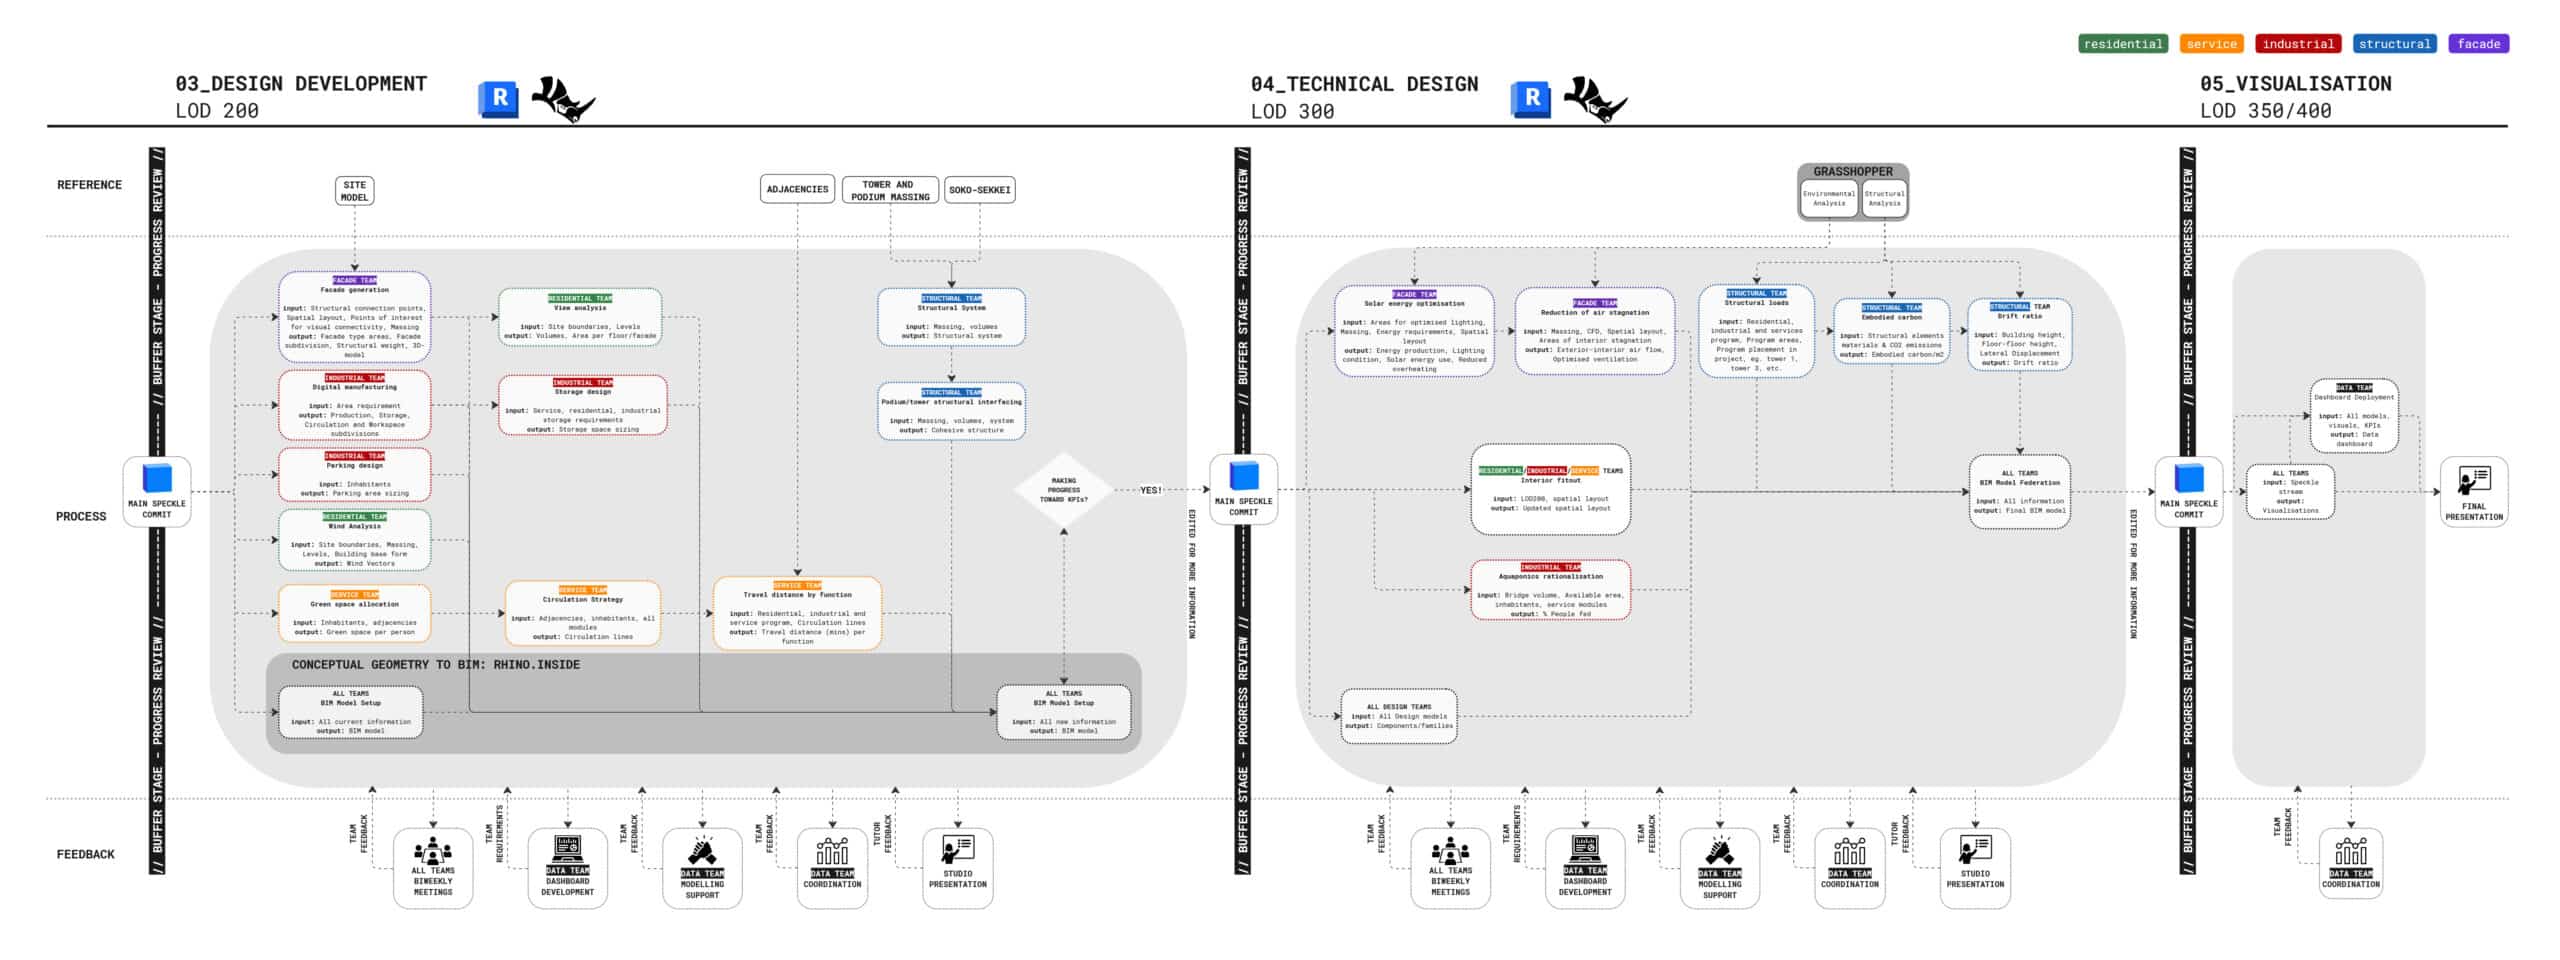
But in practice, coordinating across many people was tricky. This meant that design teams would only loosely follow the collaboration plan of work, and some friction points particularly in the design development and technical design stages were not initially considered, or omitted entirely.
Collaboration Reflection
The good
The use of live-service collaboration tools like Speckle significantly streamlined the exchange of crucial data across teams. Our hyperbuilding team comprises architects and designers with diverse skill sets. As the data team, we did not impose any specific software requirements, allowing each team member to work within their strengths. The ability to seamlessly transfer data between different software platforms proved invaluable.
The bad
- As the only non-design team, we took on management and coordination roles for 19 tea members spanning multiple time zones and work schedules.
- Breakdowns at key bottlenecks required us to assume extra responsibilities in both design and technical support.
- As a result, our primary focus on data collation and visualization often had to be deprioritized to ensure the design teams could meet their deadlines.
How could we improve?
- Defining clear roles and responsibilities: though we did appoint team coordinators, we should have asked for them to act as the support role for each team. We also should have defined what the data team will not handle to ensure that technical support doesn’t overshadow our core responsibilities.
- Automate routine tasks: as a data team we would have liked to provide more efficient means of data collection, but found ourselves without the time to do so.
The disorganised
- While we can establish workflows to achieve specific design objectives and provide BIM and data structure guidelines, we cannot enforce their use.
- As a result, the planned workflow we designed to meet our goals was often not followed, and our project proved much more chaotic than intended.
How could we improve?
- Make guidelines actionable and visible: we could have further emphasised the importance of the guidelines, enforcing soft compliance when data is not structured correctly.
- More structured sync & feedback loops: as a data team we should have set-up more structured check-ins to align expectations and iterate on the current workflows of each design team.
Automation tool development: GH2GS
We initially used Google Sheets for design teams to input analysis data, but collaboration issues made it hard to ensure the data was up-to-date. To solve this, we automated the data exchange—developing a workflow that links Grasshopper directly to Google Sheets and integrates it with our dashboard for real-time data visualization.

The problem
Tools like Speckle can be used to send and receive data to Grasshopper, but it has no Google Sheets connector – it offers an excel connection but with this comes no live update or collaborative functionality.

The solution…?
By hosting a Grasshopper script online that parses incoming data using Python and then connects back to the Google Drive API, we are able to read live updates to Google Sheets, and also write new data.

The challenges
A ‘one size fits all’ approach to parsing and simplifying data into spreadsheets may require extensive conditional logic. The data parser will also need to be hosted via middleware to connect to Google Drive API.
GH2GS // Full-stack

Though we had originally intended to host this data parser on a middleware hosting service, we found that our development pipeline was incompatible with Rhino.Compute 7, where python libraries (in our case, the Google Drive and Google Sheets API) are not usable with our compute version.
This meant that instead of hosting our script where users could send their data and have it automatically parsed, in order to use the data parser it must be running client-side – which was a little disappointing! But we were able to get the automation tool fully operational client-side, as shown below: