CONTEXT
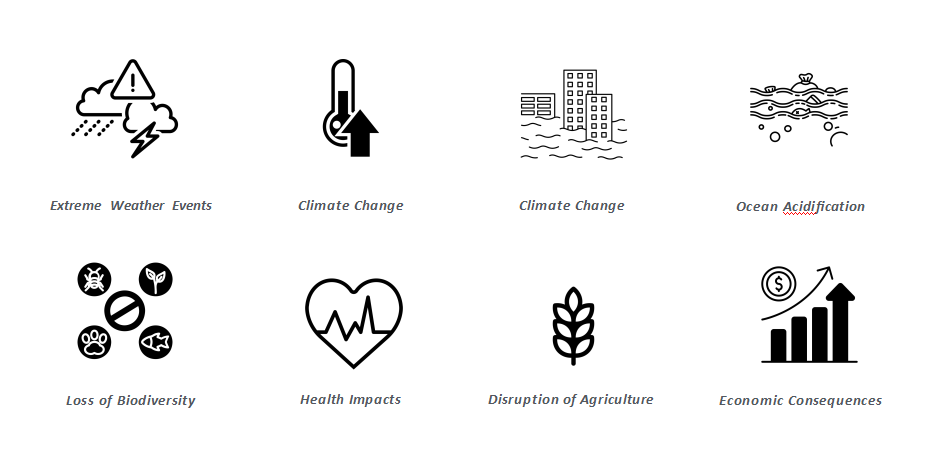
Consequences of carbon emission
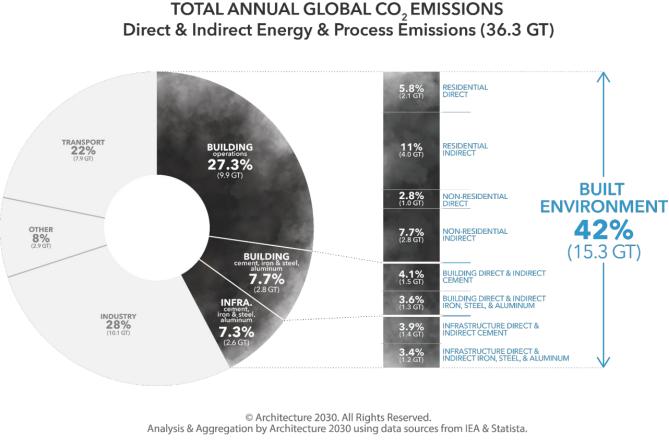
Building operations are responsible for approximately 27% annually, while the embodied carbon of just four building and infrastructure materials – cement, iron, steel, and aluminum – are responsible for an additional 15% annually
EuropeanClimateLaw
The European Climate Law writes into law the goal set out in the European Green Deal for Europe’s economy and society to become climate-neutral by 2050. The law also sets the intermediate target of reducing net greenhouse gas emissions by at least 55% by 2030, compared to 1990 levels.
Climate neutrality by 2050 means achieving net zero greenhouse gas emissions for EU countries as a whole, mainly by cutting emissions, investing in green technologies and protecting the natural environment.
TechnologiesinArchitecture
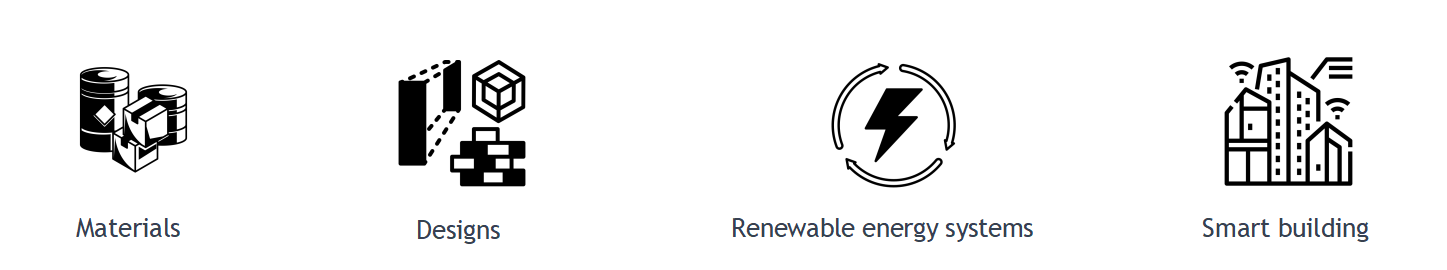
Several technologies have been employed in architecture to mitigate carbon emissions, including green building materials like low-carbon concrete and recycled steel, energy-e?cient designs integrating passive strategies such as natural ventilation and daylighting, renewable energy systems like solar panels and wind turbines, advanced insulation materials, and smart building technologies for optimizing energy consumption and reducing environmental impact.
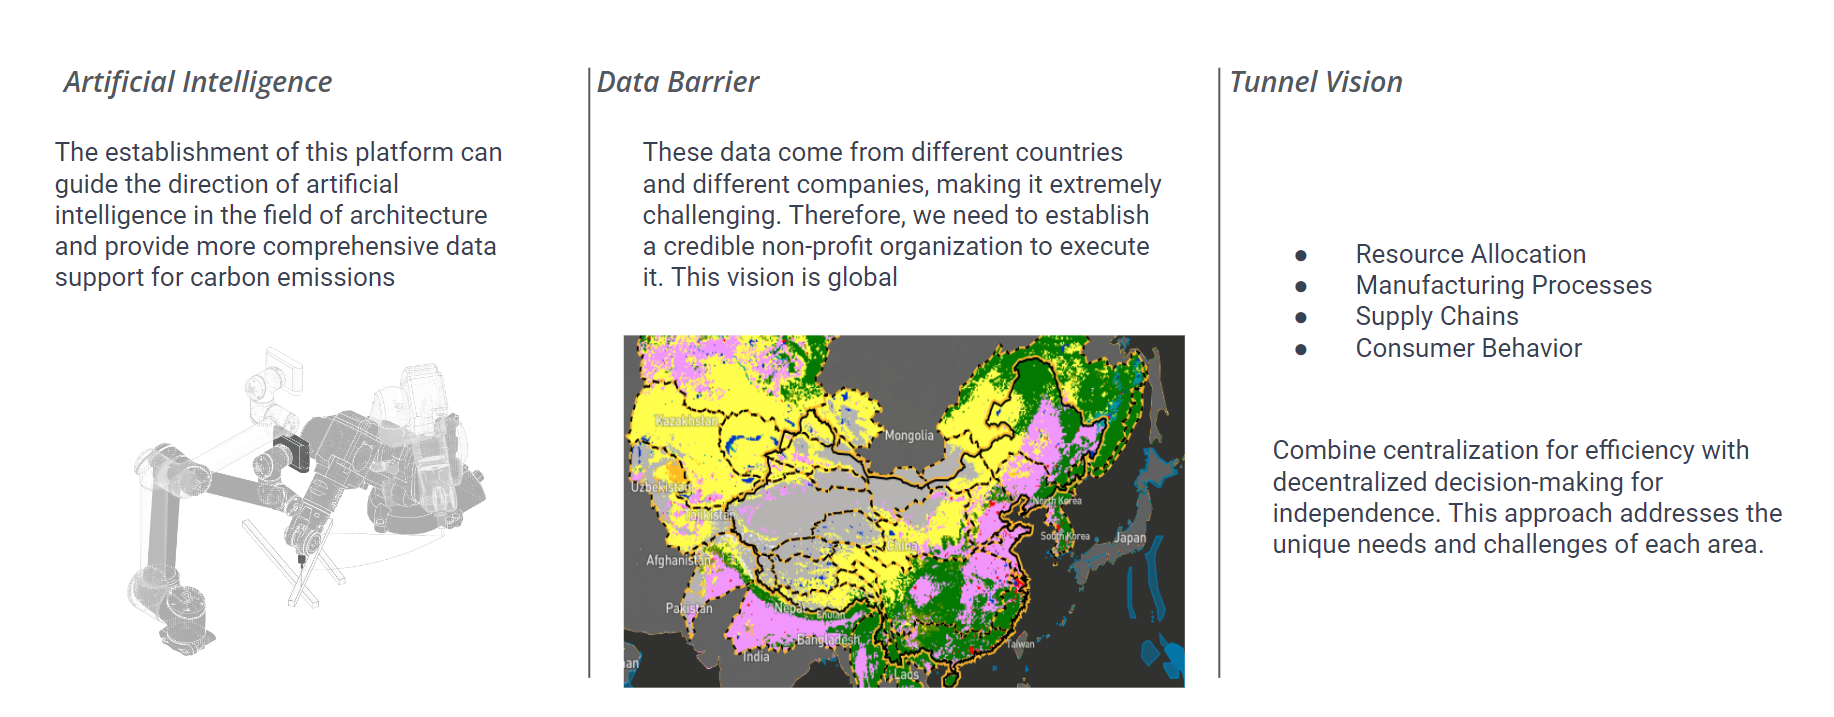
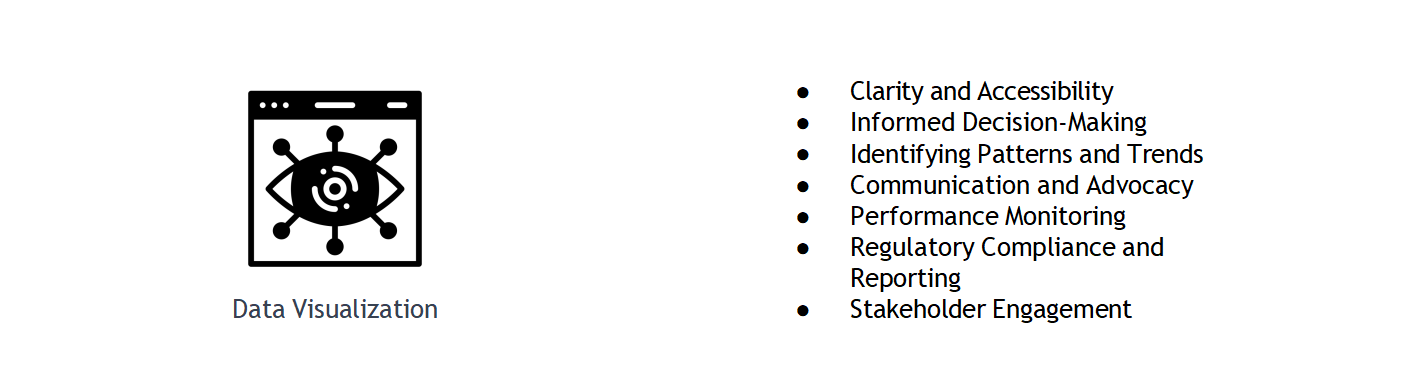
Data visualization is crucial in tracking building lifecycle carbon emissions as it provides a clear and accessible.representation of complex environmental data. By visually presenting the carbon footprint of buildings, decision-makers can better understand the impact of their choices on sustainability, fostering informed decisions related to design,construction, and operation. This visual representation helps in identifying trends, areas for improvement, and showcasing the effectiveness of sustainable practices, ultimately guiding individuals and organizations towards more environmentally responsible choices in the built environment.
STATE OF THE ART
DataVisualization
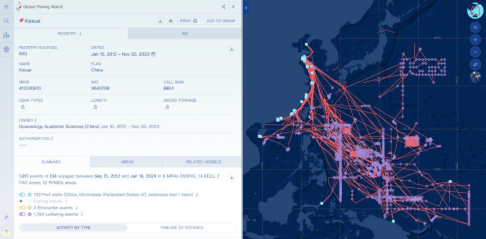
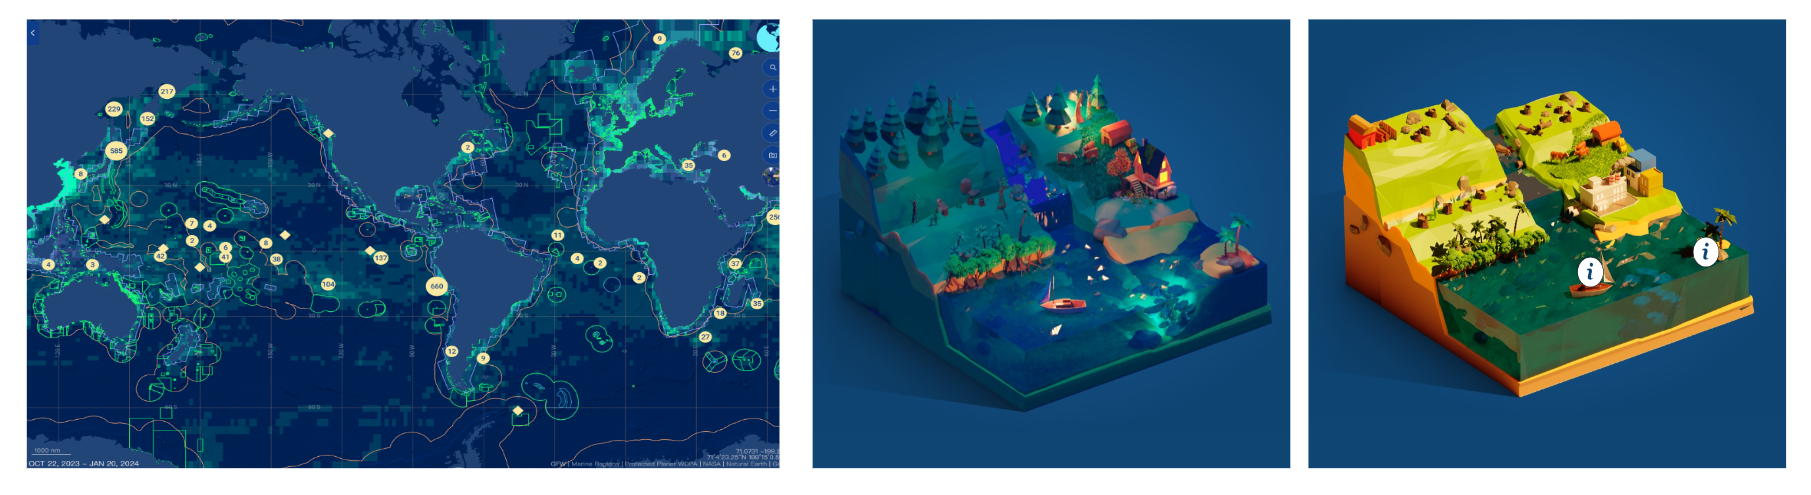
Global fishing watch is the first open online tool platform to visualize and analyze fishing vessel-based human activity at sea. Powered by satellite technology and machine learning, the map incorporates positioning and tracking data of fishing vessels, cargo ships, passenger ships, scientific research vessels and other vessels to provide a global view of human maritime activities, including fishing activities, night-light vessel detection and vessel existence, etc.
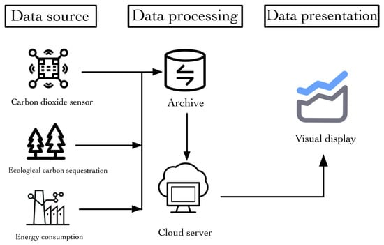
Workflow
As an important tool to help decision-making in the information age, data visualization technology also plays an essential role in the sustainable development of society. From a regional perspective, effective visualization technology can be used to manage the overall carbon emissions in industrial parks and help urban planners and policymakers make more rational scientific decisions.
METHODOLOGY
A ‘centralized’ carbon footprint monitoring system helps decision-making by making it more efficient and easier to monitor. It gathers data for better insights and simplifies monitoring tasks.
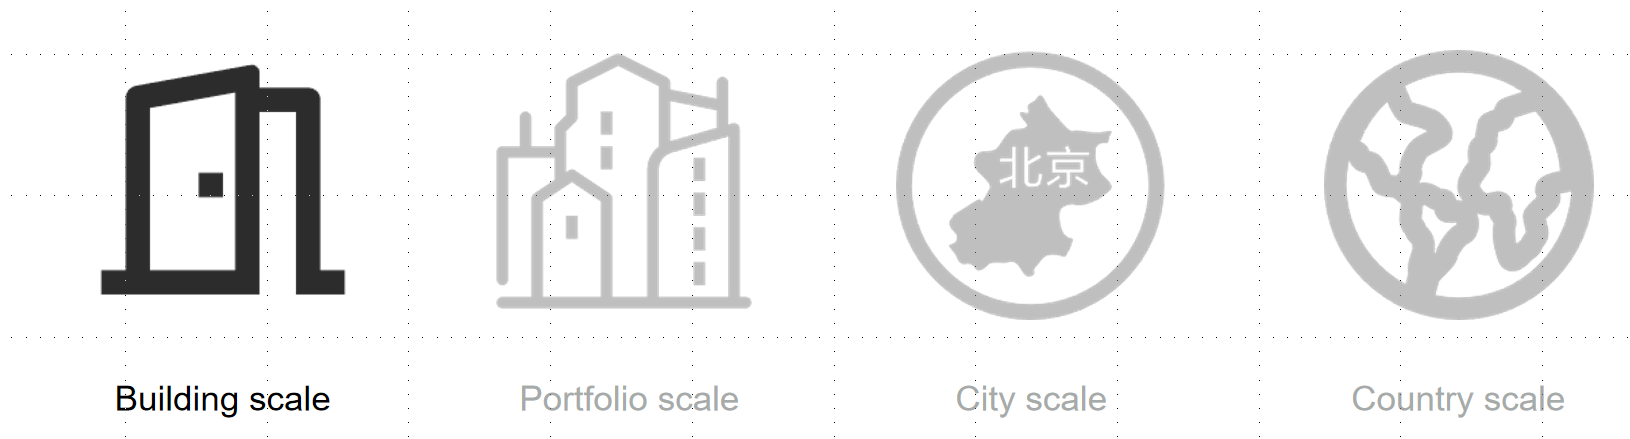
Building scale
We aim to explore from the perspective of individual buildings. Since buildings themselves are comprehensive systems, effectively monitoring carbon emissions at this systemic level is a challenge. A potential solution in the future might involve expanding the monitoring scope to the city or national level
Existing System ?Base on BIM?
Re-examiningtheexistingsystem:Wereviewthecurrentsystemandexplorewaystotrackcarbonfootprintswithinit, aiding decision-makers in making better choices
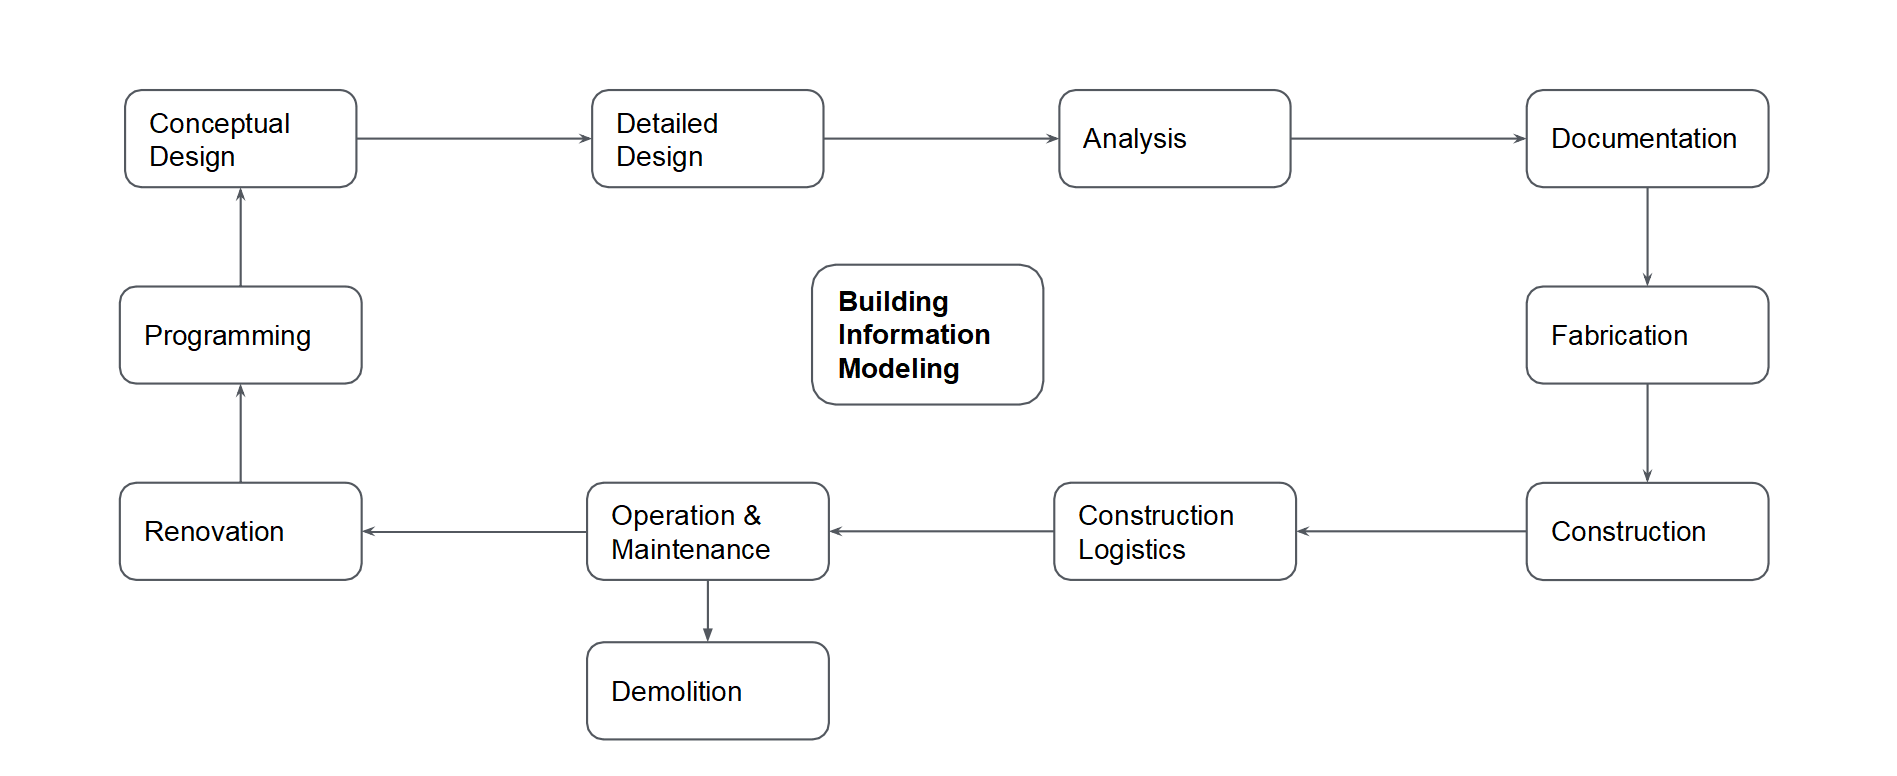
Workflow?Base on BIM?
Weanalyzethecurrentsystem,breakingdowneachsteptocalculateitscarbonfootprintconsumption.This helps decision-makers make better choices.

Decision_Making:Byintegratingexistingcalculationmethodsintothesystem,decisionmakerscanmakebetterdecisions.

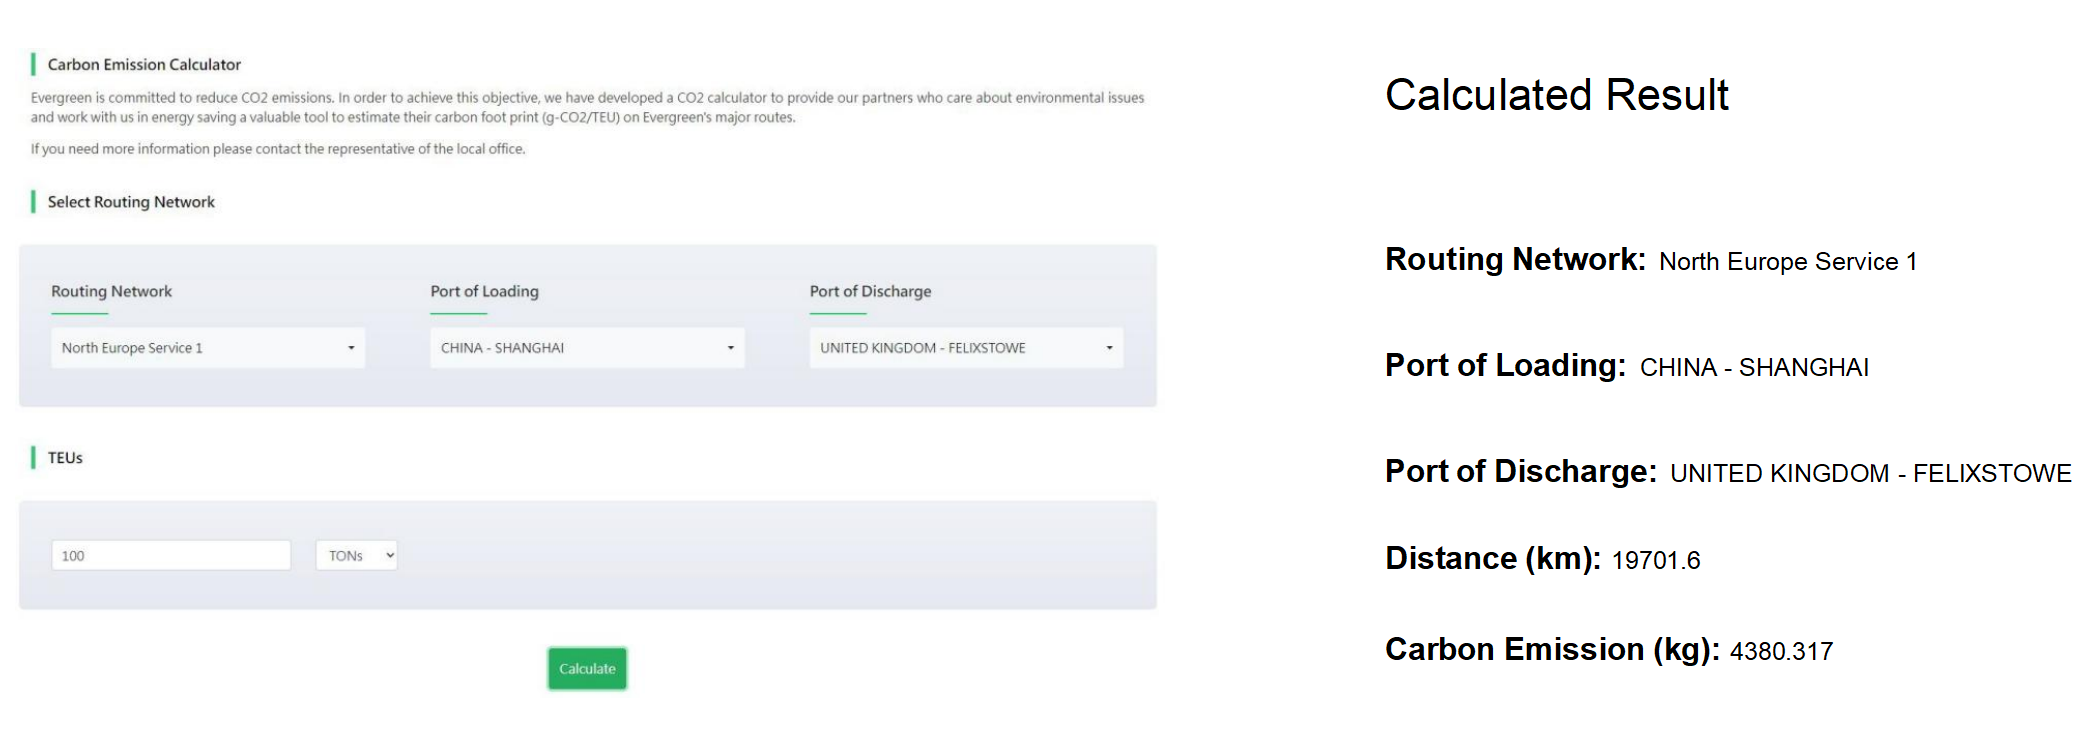
Calculation:
By integrating existing calculation methods into the system, decision makers can make better decisions.
WORKFLOW
Global Carbon Atlas
This is the carbon monitoring feature within the Global Carbon Atlas.It’s a platform for exploring carbon emission data and visualizing it.We studied its workflow, from data processing to visualization types and further segmentation
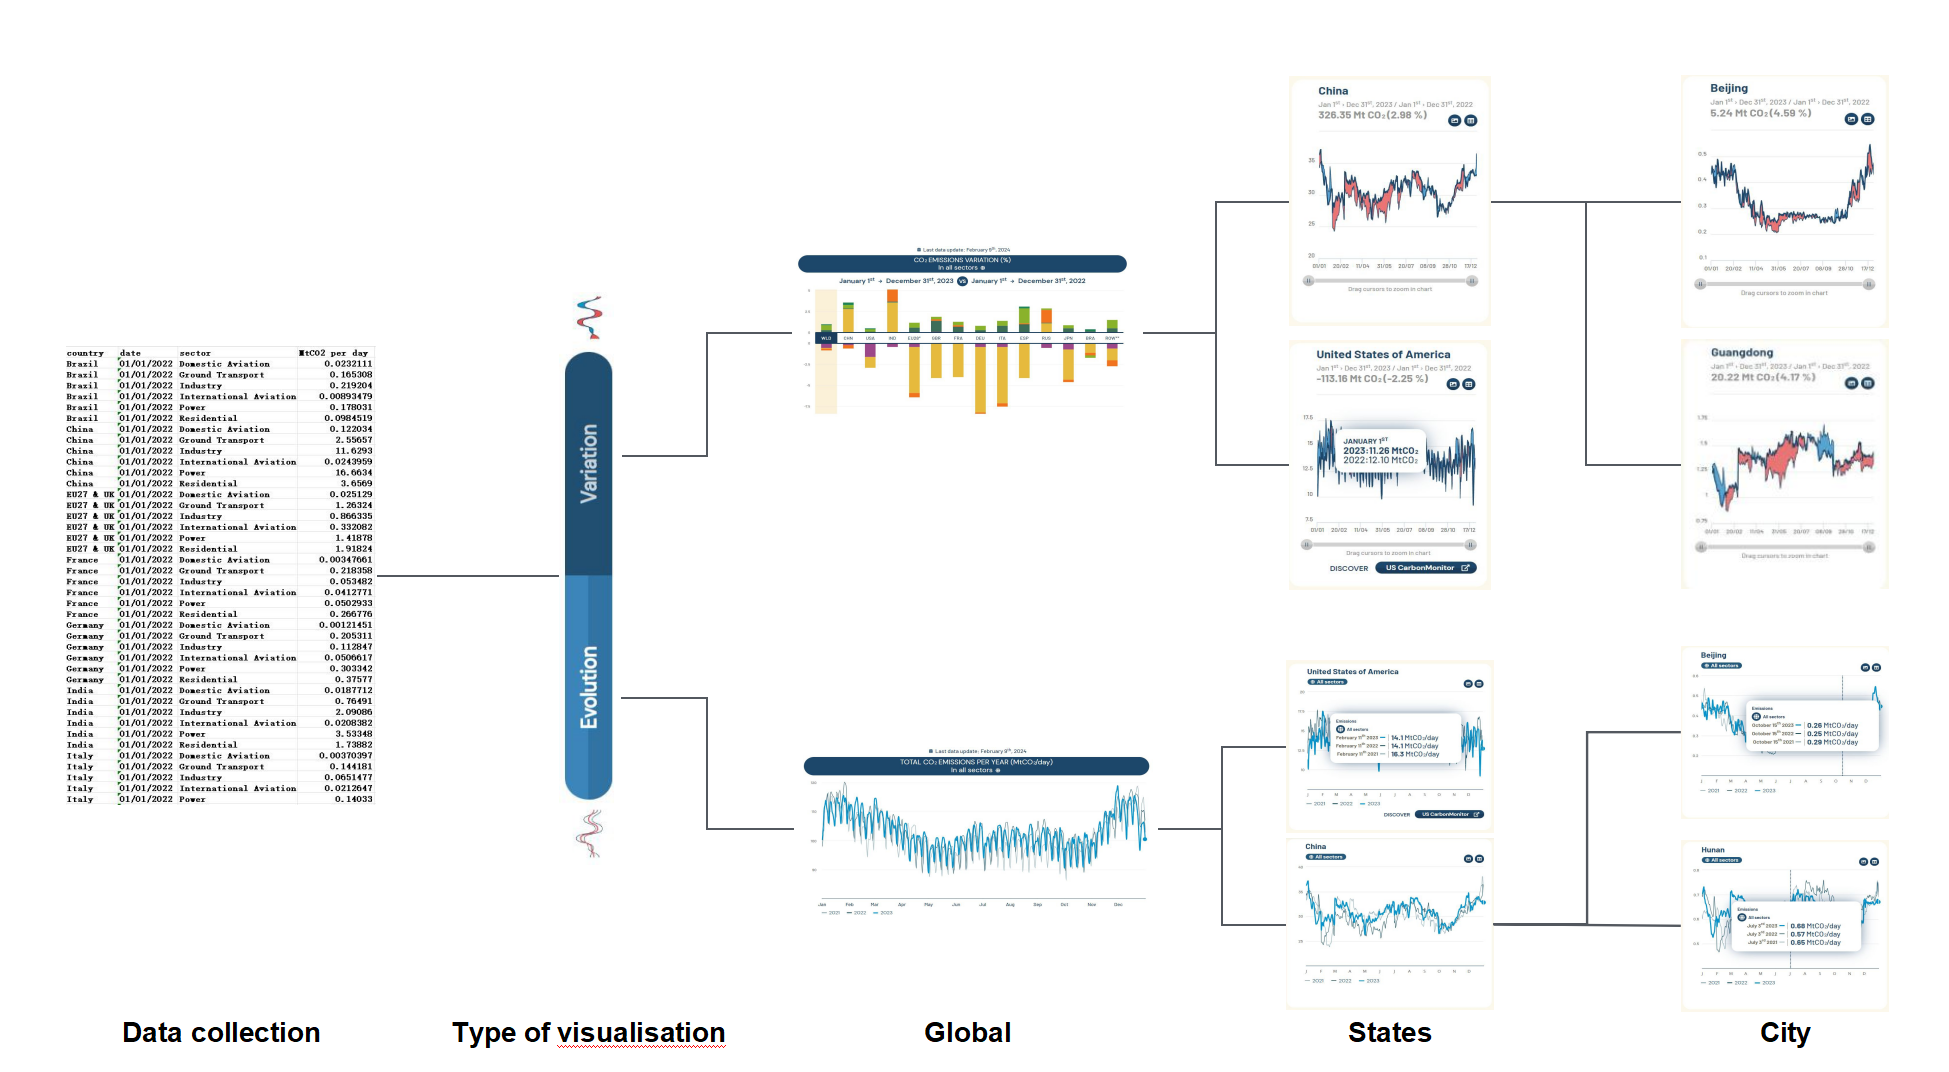
Data_visualization
Based on this workflow, We’ve developed our own workflow. It starts with data processing, moves on to selecting visualization types, and then involves data segmentation. Finally, we’ve added a “future prediction” feature to delve into the data, allowing for Deep learning and prediction. Different information to different audiences. For example, governments need a macroscopic understanding of this data, while architects require more detailed information to guide their design.

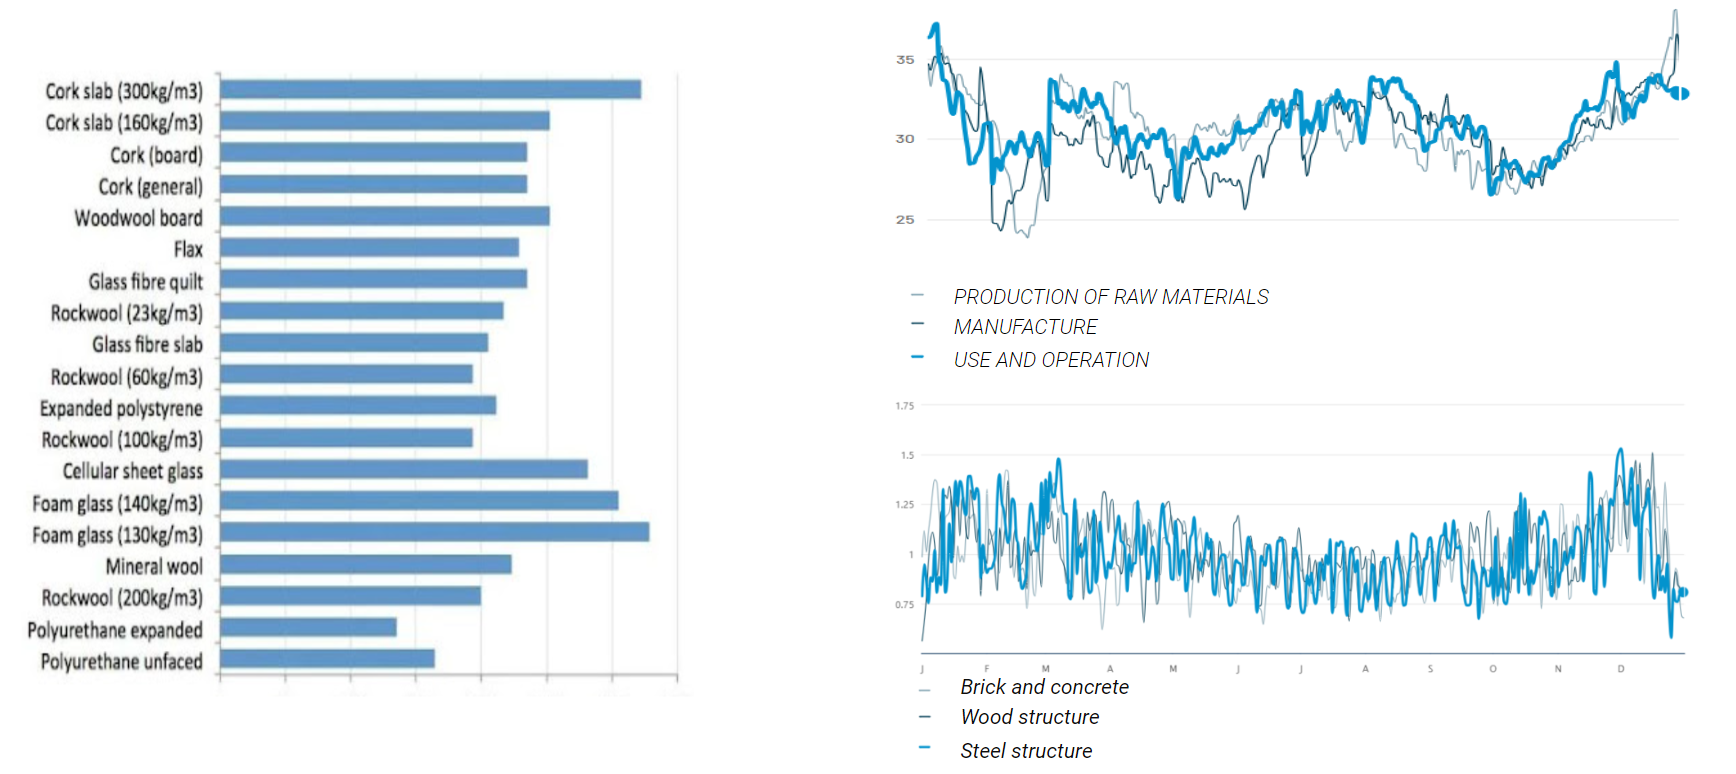
Data requirements
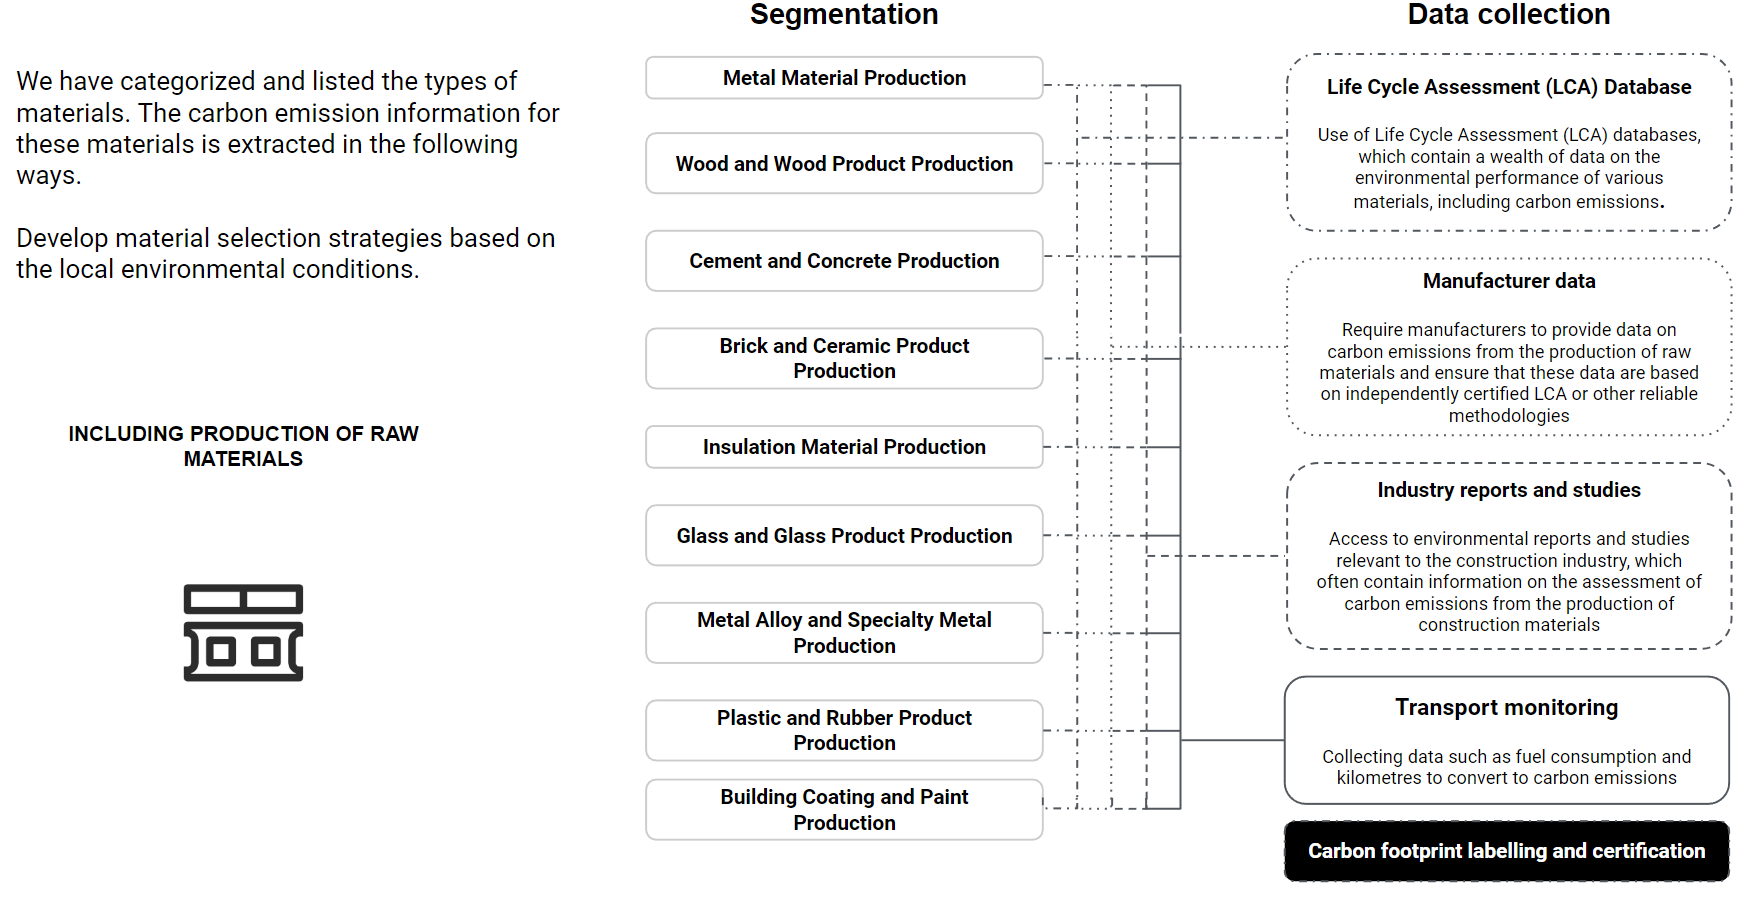
We focus on collecting data from the raw material and manufacturing stages. In the raw material stage, we seek information on the carbon emissions related to the materials themselves and their processing, while for the manufacturing stage, the demand is for data concerning building systems and construction processes.

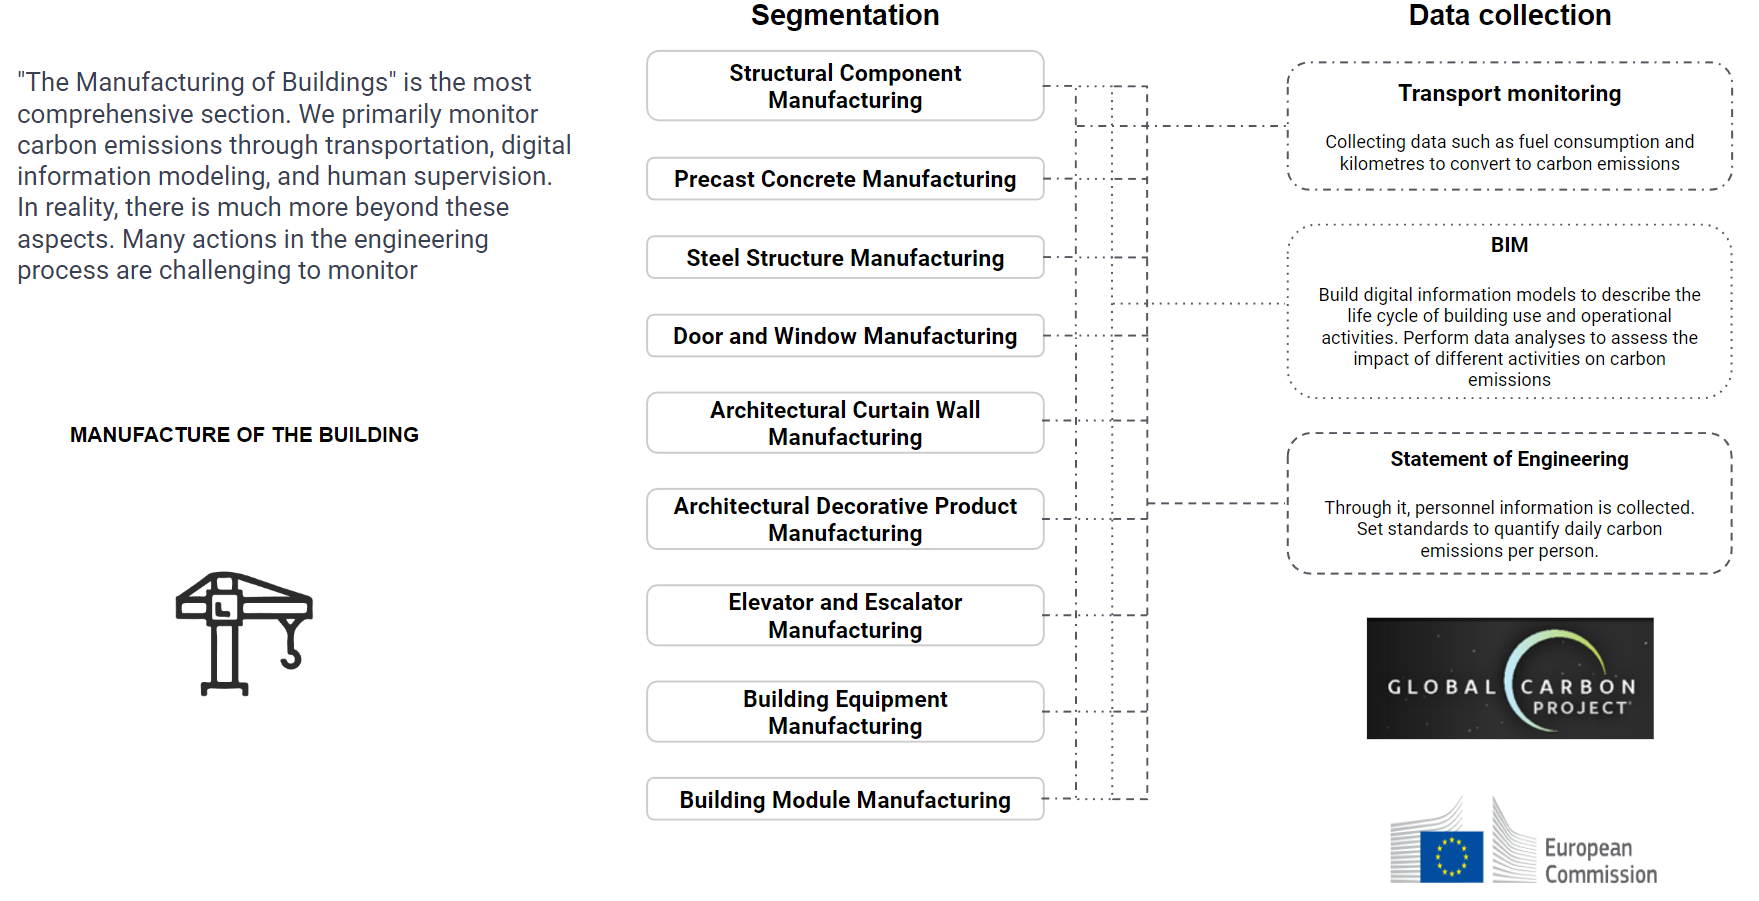
Segmentation and data collection
INCLUDING PRODUCTION OF RAW MATERIALS
This is the approach to data collection in the raw material stage. We divide these areas into subcategories and search for potential sources of data.
MANUFACTURE OF THE BUILDING
For the manufacturing stage, we’re taking a similar tack.We utilize carbon data platforms, BIM (Building Information Modeling) models, and various reports to gather data.
Architects
Architects can access carbon emission information for various materials, different stages of Building, and different construction techniques on this platform. Based on this information, they can better guide their designs and material selection.
Governmentregulators
Government regulators can leverage the system to understand the impact of carbon emissions from each building on the surrounding geographical environment. This understanding enables them to macroscopically regulate policies and directions accordingly.
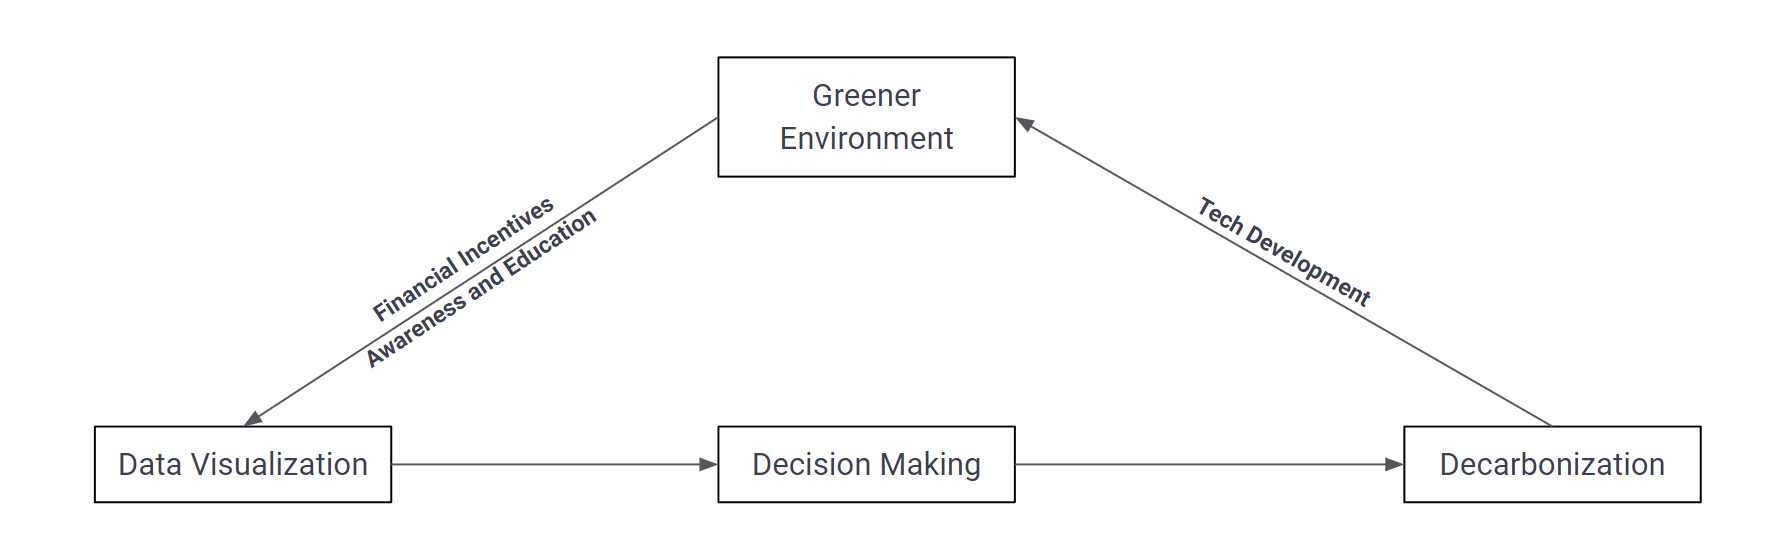
Flywheel effect
We try to build a positive loop. In the early stage, we need laws and regulations to force relevant people make better decisions to help decarbonization, and provide certain economic rewards, so that more people or companies will join in to further promote this loop.
At the same time, we need to spread relevant concepts and knowledge through education, and form a common sense without the need for laws, regulations and economic rewards, so that this loop can run automatically.
Further Steps