
Introducing DeCARB: An easy-to-use tool that calculates Embodied Carbon, End-of-Life Carbon, and Total Cost for any rectangular massing geometry. Quantifying emissions from material extraction to disposal can guide architects and engineers in selecting low-carbon materials and methods early in the design process. With a focus on reducing environmental impact and aligning with green building standards, DeCARB ensures structures meet ambitious carbon reduction goals. Future-proofing designs, consider the full lifecycle, promoting responsible choices yet viable solutions from inception to demolition. In a world prioritizing climate action, DeCARB stands as an essential tool, enabling informed decisions that shape a greener, more sustainable, and economically viable built environment.

DeCARB is accessible to everyone from clients and contractors to municipalities and architects or engineers who want to keep track of their proposals from the early design phases. The Application uses data from the Swiss KBOB Database for materials and energy carriers and collects information that is stored in the backend of the grasshopper script.
_Methodology
Unlocking Sustainable Building Design
Following step by step I will explain the methodology behind DeCARB and how it works, allowing users to input a rectangular mesh massing model, configure construction parameters, and receive detailed analyses of carbon emissions and structural characteristics.
BACKEND
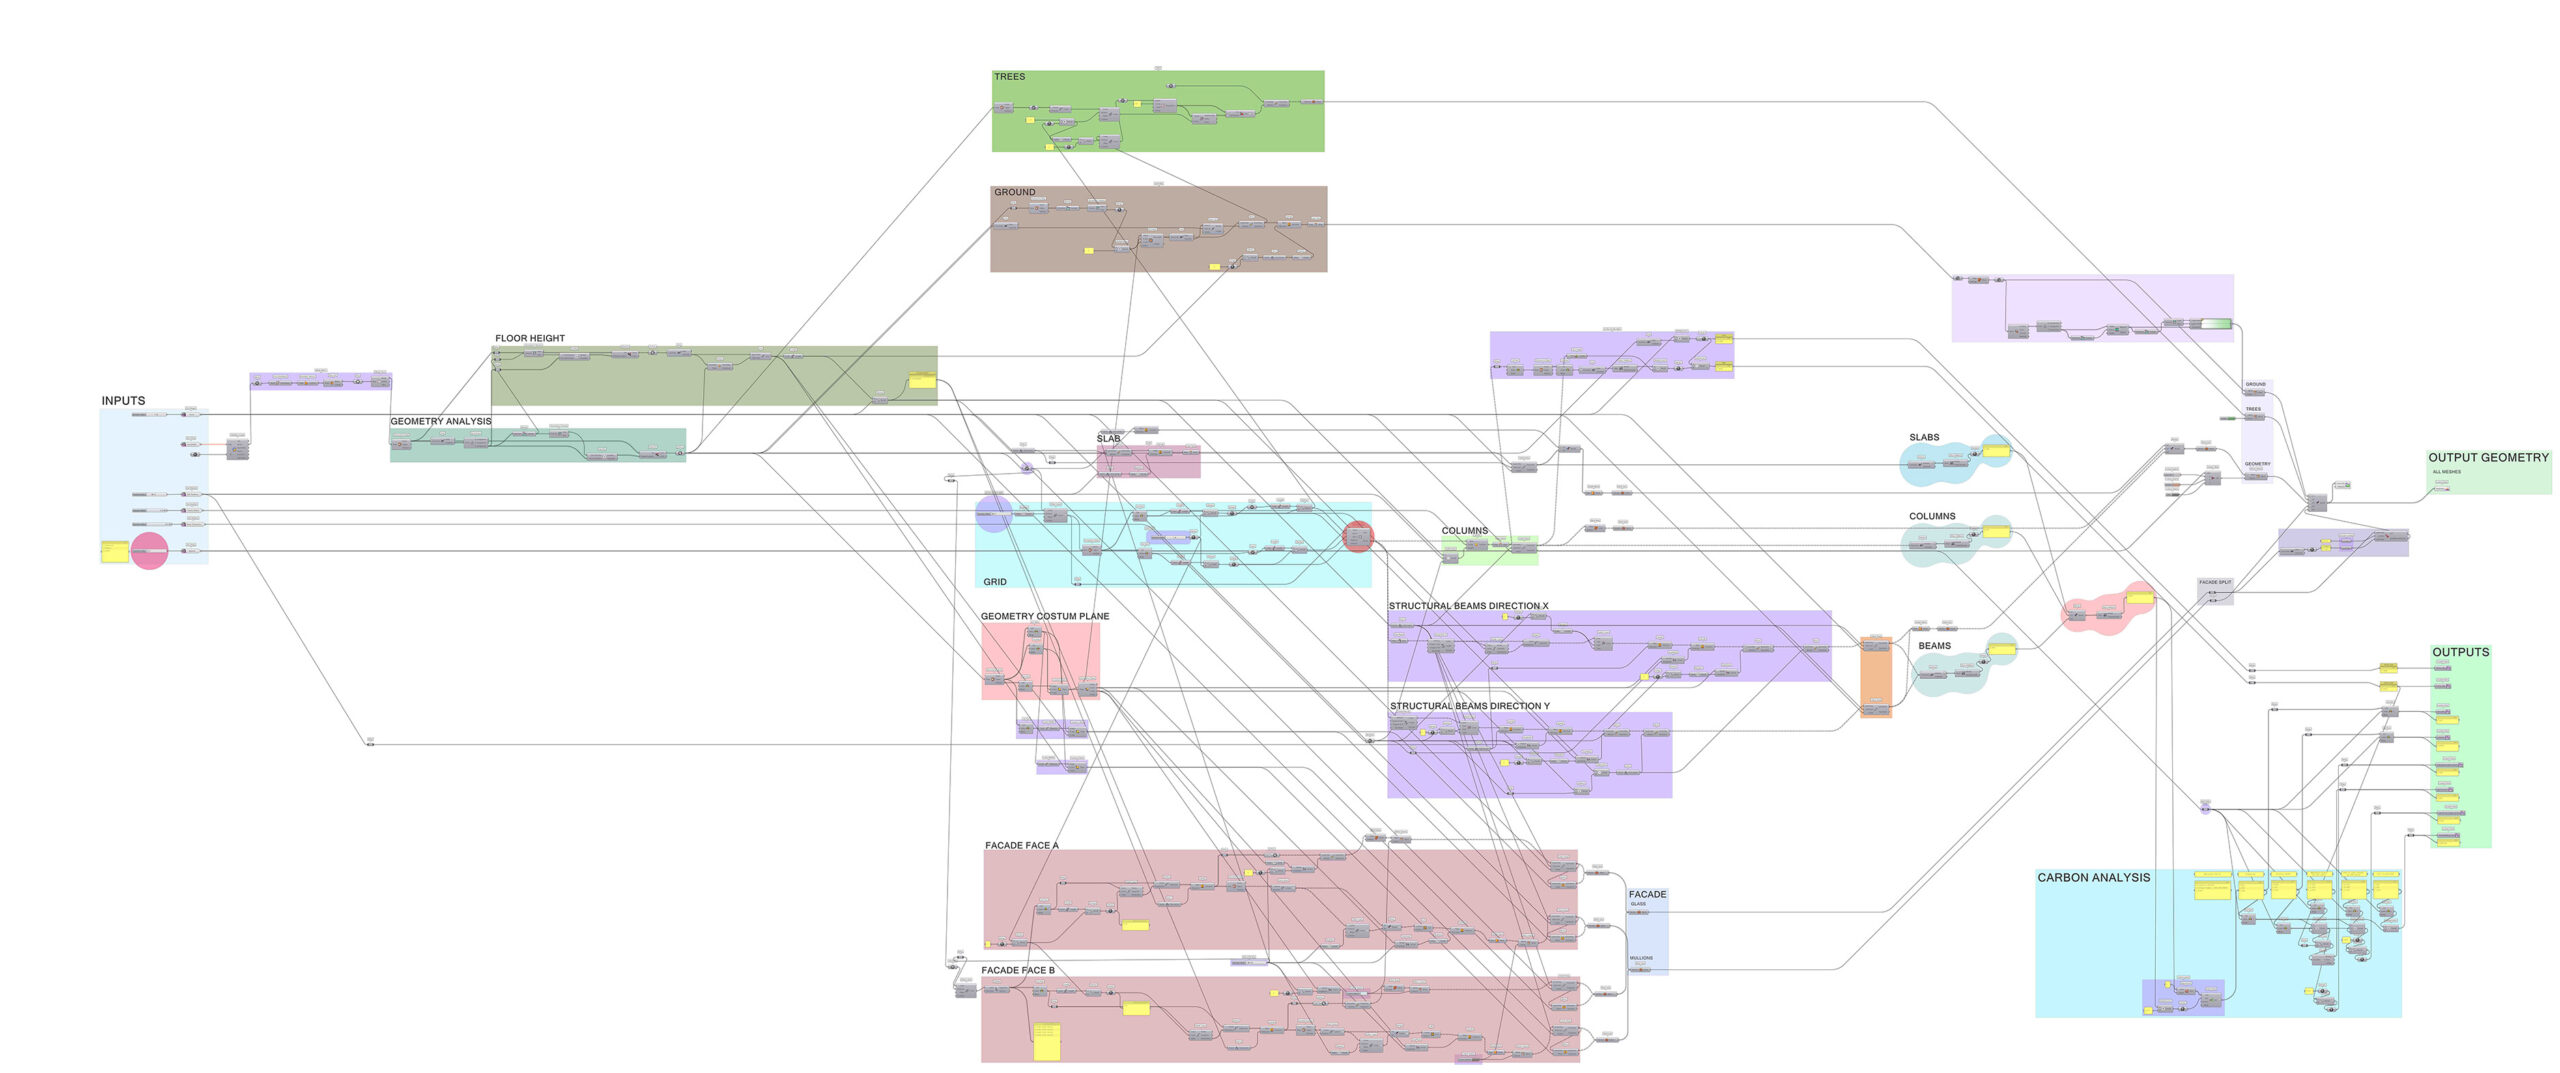
1. Harnessing Backend Power with Grasshopper, Rhino.Compute, and Hops:
Behind the scenes, DeCARB leverages the power of Grasshopper, Rhino.Compute, and Hops running on a server. Grasshopper processes data on the backend, Rhino.Compute analyze the data in an online server without the need of Rhino providing the computational power of the software, and Hops facilitates seamless communication between the web application and the Grasshopper scripts receiving and sending the data in a structured way.
2. Crafting the Frontend Experience with Vue.js:
To configure and structure the application I used Visual Studio Code using JavaScript, CSS, and HTML. The frontend of DeCARB is built using Vue.js, a popular JavaScript framework. Vue.js ensures smooth interaction between users and the application, allowing for intuitive input of massing models and selection of construction parameters using various input options like Sliders, Toggle Switches, Text inputs, Dropdown Menus, and Buttons.
3. Bringing Designs to Life with Three.js:
Without the Rhino interface, we needed another way to visualize the data on the web. For that to be able to visualize our building geometry in real-time I utilize the Three.js library. With Three.js, users can interactively explore their designs, gaining a deeper understanding of the structural elements and design choices in the browser.
FRONTEND
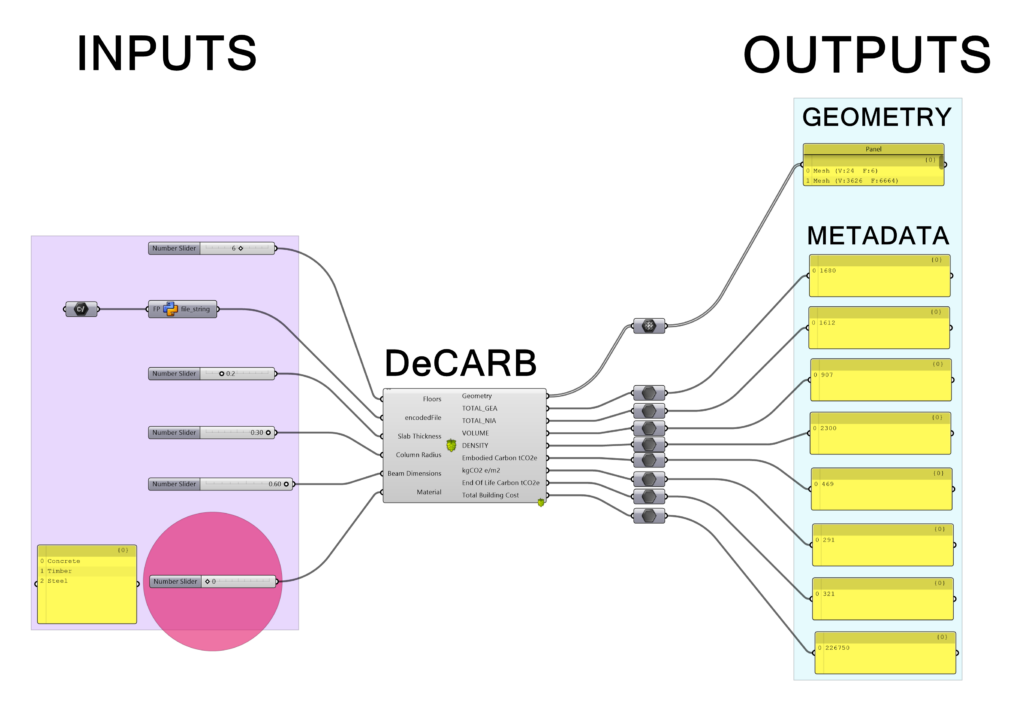
4. Inputting and Analyzing Massing Models
In the frontend the only thing users need to do is to provide with the desired massing of their building geometry in a .3dm Rhino Mesh format (Version 01.0 works only with rectangular mesh volumes) and specify the Number of Floors the given massing represents, the desired Slab Thickness, the Column size Radius and the Beam Dimensions represented by width and height as an equal number. The Grasshopper script then analyzes the model, generating a prototype building complete with columns, slabs, beams, and a glass curtain wall facade.
5. Calculating Carbon Emissions and Structural Metrics
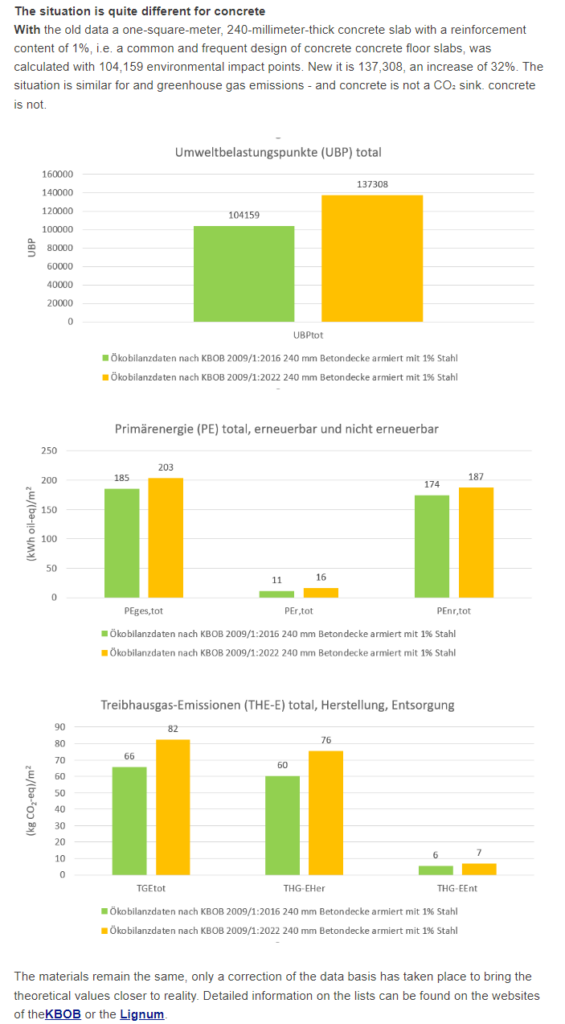
DeCARB utilizes data from the massing analysis to calculate Carbon Emissions. By incorporating life cycle assessment material data in the construction sector from the Swiss KBOB database, the application estimates embodied carbon, providing users with insights into the environmental impact of their designs.
Life cycle assessment data in the construction sector
6. Presenting Results in a User-Friendly Interface
The results of the analysis are presented in a clear and intuitive interface using Vue.js and CSS. Users can review building information such as GEA, NIA, Overall Structural Volume, Chosen material density, Total Embodied Carbon, Embodied Carbon per sqm, End of Life Carbon, and Cost in Euros.
7. Exploring Different Construction Methods and Configurations
DeCARB allows users to test various construction methods, including concrete, timber, and steel. Users can compare results between methods and explore different configurations by adjusting structural parameters such as slab thickness, column size, and beam dimensions.
_Web App Interface
The web application interface consists of a Sidebar on the left of the screen containing a brief description of the app with instructions on the top. Under that, we have our input options:
INPUTS
- First, we need to import our rectangular massing model in a .3dm Mesh format.
- Second, we need to choose our desired building material from the dropdown menu (Currently only 3 Options are available in the first release of the app 01.0).
- Third we need to choose how many floors our massing consists of, to let the app know how many floors we need to fit in the given massing model and generate the structure of the building accordingly.
- Fourth we have the option to choose our Slab Thickness in meters.
- Fifth we have the option to choose our Column Radius in meters
- Sixth we have the option to choose our Beam Dimensions, as a rectangular cross-section of equal width and height. In meters.
- Lastly we Press Run Analysis and wait for the application to run for about 5-10 seconds.
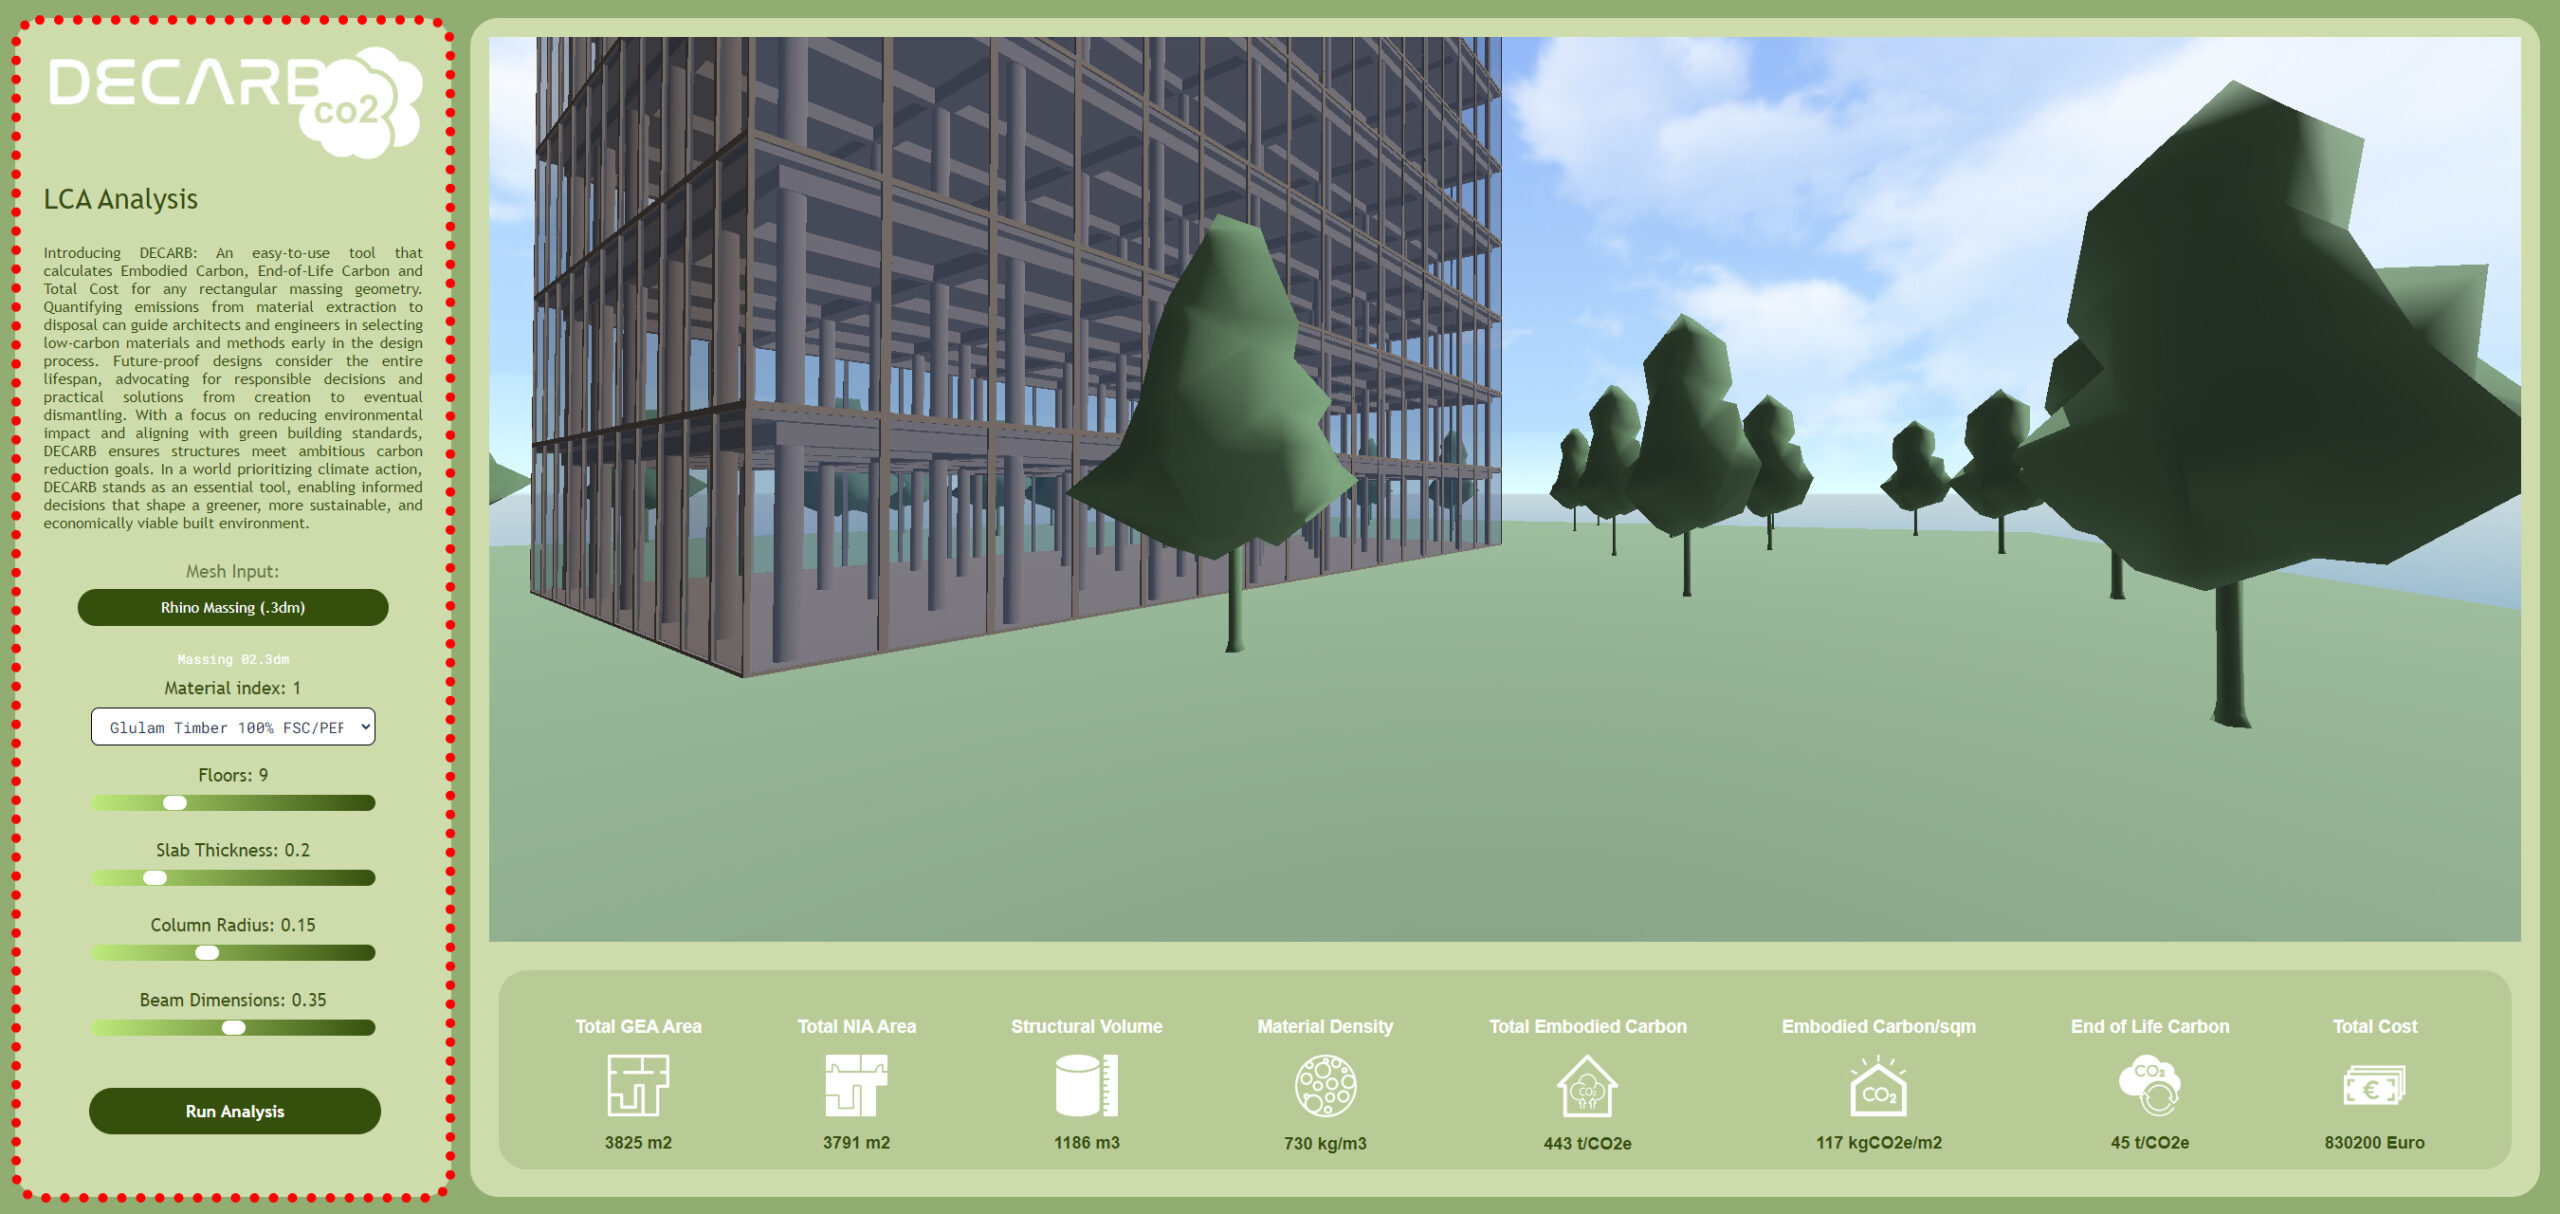
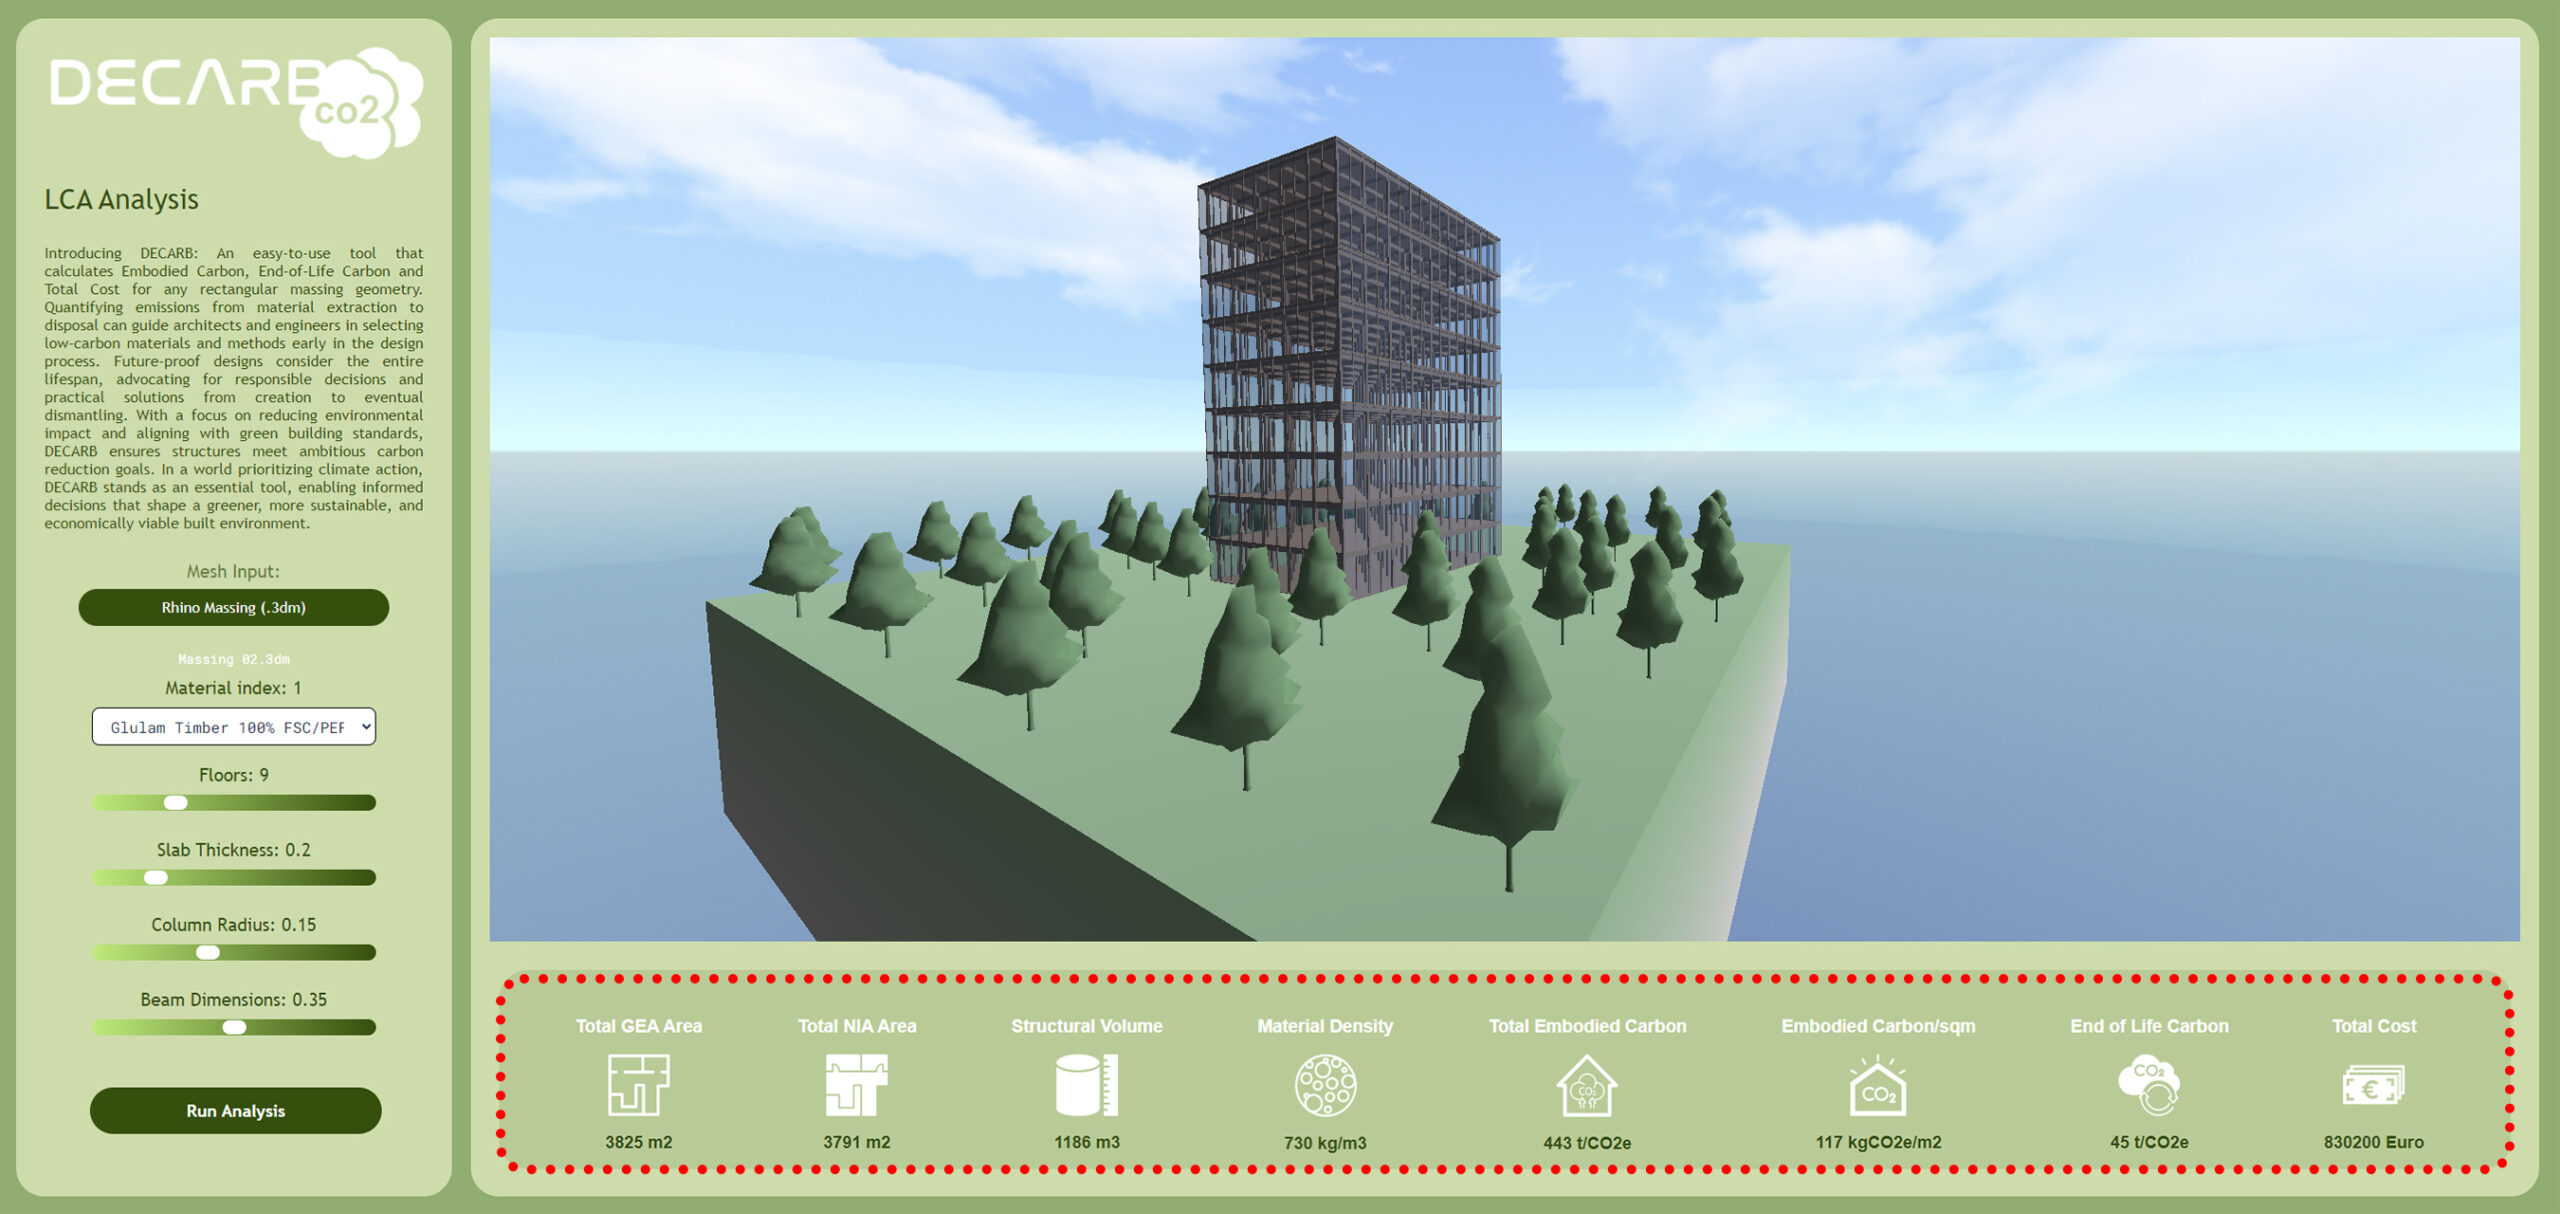
OUTPUTS
On the right side, our interface consists of our Viewport Window on the top where users can freely orbit, rotate, and zoom in and out using their mouse controls to view the resulting building geometry.
On the bottom, we can see all our analysis data results and metrics. From left to right we can see our:
- GEA
- NIA
- Overall Structural Volume
- Material Density (we choose from the dropdown menu)
- Total Embodied Carbon
- Embodied Carbon per sqm
- End of Life Carbon (after demolition)
- Total Cost
_Application Demonstration
With DeCARB, sustainable building design is made accessible and actionable. Users can now harness the power of computational analysis from their own browser with a single click, to create environmentally responsible structures that meet ambitious design goals.
In a world prioritizing climate action, DeCARB version 01.0 stands as an essential tool, enabling informed decisions that shape a greener, more sustainable, and economically viable built environment.
Links:
Vue.js Framework: https://vuejs.org/
Three.js 3D Library: https://threejs.org/
_Deployed Application Link
Final Project: https://datamgmt24.iaac.net/
