
The project is situated in Athens, Greece, which overheats in the summer. We wanted to test a hypothesis: The overheating is the result of too much hardscaping (asphalt, concrete, brick) and not enough greenery. We wanted to compare the NDVI (a measure of greenery in a city) taken from Satellite images to Land Surface Temperature mapping from Google Earth Engine Database and determine visually whether areas with more greenery kept cooler during the hot summer months.
The research presented here will be of growing relevance as rising climates worldwide will necessitate urban designers to incorporate more greenery and less hardscaping in urban spaces.
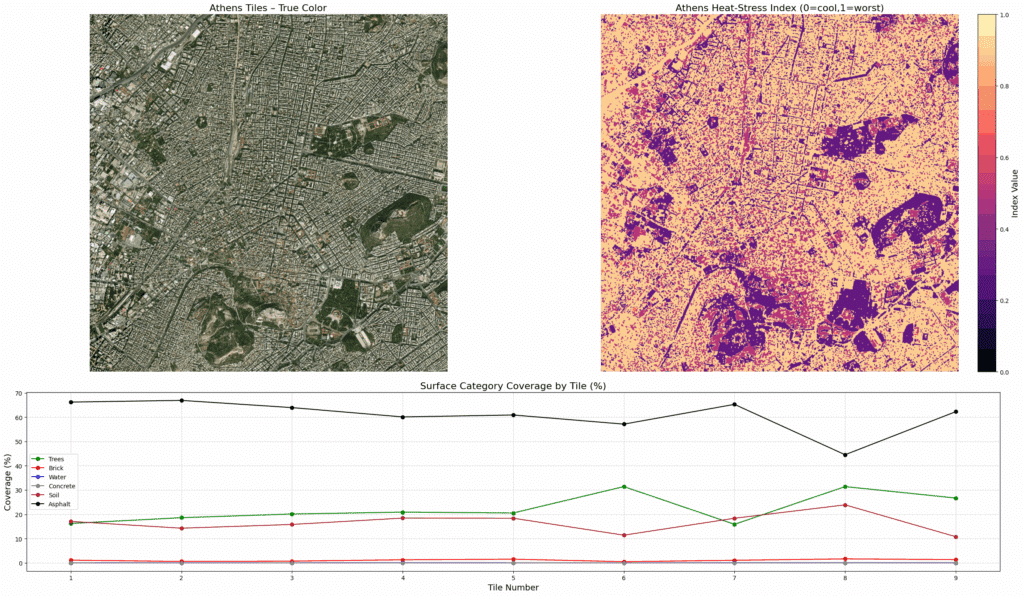
Image 1 shows raw satellite image of Athens on the Left, with a Heat Stress Index Analysis on the right. Areas with higher heat stress are associated with hardscaping (asphalt, concrete) while areas with lower HSI are associated with softscaping (vegetation, soil).
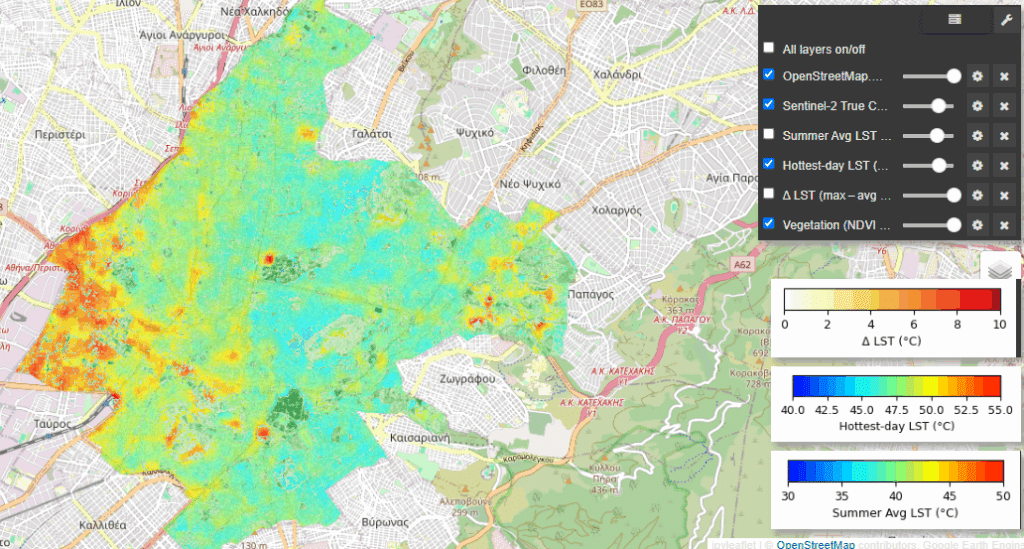
Image 2 shows color segmentation masks of green spaces overlaid on thermal imaging of the hottest day in Athens of 2023. Heat is shown as a color spectrum from cyan (cooler) to red (hotter). Visual inspection shows that areas with dense and large amounts of vegetation tended to have cooler climates on hot days, while areas with little planting had hotter microclimates on hot days. The thermal images also correspond to the Heat Stress Analysis performed in Image 1; darker areas in the HSI analysis correspond with cooler climates and vice versa.
We compared green spaces in Athens to Land Surface Temperatures from Google Earth Engine. We found from visual comparison, that areas with more greenery tended to have lower surface temperatures, while areas with more hardscaping tended to have higher temperatures. This correlation suggests that hardscaping (asphalt, concrete) increases the heat stress, and that some of the heat stress in Athens could be mitigated by increasing planting in the city. Also, the thermal imaging show where heat stress is the highest – these areas are high priorities for Athens urban designers for cooling strategies.
It was fascinating to see hard data in the form of satellite and thermal imagery that showed the relationship between landscape and real local climate data.
This study had certain limitations. Thermal imagery is limited in resolution at the moment. The highest resolution thermal images we could find had a resolution of 100 meters by 100 meters, which is too large to capture the climate improvements from small scale greenery interventions. At this scale, we could only observe the microclimate benefits that accrued to medium to large park areas. While this was enough to verify our hypothesis that greenery had a positive impact on local climate, it wasn’t able to give granular information about tactical or surgical interventions to urban designers.
A potential next step would be to determine the quantitative impact of greenery and vegetation on heat stress in Athens, so that urban designers would have an additional tool to evaluate the potential benefits of planned interventions. As well as the detection of other types of surfaces, topography, but also population and human circulation; and run all this data in a regression model to try and the determine what is the biggest(s) factor in the heat island effect in Athens.
