
Navigating Urban Realities through Women’s Perception of Safety
Cities all over the world are being quantified and rated in terms of their livability and life quality for better understanding of citizen satisfaction. Safety, including both the tangible aspects and the subjective perception of safety, is a critical component in assessing urban life quality. According to the annual ratings by the Economist Intelligence Unit, Melbourne is the only Australian city to secure a spot in the top 10 of the world’s most livable cities in 2022 but also was ranked 8th overall in the Safe Cities Index.
However, cities are seldom perceived as wholly safe or unsafe for all people and at all times. This reveals the complex experiences of the physical environments. There are different perceptions of safety in the city and are highly depended on WHO we are, the different identities we carry. Women learn to ‘read’ the physical and social aspects of a public space for clues around risk and experience public places differently from men

In 2016, a pilot project called Free to Be was developed, a collaboration between Plan International Australia, CrowdSpot, and Monash University’s XYX Lab that constitutes a crowd-mapping tool showing how safe women and girls feel. More precisely, it crowdsourced the safety-related experiences and emotions of women in Melbourne.
Women’s safety in cities can be defined based on two parameters, the perception of safety and the Gender-based crimes and is very closely tied to the notion of sexual safety. We believe that cities do not produce gender-based violence but they create situations that make women more vulnerable to violence and harassment through both social factors and poor design.
HYPOTHESIS
“The physical environment of urban areas influences the occurrences of gender-based crimes and the spatial patterns of these occurrences are related to the movement and activity of people. Even if a street is well-connected and lively, certain elements of the built environment can still be perceived as unsafe.”
METHODOLOGY
STEP01: Soft Data Analysis
The Free to Be dataset provides valuable insights into the actual experiences and perceptions of safety among women in the city. This dataset contains geolocated spots that captures reported experiences, including the time of day, age of the participants, their emotional responses, and their explanations for their feelings (safe/unsafe).
- Among the 1318 reported locations detailing both safe and unsafe experiences, our focus primarily lies on the subset of unsafe pins, which constitutes approximately 70% of the dataset.
- Over 50% of the participants, spotted unsafe pins in that dataset fall into the age group of 20-29 years.
- Only 12% of the unsafe experiences occurred during daylight hours, indicating a small minority in comparison to the afterdark category.
- A significant portion of participants, accounting for 74%, felt comfortable sharing their experiences and elaborating on the factors that led them to perceive certain locations as unsafe.
- Sexual harassment emerged as the predominant reason for marking a location as unsafe among harassment, sensory, spatial and activity factors.
To assess the representativeness of the Free to Be dataset and explore spatial correlations, crime data was utilized provided by the Crime Statistics Agency of Greater Melbourne. The analysis specifically targeted reported incidents of gender-based violence, which were then cross-referenced with census data. To ensure comparability, the results were normalized based on the area in square meters for each local government area. The map highlights a significant concentration of gender-based crimes in the city center of Melbourne (with higher population densities and with higher activity use) and its surrounding areas, aligning with the spatial pattern observed in the Free to Be dataset. Based on that pattern, the area of analysis is identified.
The descriptions provided by women regarding their experiences were stored in a categorical data column. By extracting keywords and identifying the most frequently mentioned ones, five new columns were generated: (1) sexual harassment and (2) harassment to represent actual incidents, and (3) sensory, (4) spatial, and (5) activity to represent the perception of safety. These columns were filled with binary values (0 and 1) based on the presence of the corresponding keywords.
STEP02: Spatial Analysis
In the second methodological step, two conditions were established to identify the spatial characteristics of the unsafe pins in the Free to Be dataset.
- The first condition involved conducting a Space Syntax analysis within the street network as the layout. This analysis focused on angular integration and betweenness measurements, which assessed the centrality and potential movement through each street segment. These values were then associated with the unsafe pins by identifying neighboring street segments and calculating their mean values.
- In second condition, the analysis shifted to the individual unsafe pins themselves.
- A visibility analysis was performed using isovists, which calculated the volume of visible space from each unsafe pin. The building footprints served as obstacles, shaping the resulting isovist polygons.
- Catchment areas were defined for each pin based on a 10-minute walking distance implementing isochrones. The number of public transport stops and points of interest within these catchment areas were calculated, providing insights into the accessibility and liveliness of specific unsafe locations.
STEP03: Generating the Final Dataset of the Study
The final dataset of the study is generated by performing feature engineering and spatial analysis on the Free to Be dataset. Precisely, it comprises 918 unsafe locations in Melbourne and includes various attributes such as time, type of unsafe experience, angular integration and betweenness measures of the closest street segment, visibility, accessibility by public transportation, liveliness of the surrounding area within a 10-minute walking distance, and the location category (parks or public transport) where the incidents occurred.
STEP04: Statistical Analysis | Conclusions-Results
The statistical analysis focused on the street network, parks, and public transportation as primary areas of focus, while considering the remaining fields (type of unsafe pins, visibility, angular integration, angular betweenness, time, liveliness) as indicators/parameters. Approximately 15% and 20% of the total unsafe pins were located in parks and public transport, respectively, while the majority, accounting for 65%, occurred on the street network. The methodology employed for analyzing the unsafe pins in parks and public transportation involved assessing them based on time and activity. On the other hand, for the street network, the methodology differed slightly. It involves examining correlations between time and liveliness of public spaces as well as visibility, integration, and betweenness of the street network, for both the analysis of actual gender-based crimes and the unsafe pins related to the perception of safety based on the sensory factor.
- Analyzing the unsafe pins that located in parks reveals that the time of day has a crucial impact on women’s perception of safety in these areas. Specifically, when it gets dark, parks can become areas with insufficient lighting and limited visibility, turning into “dead” zones. This absence of proper illumination significantly raises the likelihood of sexual harassment incidents taking place within parks. In fact, park premises accounted for a significant proportion of the incidents of gender-based violence in the Free to Be dataset, specifically 45% of the cases.
- Regardless of the time of day, Public transport serves as a primary hotspot for sexual harassment cases in Melbourne. The data analysis highlights two significant patterns:
- The frequency of sexual harassment incidents at a transport station exhibits a positive correlation with the level of activity or the number of commuters present. As the station becomes busier with increased footfall, the likelihood of such occurrences also rises.
- During nighttime, transport stations with lower levels of activity and fewer individuals present create an ideal setting for gender-based violence crimes to take place. The reduced presence of people contributes to an environment conducive to such offenses.
- A significant portion, one-third, of the unsafe pins corresponds to gender-based violence incidents targeting women on the streets.
- Irrespective of visibility or centrality, it is evident that streets during nighttime present substantial safety risks for women.
- The reduced liveliness of certain areas plays a role in facilitating sexual harassment, encompassing not only less visible locations but also open (convex) spaces.
- The potential of a space to serve as a destination for movement is inversely related to its potential as a site for gender-based crimes.
- There is a robust correlation between the onset of nighttime and the heightened perception of unsafety in streets. The level of activity or liveliness in an area is a crucial factor contributing to the feeling of unsafety, even when a street segment is well integrated or considered to have a through-movement potential.
STEP04: DATA INTERPRETATION
In order to gain a deeper understanding of the safety conditions in various areas of Melbourne, it was deemed essential to complement the data analysis with a qualitative assessment of real-world circumstances. This involved conducting a comprehensive review of media articles and news reports to identify the most commonly cited unsafe areas. In the data interpretation part, two different cases were examined: The first case encompassed an area with a high density of unsafe pins, as indicated by both the Free to Be data and reports. In contrast, the second case involved an area perceived as unsafe despite exhibiting a low density of unsafe pins.
To capture the unquantifiable aspects of the urban environment that contribute to the perception of unsafety, eight main parameters were defined. The parameters considered encompass various aspects of the built environment such as building facades, land uses, presence or lack of vegetation and pedestrian-friendly conditions.
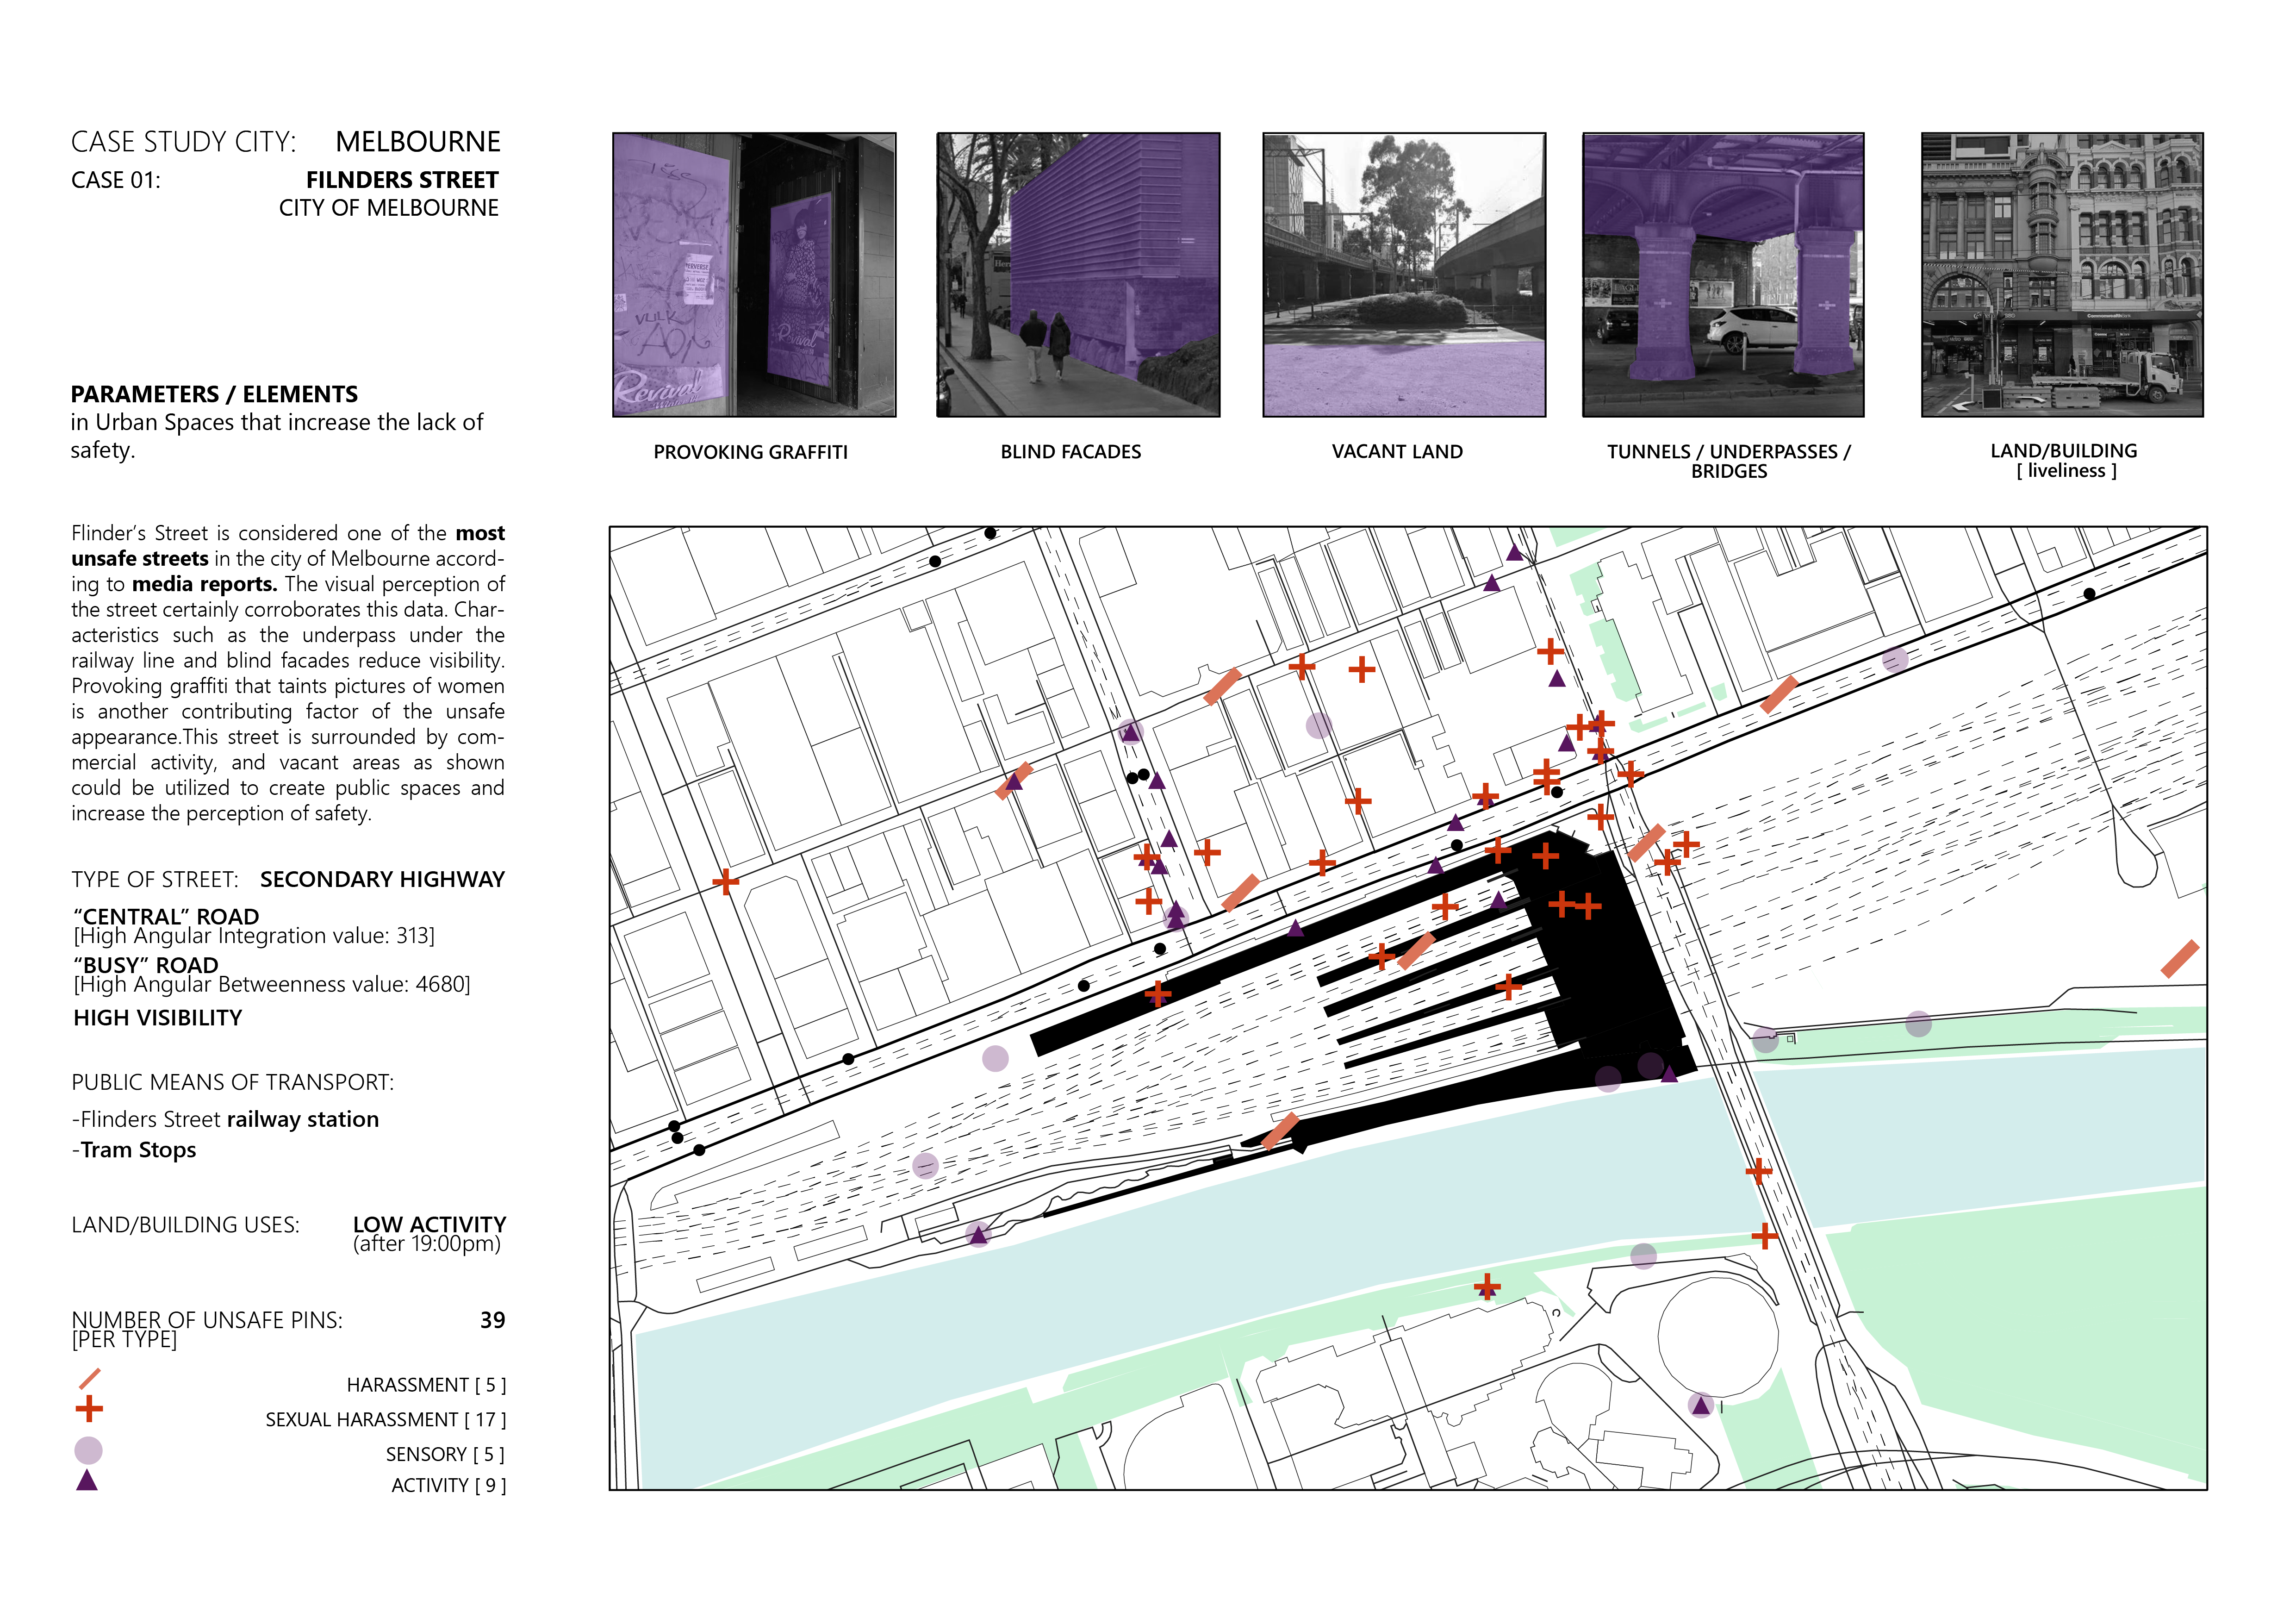
- CASE 01: Flinders Street, as reported by the media is widely regarded as one of the most unsafe streets in Melbourne. Despite being a well-integrated and highly visible secondary highway street, the presence of the central railway station of Melbourne contributes significantly to its perceived unsafety. Public transport in Melbourne is widely recognized as the primary hotspot for sexual gender-based crimes, which is further substantiated by the notable incidence of such crimes occurring in that area based on the Free to Be dataset. Additionally, factors such as the existence of provoking graffiti, blind facades, and tunnels/underpasses further amplify the perception of unsafety in the area but also the predominant land use, which consists mainly of commercial or office buildings. This results in the area becoming relatively inactive and less populated after 8 pm, a condition that instills a feeling of insecurity among women.
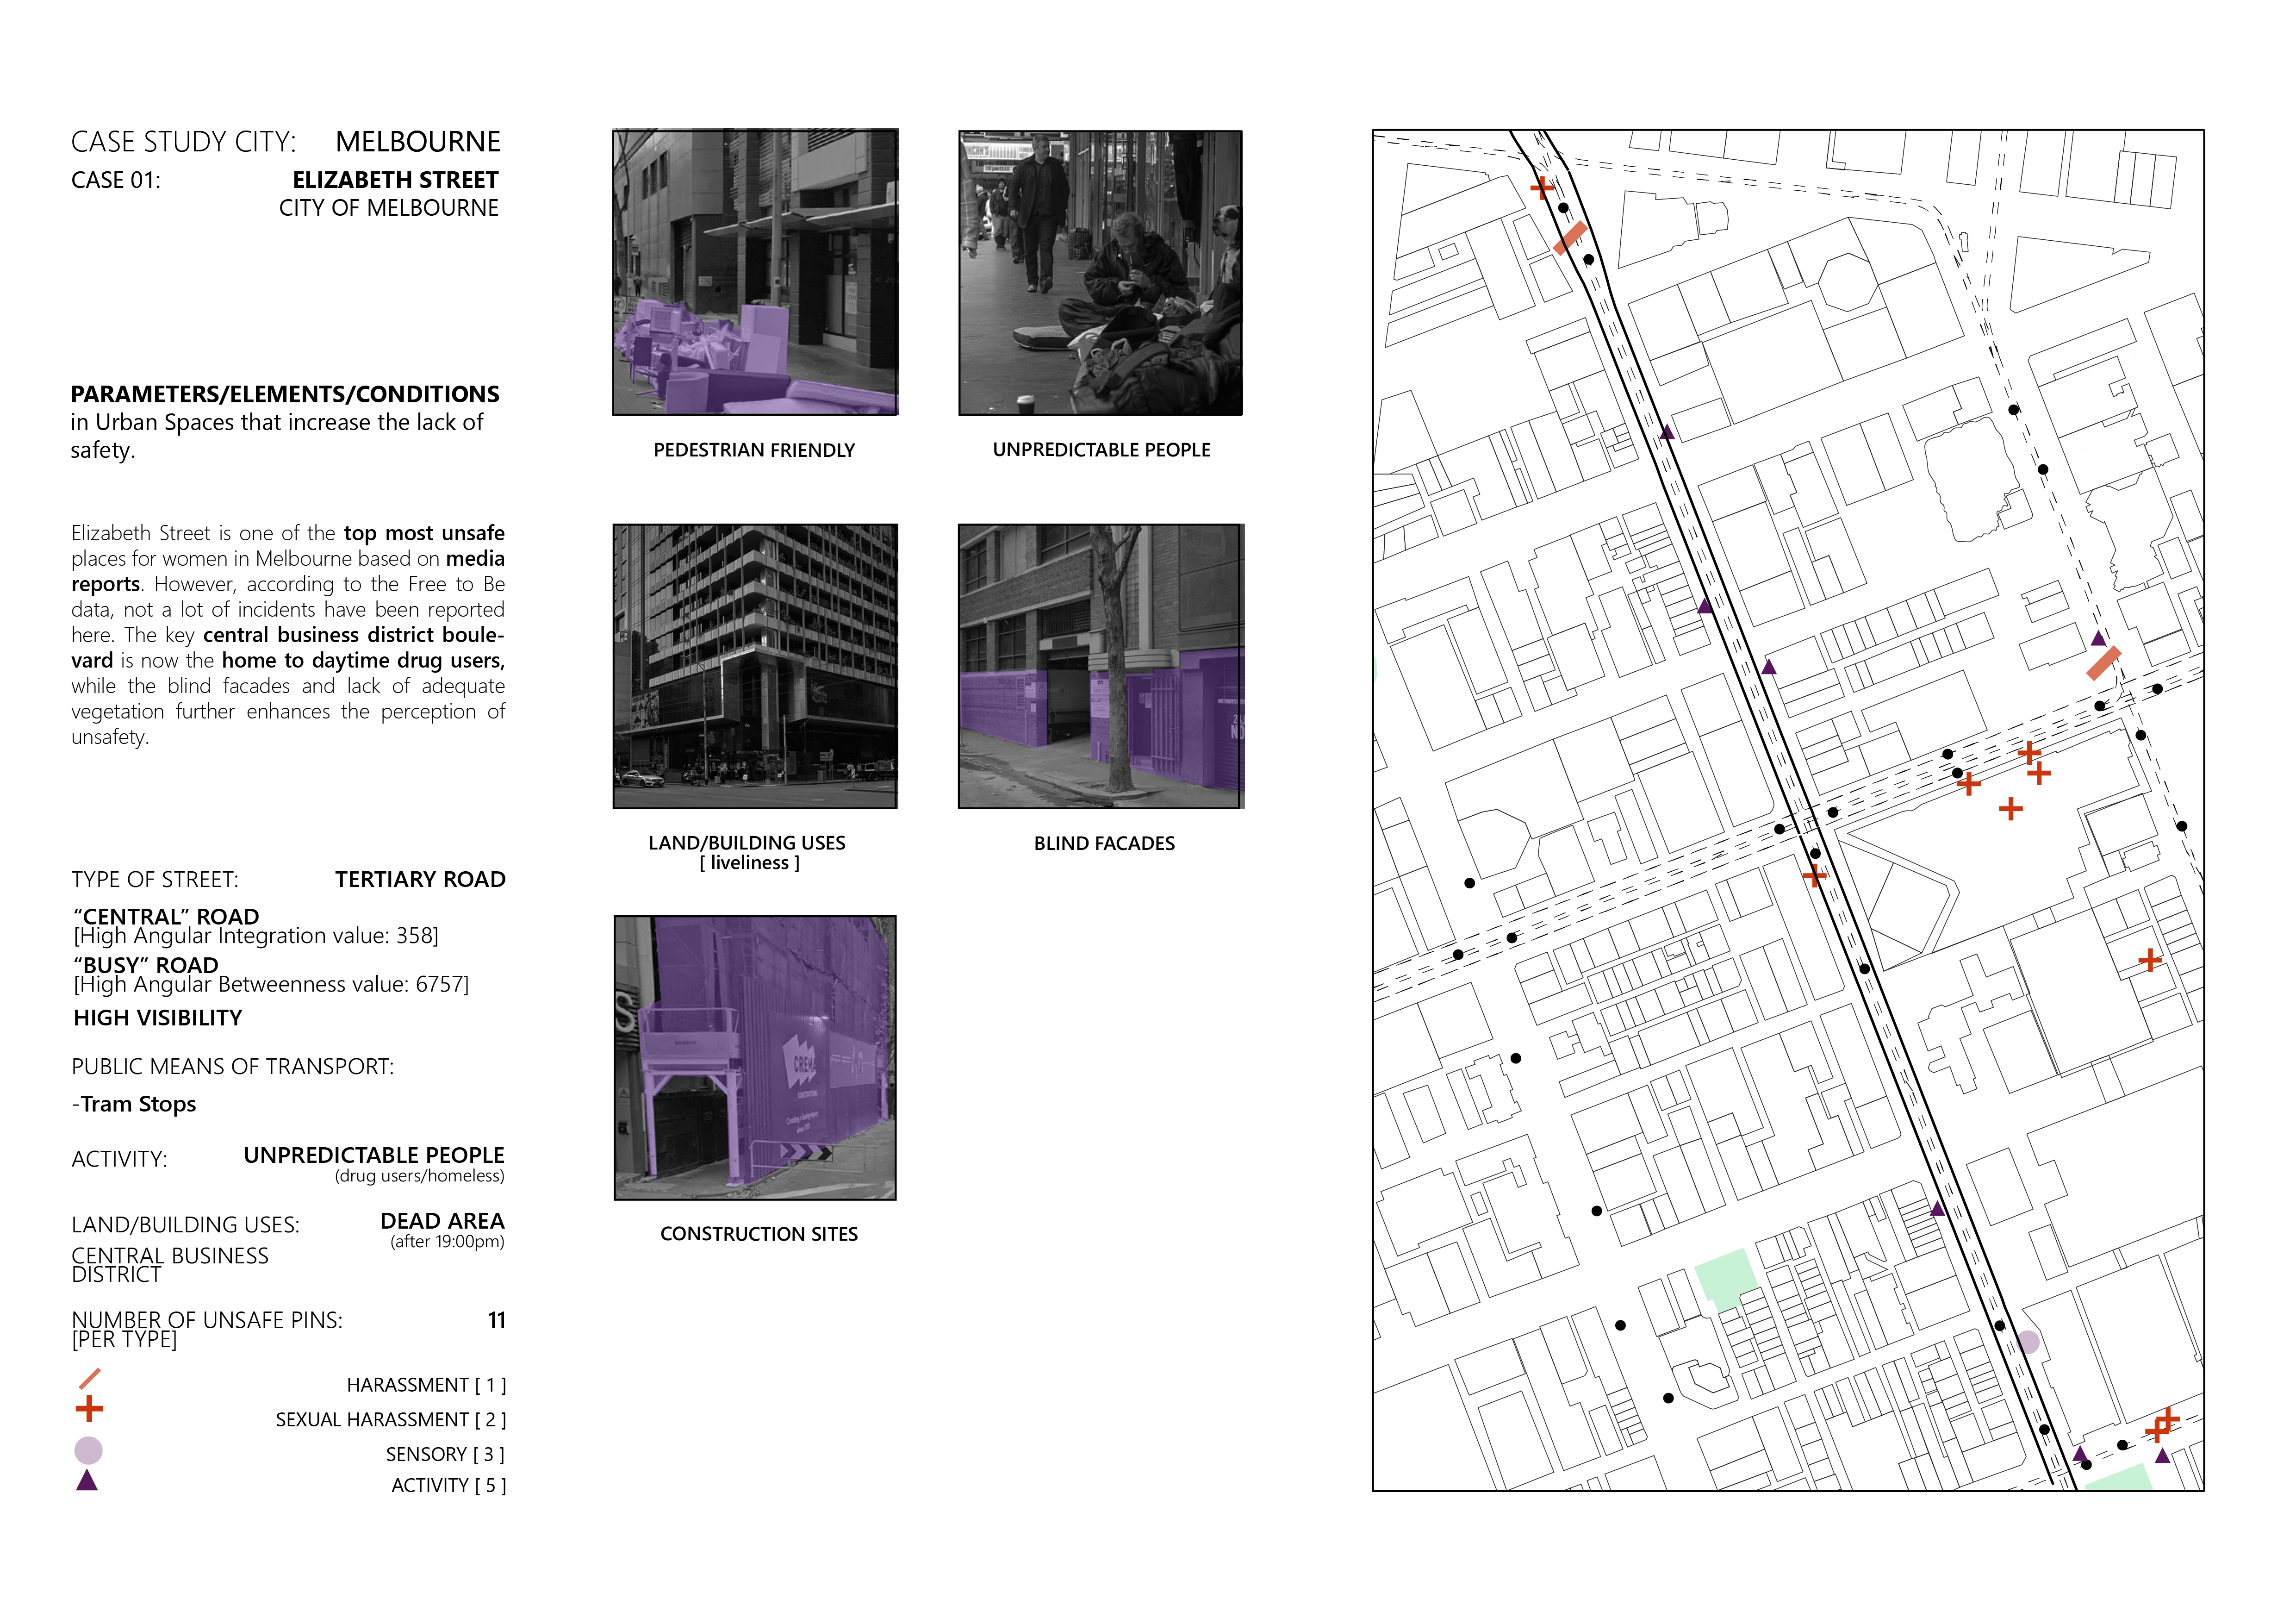
- CASE 02: Elizabeth Street, a prominent boulevard in Melbourne’s central business district, is regarded as one of the most unsafe locations in the city, despite the relatively low number of reported incidents according to the Free to Be data. This perception stems from the bustling activity and the presence of unpredictable individuals occupying public spaces, including a significant number of drug addicts and homeless people. Being within a business hub district, Elizabeth Street experiences a transformation after working hours, becoming a comparatively isolated area. This, combined with the lack of pedestrian-friendly infrastructure such as wide sidewalks and vegetation, as well as the presence of construction sites along it, further amplifies the perception of unsafety and contributes to the heightened vulnerability felt by women.
The Free to Be initiative highlights a number of opportunities that crowdmapping provides for those wishing to understand lived experiences. Considering the strengths and limitations of crowdsourced data, “Gendered Geographies” is a study of analyzing and comprehending the context (spatial layout) of those experiences.
The history of women’s exclusion and invisibility in cities is well charted, yet young women’s experience of sexual harassment and assault has been difficult to quantify. How we can ensure their voices are heard and their safety prioritized, ultimately designing inclusive and empowering cities?
