The idea of a ‘car-free’ city is not as easy as just banning cars but about reducing car reliance.
The private car has undeniably revolutionized mobility in the 21st century. It has offered convenience, job creation and an increased freedom of movement. While a world without cars might seem unimaginable, cities globally are strategically transitioning from car-centric transportation models. However, the path towards a ‘car-free’ city is not as straightforward as just banning cars. The key lies in strategically reducing our dependence on them.
For the purposes of this project, we set to envision how a city can start its journey towards a carless city. However, straight from the beginning we realized that this can be overwhelming and identified 4 main challenges that can stand in a city’s way when going carless:
- Infrastructure is already built around cars – in the last centuries cities have developed around the concept of more cars equals more development.
- Trying to repurpose what already exists – infrastructure built for cars is difficult and expensive to repurpose.
- Debunking public misconceptions around infrastructure – people are used to driving cars so it essential to think how they would live in a carless city.
- Where does the infrastructure go and with what materials – cities have their own visions and strategies for future development, so a carless city vision should be connected to the city vision.
It is clear that, on the medium and long term, cars cannot disappear for good from a city, but the city can however start a long journey towards a place where classic cars are replaced with environmentally friendly alternatives that can ensure optimal mobility of people and goods within the city boundaries.
A custom methodology to get the process started
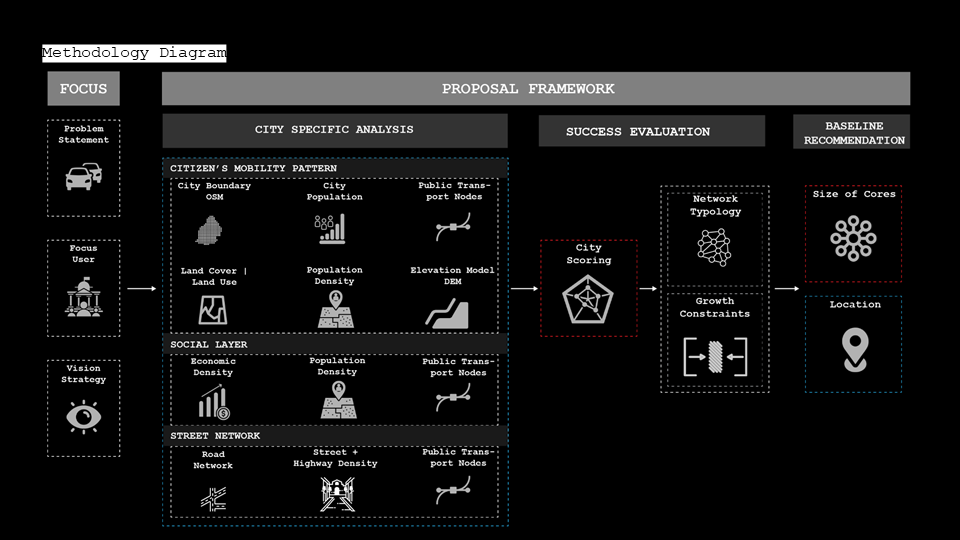
We decided to create a methodology that can be used by cities worldwide to initiate the journey towards a carless city. Our methodology has two distinct elements: a data collection element and a public survey element, ensuring that recommendations are tailored for each city. This methodology is designed to be used by local public administrations and to give them a point from where they can initiate the process. Because all the data is collected from open sources and processed locally, this methodology can be turned into an automated online tool.
1.- Data collection element:
A series of datasets are used to paint a clear image of the city, with elements that are of interest for transport planning. These data points include the following:
- City boundary (OSM)
- Elevation model (Copernicus DEM GLO-3)
- Land cover (ESA WorldCover)
- Land use (OSM)
- Road network (OSM)
- Population number (CITY POPULATION)
- Population density (GPWv411: Population Density)
- Economic density (non-residential built-up area)
- Weather (Land Surface Temperature | Humidity )
- Proximity to amenities,schools, services (OSM)
- Open spaces (NDVI)
- Street density and highway density / sqm (OSM)
2.- Public survey element
In order to customize possible recommendations to each city, a series of questions were designed to get more information about the city.
Scoring Questions:
- Are urban sprawl issues prevalent?
- Does the city have a robust PT infrastructure?
- Are there governmental incentives for sustainable transport?
- Is there significant private vehicle ownership?
- Does the city suffer from frequent natural disasters?
- How does the city’s topography influence its transportation network?
- How diverse is the land cover within urban areas?
- What is the distribution of open spaces within the city?
- What is the proximity of residential areas to essential services and amenities?
- What is the density of streets and highways per square meter within the city?
- How does population density correlate with transportation infrastructure?
Recommendations Based on Scores:
- Score 0-0.4: Major infrastructural and policy changes needed. Focus on developing robust public transportation, expanding non-motorized transport infrastructure, and implementing strict policies on car usage.
- Score 0.4-0.7: Moderate improvements required. Enhance existing public transport, increase accessibility to cycling and pedestrian paths, and encourage eco-friendly vehicle use.
- Score 0.7-1.0: Minor enhancements needed. Continue to promote sustainable transport policies, improve technology integration for traffic and transit management, and expand green spaces.
3.- Outcome
Generate a full city profile and base recommendations on the generated profile. Profile includes the following:
- Current State of Public Transport
- Origin-Destination Model
- Street Network Topology
- Access and Affordability needs for Public Transport Network
- Recommended Areas of Interventions
Case study test of methodology: Mexico City
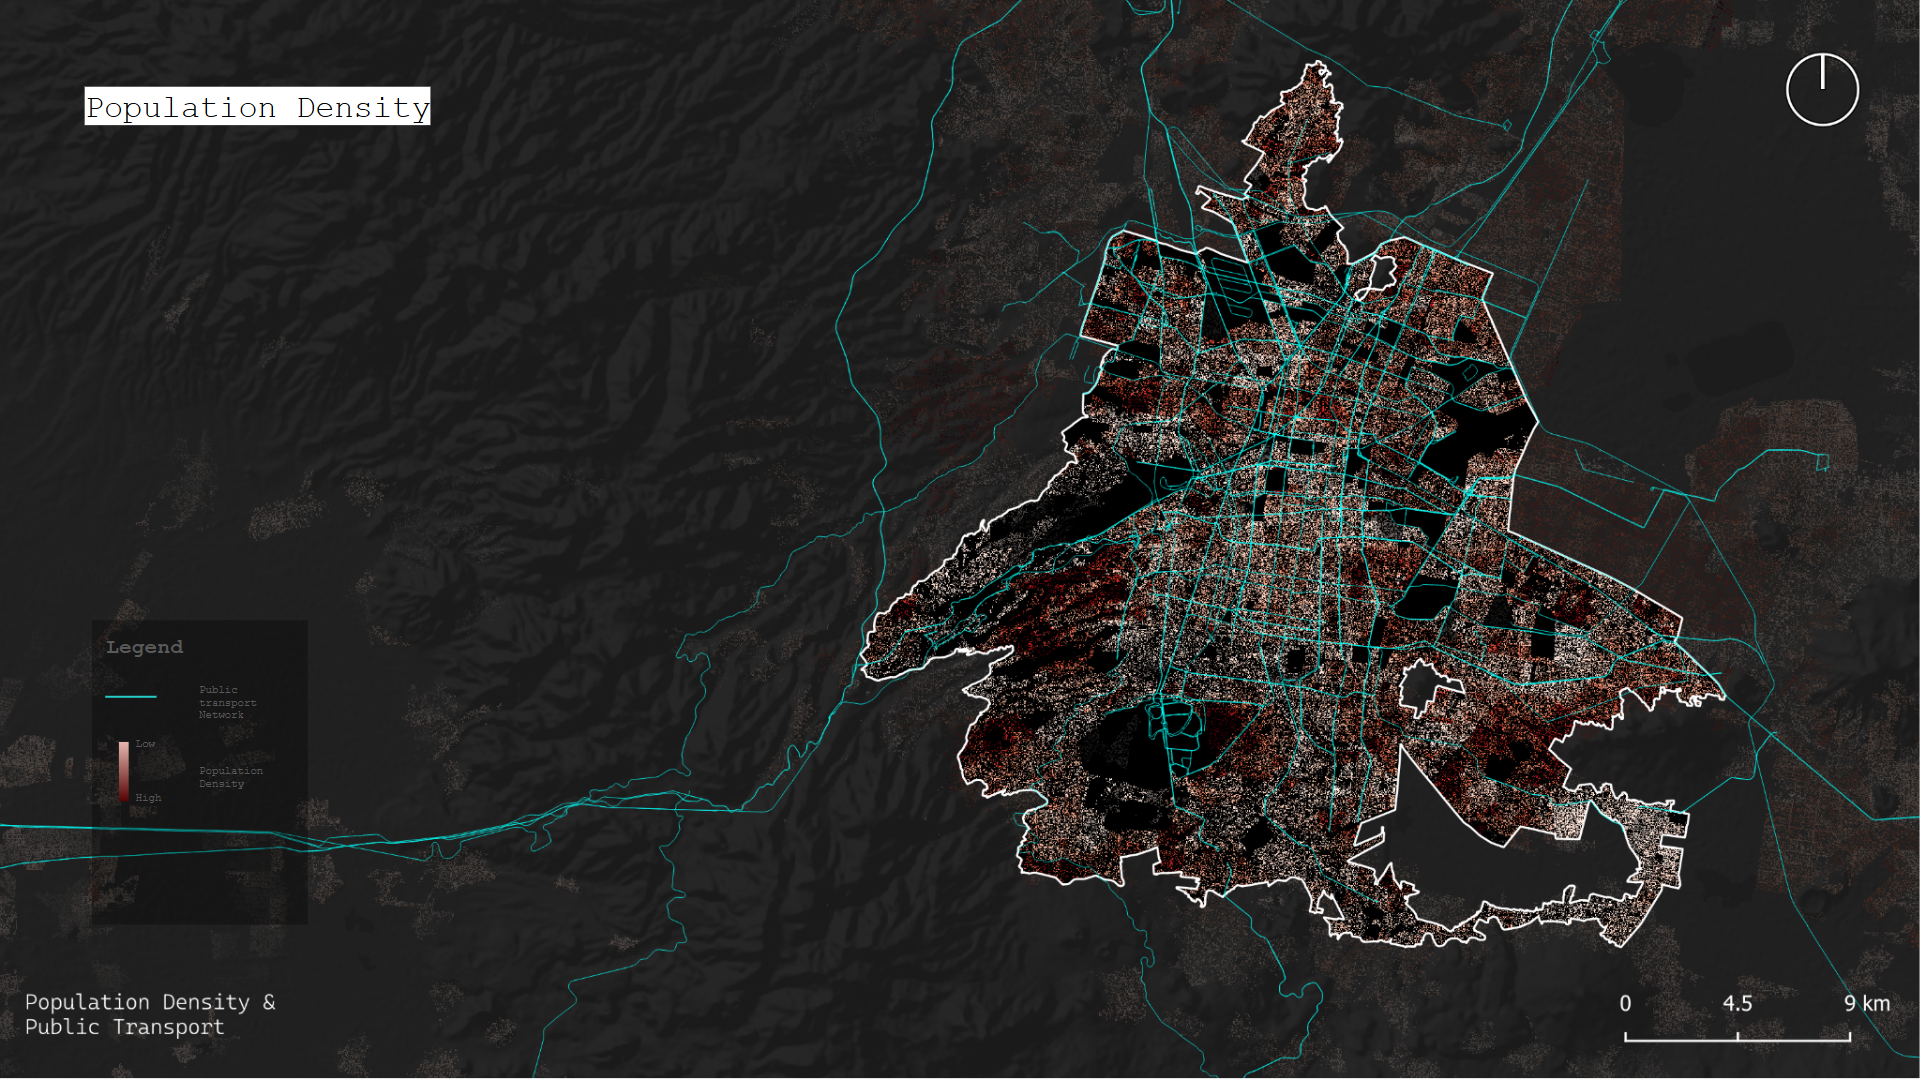
Current state of public transport: Population Density and Public Transport Network
This analysis offers a visual overview of how high population density increases demand for transport, requiring robust systems to prevent congestion and maintain efficient movement. Furthermore, this type of mapping can help in identifying areas of high density that need additional public transportation routes.
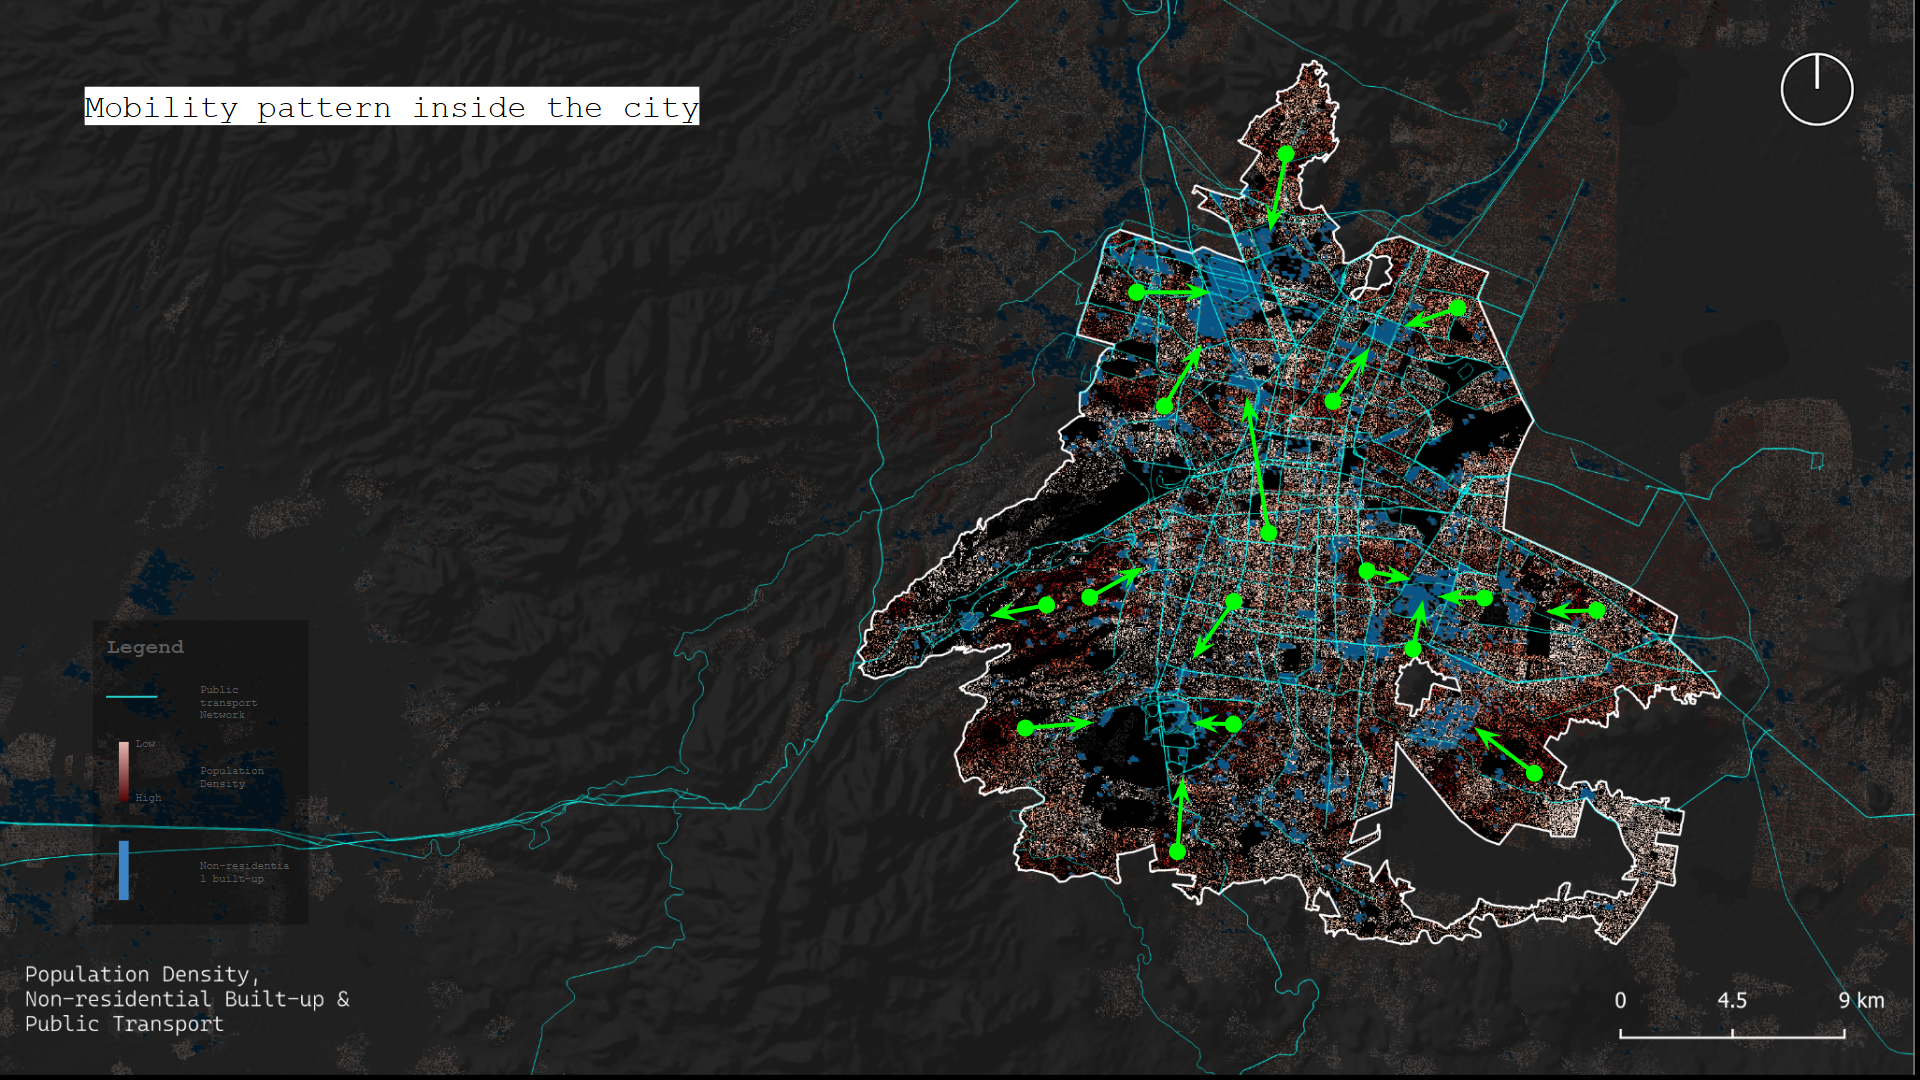
Origin Destination Patterns
To estimate possible origin-destination patterns two distinct methods were utilized.
Origin-Destination outside the city boundary: residential built-up area from 1975 to 2030 was used to determine the city expansion pattern. In a simplified way, this method can be used to show where people moved to live over time, and from there, it can be estimated that they would have to travel from those regions to the non-residential areas in the city. Also, this method allowed us to estimate possible movement patterns between different cities and can further be utilized to calculate possible locations for Park&Ride locations or Central Logistics Locations.
Origin-Destination inside the city boundary: non-residential built-up area and population density were utilized to estimate the movement patterns within the city boundaries following the logic that people might move from areas of high population density to areas of high non-residential built-up.
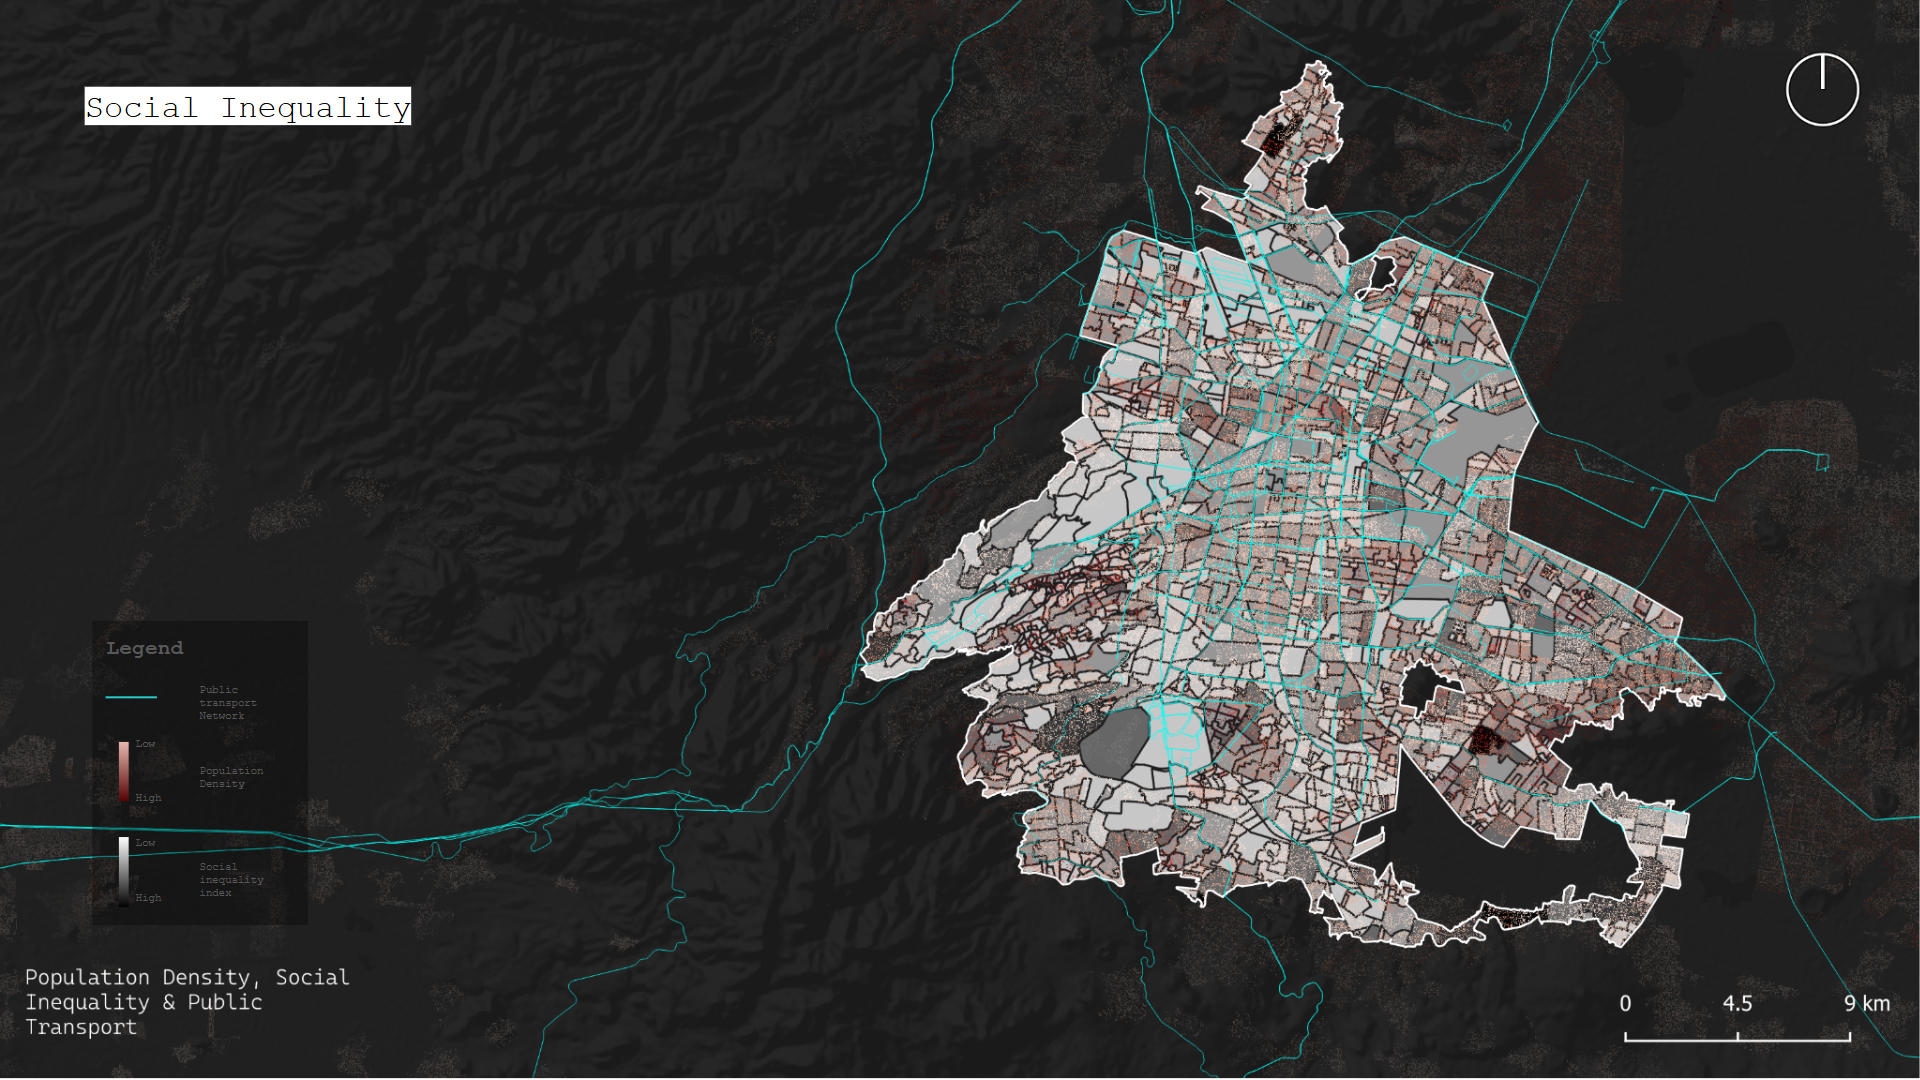
Access and affordability to public transport
Inequality can lead to uneven access to transport options, with lower-income areas often less served, affecting residents’ ability to access opportunities and services. This type of mapping should be utilized by cities to adjust public transport options and pricing based on inequality, in order to increase use of public transport.
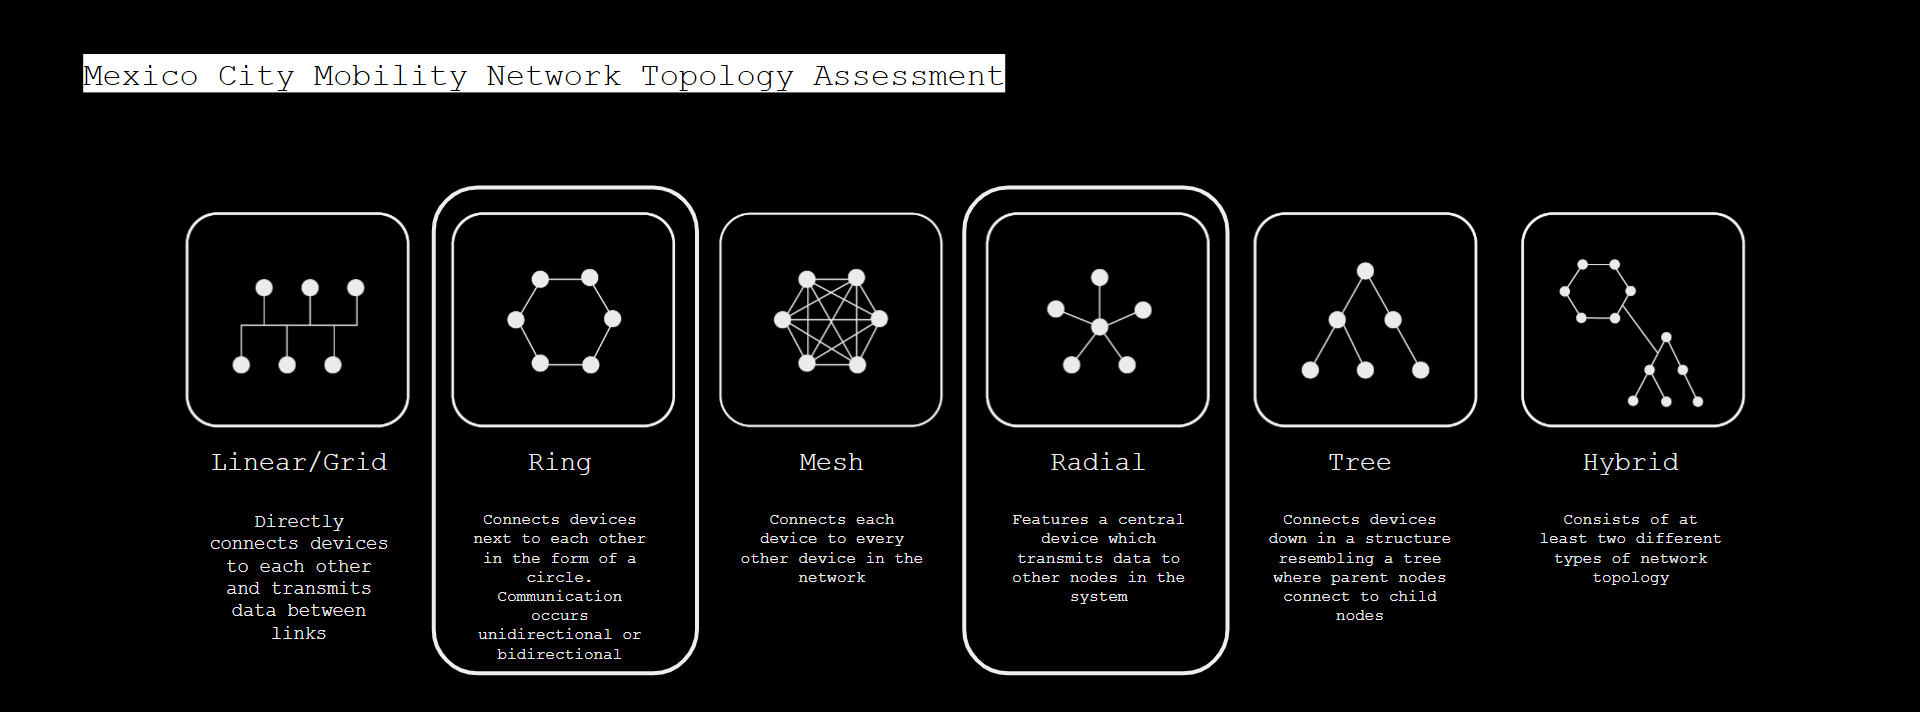
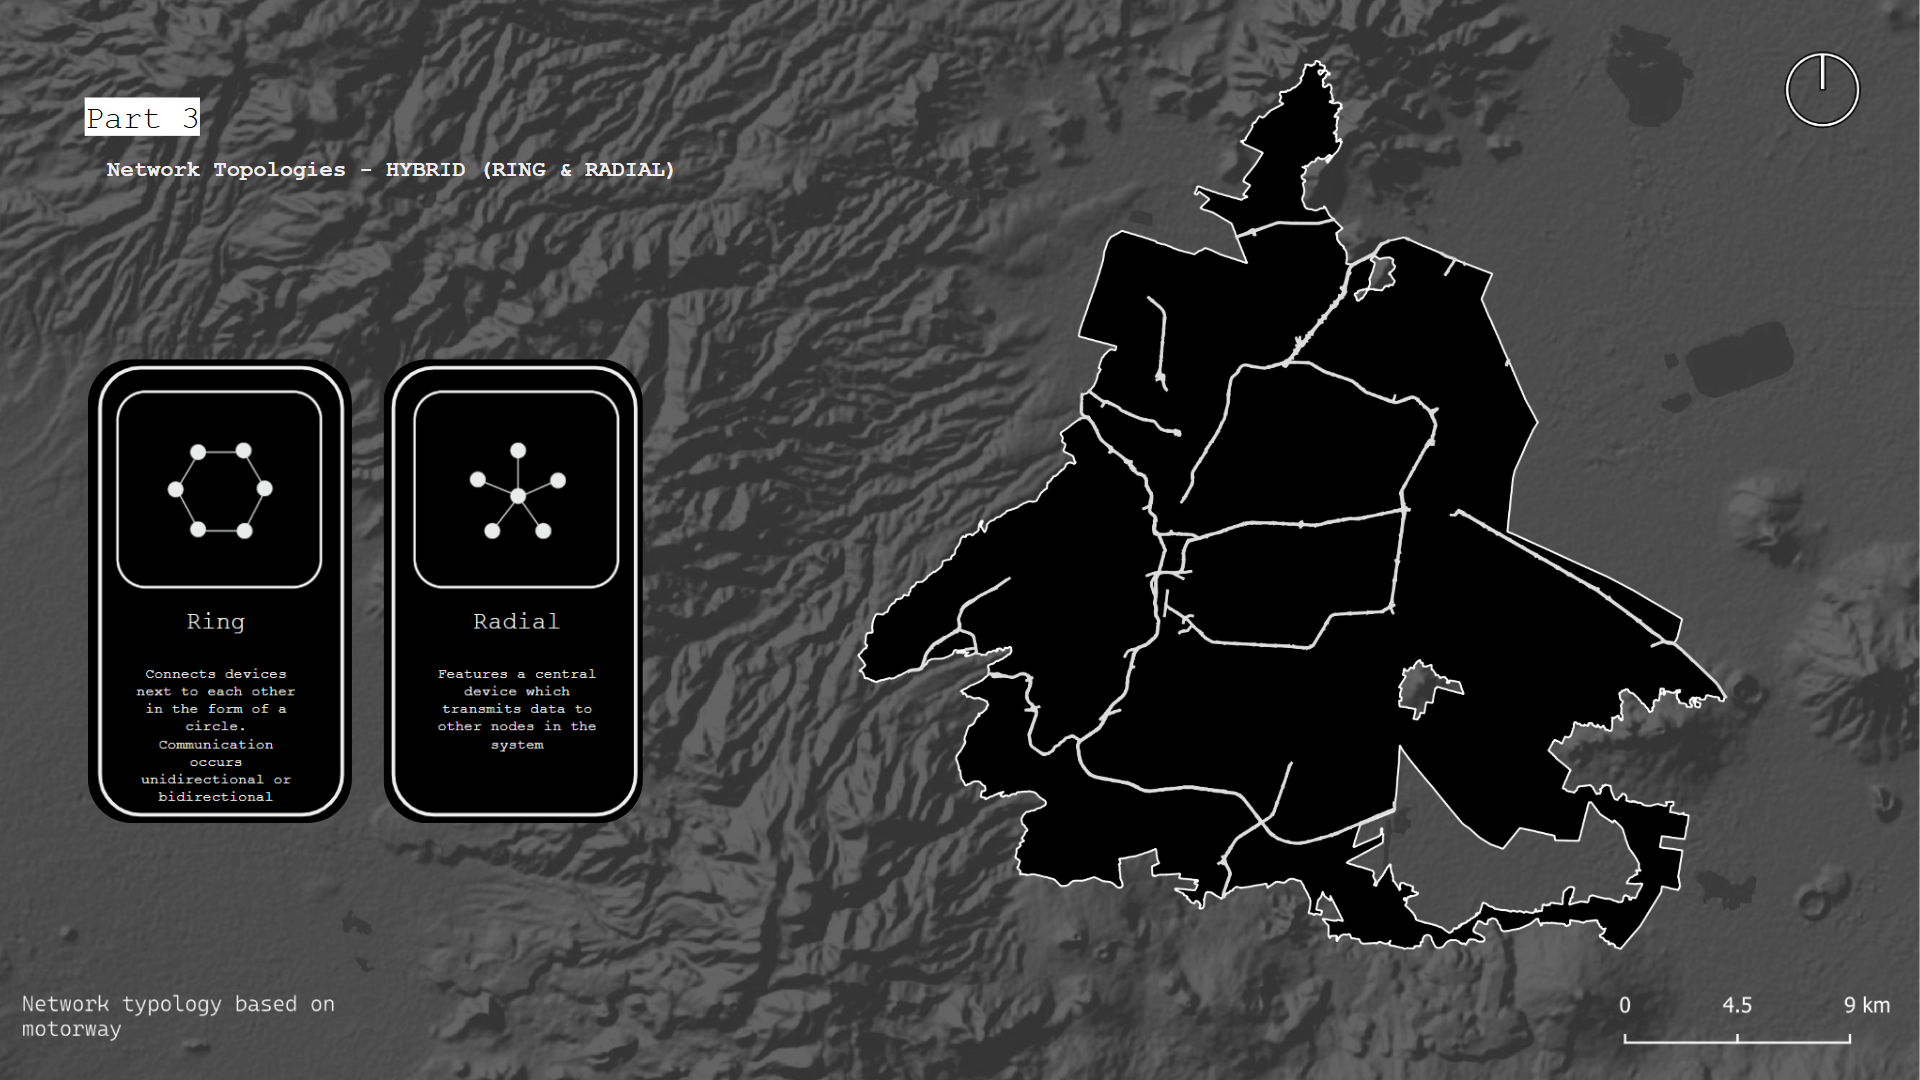
Street Network Topology
Our assessment on the street network typology is based on the motorway and/or primary street networks. Mapping these types of streets allows for a better visualization of the core of the network. This is important as we argue that even in a carless city, the main network (motorway) and primary streets should remain open to cars so as not to hinder movement of goods, economic growth and isolate the city from other cities.
Possible locations for mobility cores: Space Syntax
Determining the best locations for mobility cores based on existing street networks and city conditions is a vital element of our set of recommendations. To achieve this, a network betweenness analysis as well as a network choice analysis was conducted for 1200, 800 and 400 m. After that, streets with high betweenness and high choice (HBHC) were identified as possible locations for different types of mobility cores.
- The size of the cores and the amenities included will vary based on the results of the scores.
- Cores will be strategically distributed according to the detailed analysis of under-served areas (weak zones)
- They will be connected by the identified network topology to ensure optimal coverage and functionality throughout the city
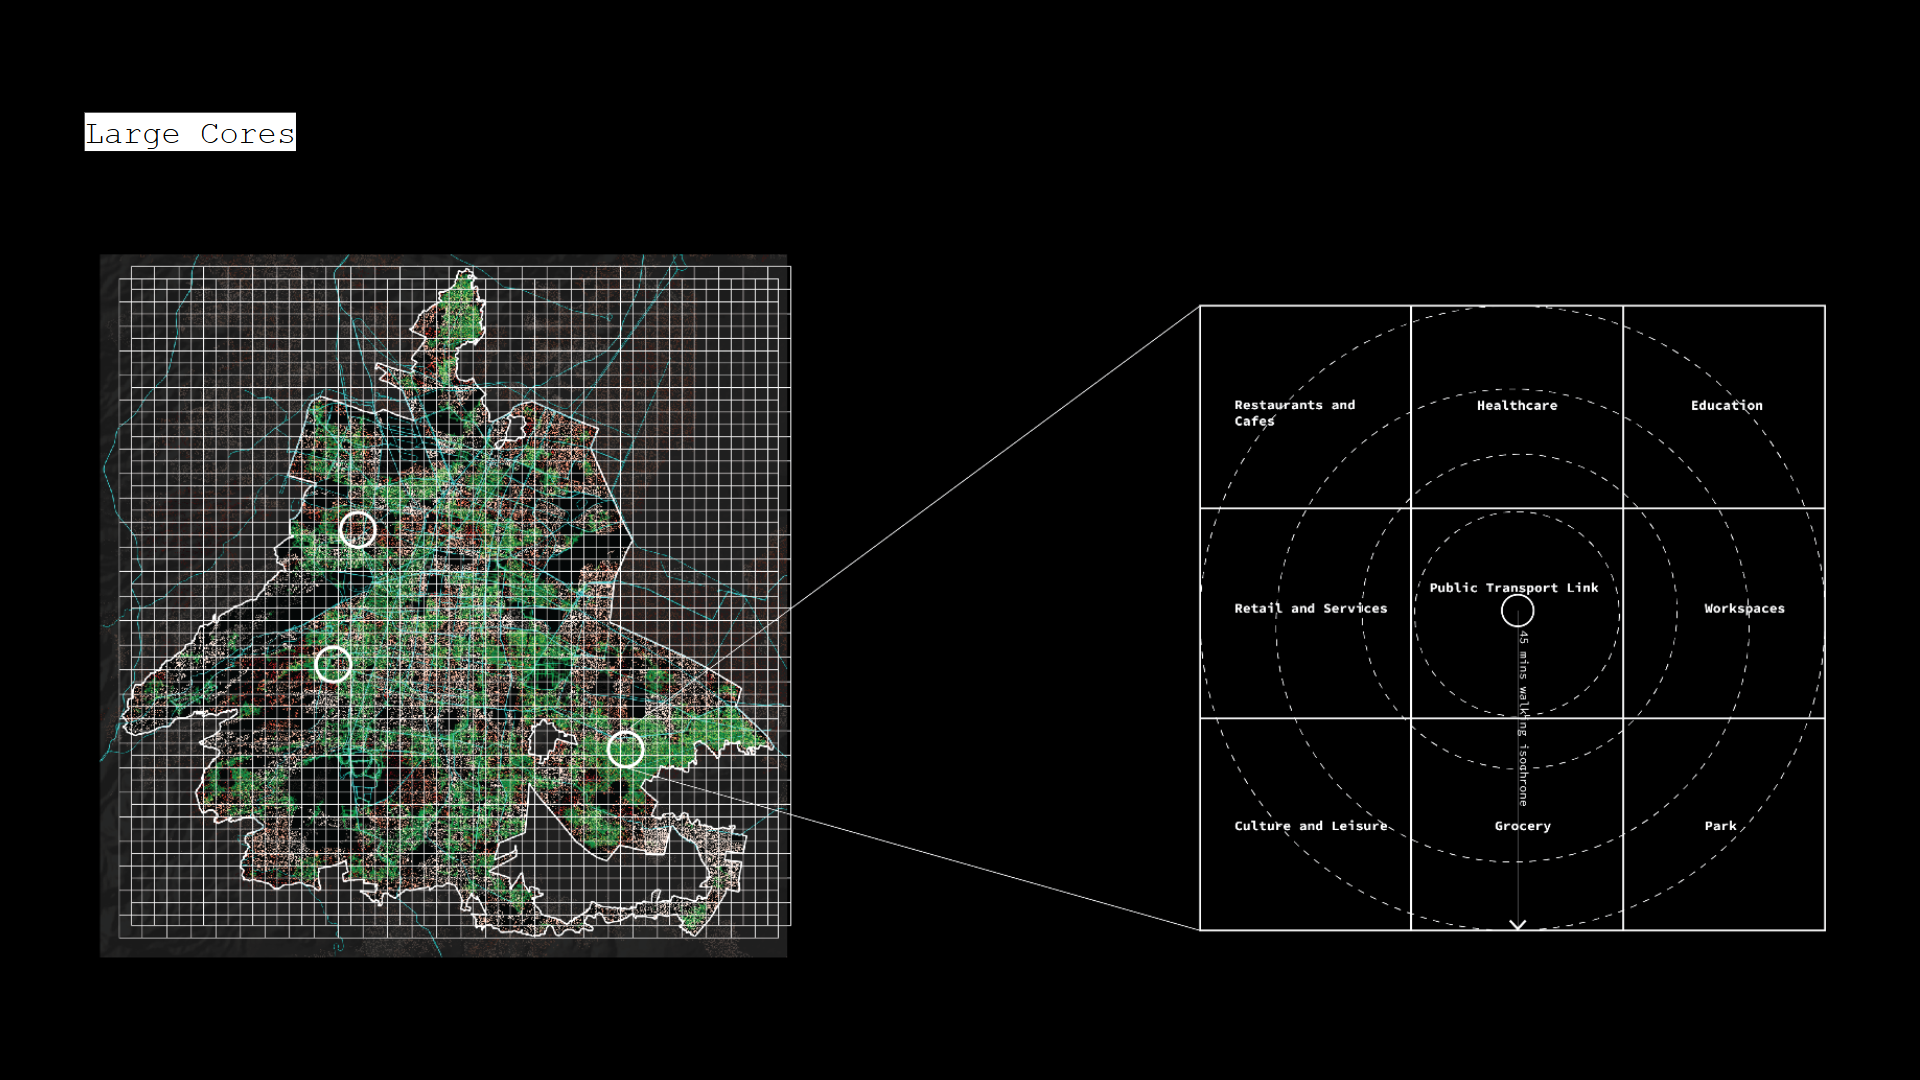
Mobility Cores: out proposed solution
In our opinions, mobility cores are central elements in a carless city, elements that contribute to ensure a careless mobility within the city but also ensure economic prosperity. The location and number of these cores can be determined by analyzing the HBHC, public transport infrastructure and population density.
Large Mobility Cores Functions – placed at locations with HBHC 1200 m, large public transport infrastructure, and large population density.
- Intermodal hubs with large public transport infrastructure
- Restaurants and cafes
- Healthcare
- Eduction
- Retail and services
- Work spaces
- Culture and leisure
- Park
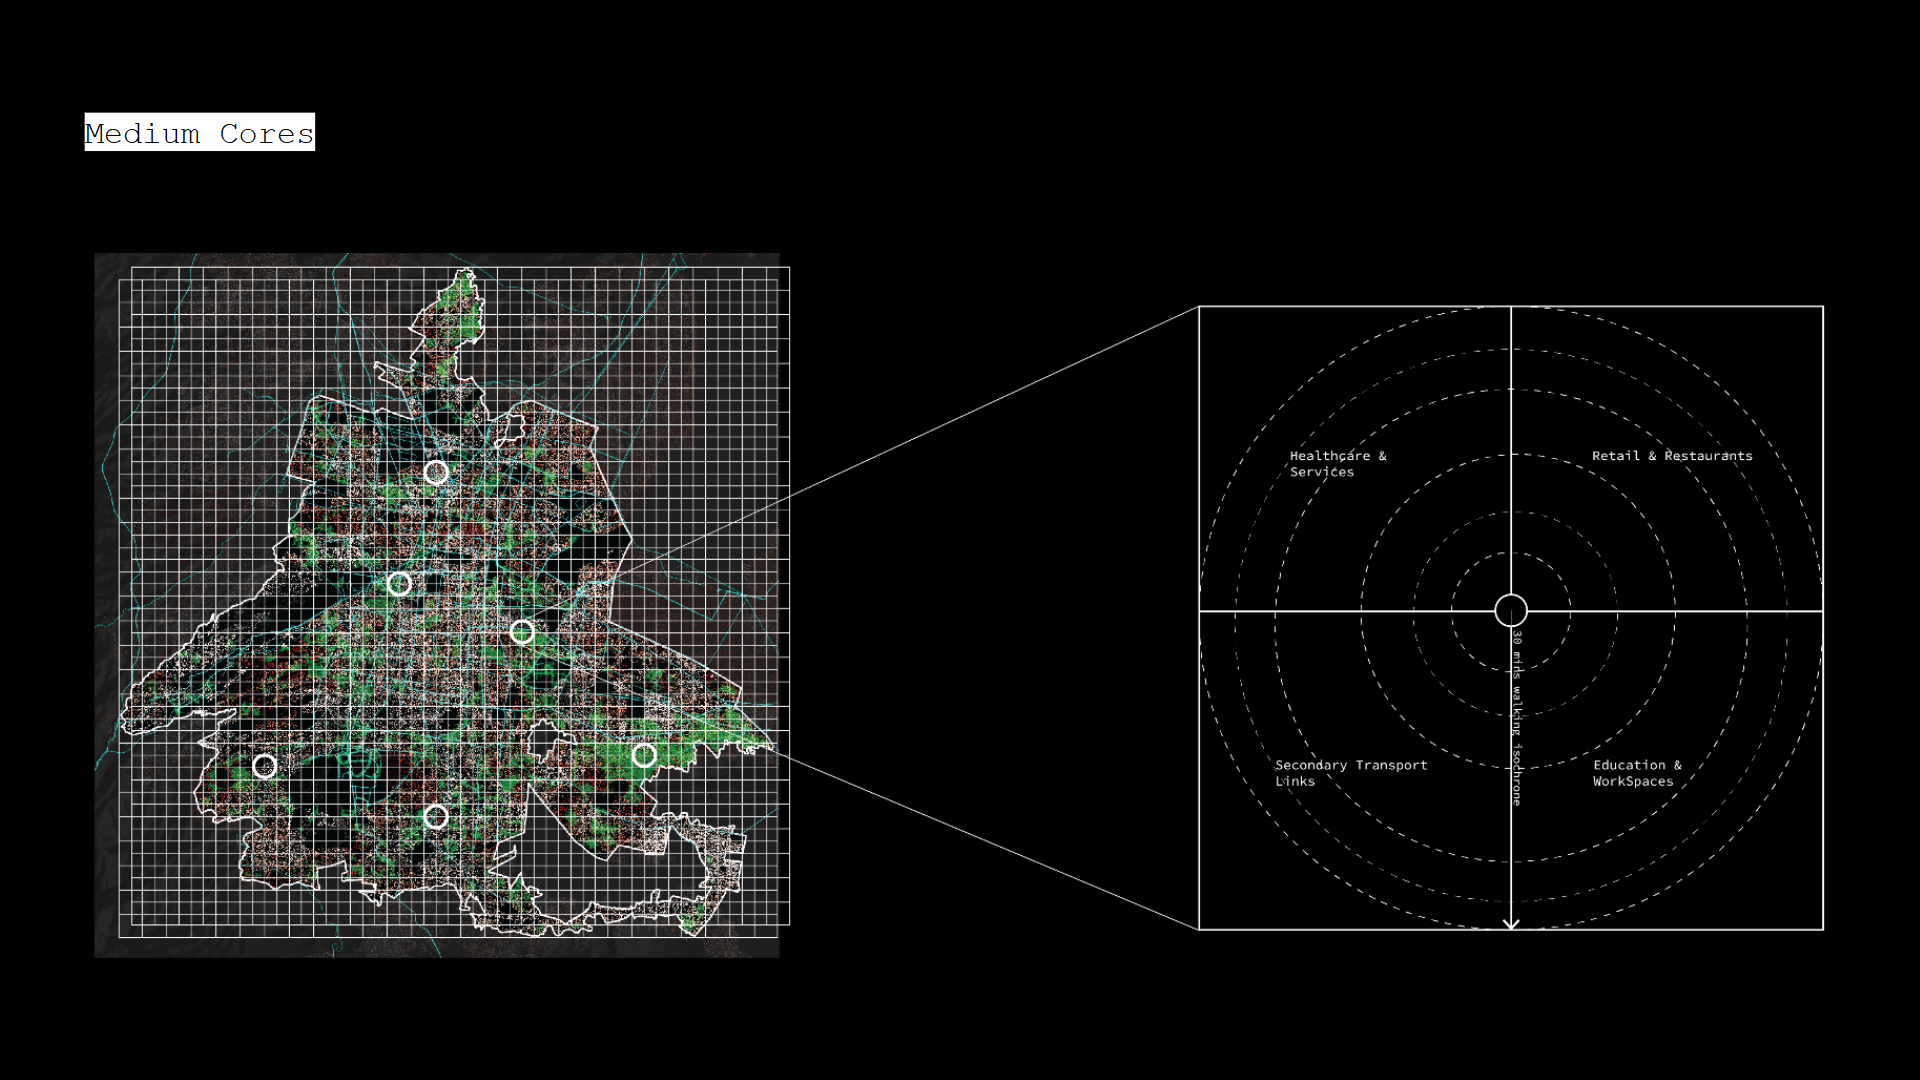
Medium Mobility Core Functions – placed at locations with HBHC 800 m, medium public transport infrastructure, and medium population density.
- Secondary transport link
- Healthcare and services
- Retail and restaurants
- Education and workspaces
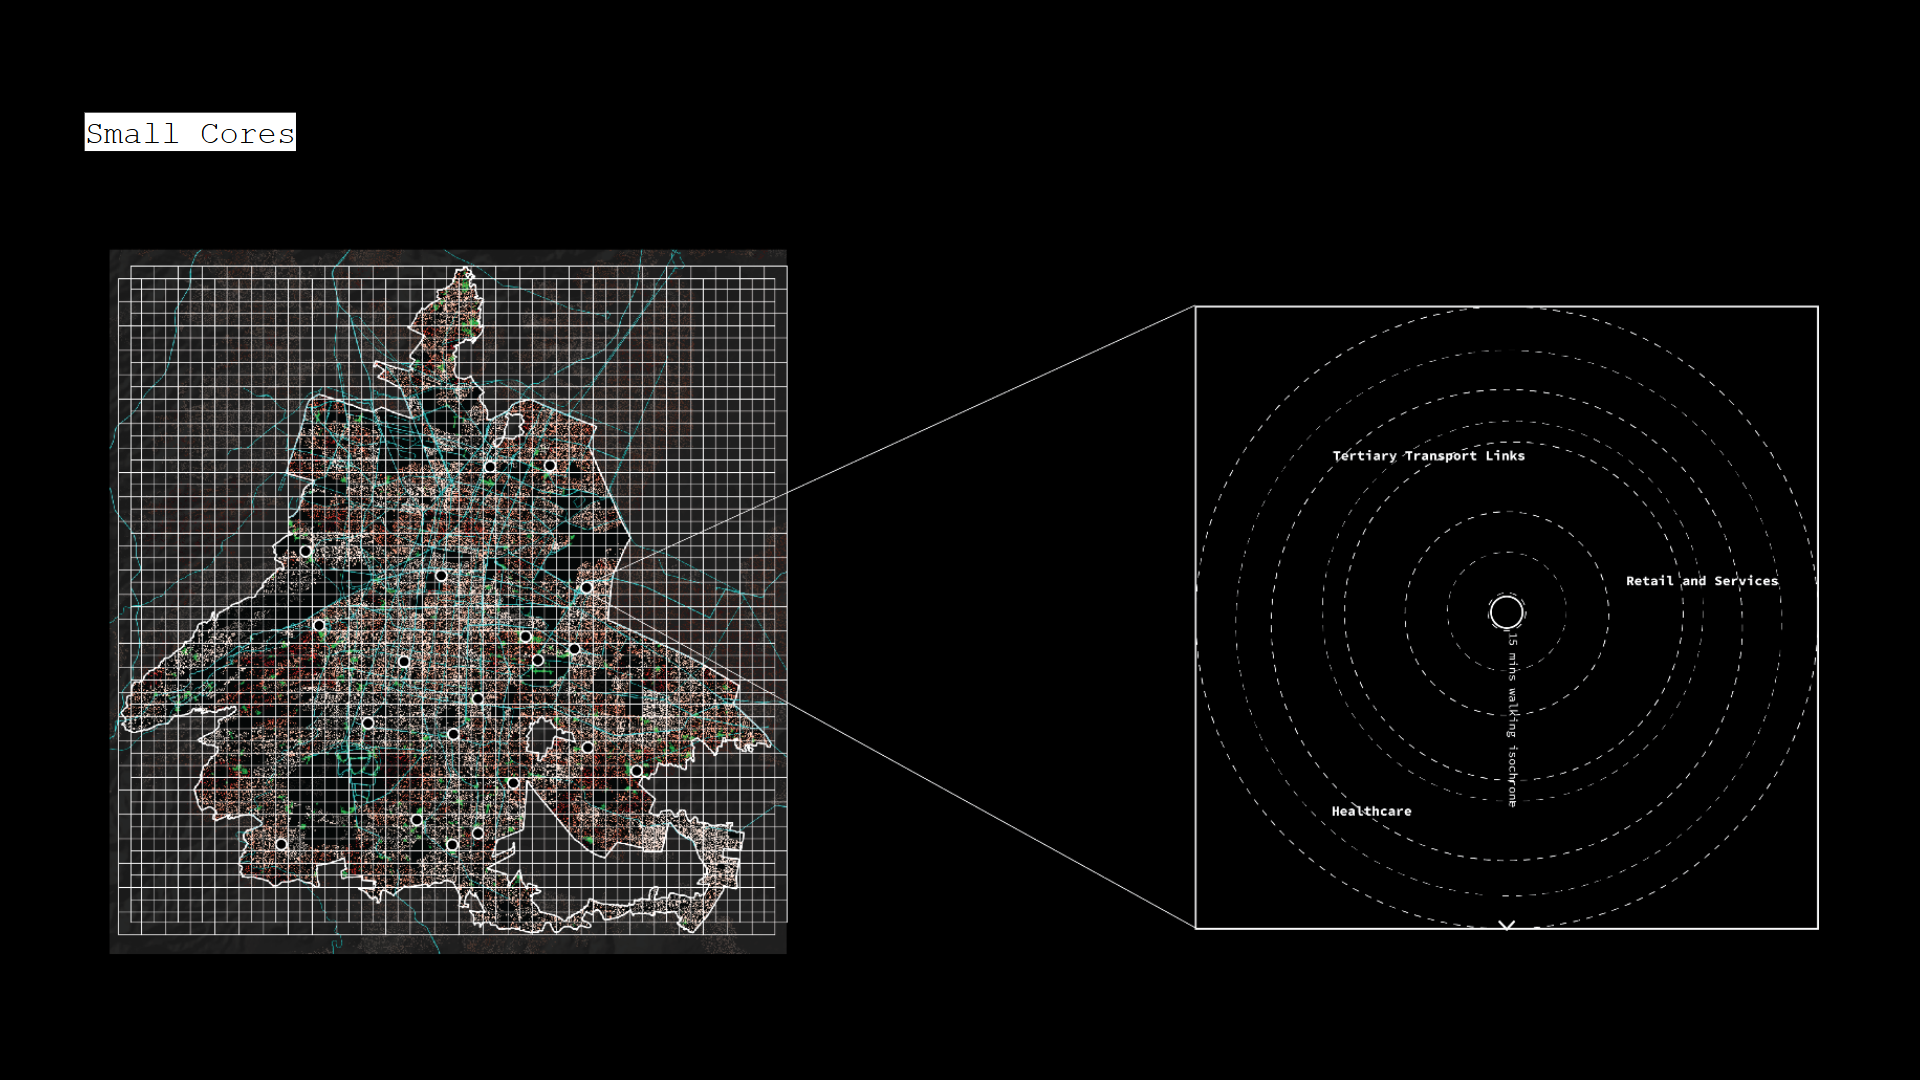
Small Mobility Core Functions – placed at locations with HBHC 400 m, small public transport infrastructure, and small population density.
- Tertiary transport link
- Healthcare
- Retail and services