
“The Amazon rainforest, often called the ‘lungs of the Earth,’ is rapidly disappearing. But this isn’t just an environmental crisis—it’s a geopolitical and economic issue. In the heart of this transformation lies [Mato Grosso], Brazil’s largest soy-producing state. Its key location fuels both economic growth and ecological destruction, leading to tensions over land use, trade policies, and environmental governance.”
DATASET 01 – MOD13Q1.061 Terra Vegetation Indices 16-Day Global 250m
There are two primary vegetation layers. The first is the Normalized Difference Vegetation Index (NDVI) which is referred to as the continuity index to the existing National Oceanic and Atmospheric Administration-Advanced Very High Resolution Radiometer (NOAA-AVHRR) derived NDVI.
Understanding its vegetation health, changes, and threats is crucial for conservation and sustainable management. One of the most effective tools for monitoring vegetation is the Normalized Difference Vegetation Index (NDVI), a remote sensing technique that provides insights into plant health and biomass distribution. By integrating NDVI analysis with conservation efforts, we can better understand and protect the Amazon, ensuring that this critical biome remains resilient against human and environmental pressures.

DATASET 02 – Global map of forest types 2020
The global map of forest types provides a spatially explicit representation of primary forest, naturally regenerating forest and planted forest (including plantation forest) for the year 2020 at 10m spatial resolution.
Distinguishing primary forests, naturally regenerating forests, and planted forests. In the Amazon, this dataset enhances NDVI analysis by offering spatially explicit insights into forest composition and changes. By combining NDVI with this dataset, researchers can better understand deforestation patterns, forest recovery, and human-induced disturbances in the region.

DATASET 03 – EC JRC global map of forest cover 2020, V2
The year 2020 corresponds to the cut-off date of the Regulation from the European Union “on the making available on the Union market and the export from the Union of certain commodities and products associated with deforestation and forest degradation” (EUDR, Regulation (EU) 2023/1115).
This dataset aligns with the EU Deforestation Regulation (EUDR), offering critical insights into deforestation and forest degradation linked to commodity-driven land-use changes. In the Amazon, integrating this dataset with NDVI allows researchers to track large-scale deforestation, assess compliance with environmental policies, and support conservation strategies against illegal land clearing.

Tracking Forest-to-Farm Transformation (1980–2024) – Using Google Landsat and TouchDesigner

Tracking landscape mutation from forest to farming (1980–2024) involves processing Google Landsat satellite imagery and using TouchDesigner’s Blob Tracker for spatial change detection. Historical Landsat images are pre-processed with contrast adjustments and thresholding to enhance land cover differences. In TouchDesigner, Blob Tracker analyzes pixel clusters, detecting shifts in land use by tracking movement and expansion of non-forest areas over time. The processed data is mapped into an interactive visualization, allowing dynamic exploration of deforestation and agricultural expansion trends. This approach provides a real-time method for monitoring large-scale landscape transformations.
THE MECHANISMS OF DEFORESTATION & POLITICAL TENSIONS
“Mato Grosso is at the heart of Brazil’s agribusiness boom. Covering nearly 900,000 square kilometers, it was once a dense forest and savanna ecosystem. Today, it produces over 30% of Brazil’s soy exports. But this transformation comes at a cost 80% of deforestation in the state is linked to soy farming.”
“Mato Grosso’s economy is heavily dependent on this trade, but it also faces growing resistance from environmental groups, indigenous communities, and even segments of the Brazilian government. This has led to internal disputes over land use policies and foreign influence, with the state’s agribusiness sector pushing for deregulation while conservationists demand stronger protections.”

RESEARCH QUESTION
How can satellite imagery and machine learning reveal the material and extractive processes driving deforestation in the Amazon, particularly in the context of soy farming in [Mato Grosso]?
“Our investigation explores the spatial dynamics of deforestation, the role of soy expansion, and the infrastructural networks facilitating this transformation. Using remote sensing, machine learning, and geospatial analysis, we examine the hidden mechanisms behind this crisis.”
“Mato Grosso is at the heart of Brazil’s agribusiness boom. Covering nearly 900,000 square kilometers, it was once a dense forest and savanna ecosystem. Today, it produces over 30% of Brazil’s soy exports. But this transformation comes at a cost—80% of deforestation in the state is linked to soy farming.”


Overlaying Satellite Data to Assess Land Quality in Forest-to-Farm Transitions
Deforestation continues despite efforts like the Soy Moratorium, and illegal land grabs persist, exacerbating conflicts over land ownership and indigenous territories. Through the use of satellite imagery and geospatial analysis, this project maps the complex interplay of agriculture, politics, and environmental change. By overlaying key datasets, we reveal the landscape’s transformation, highlighting areas of deforestation, soy expansion, and socio-political tension. This research aims to provide a clearer understanding of the stakes involved in Brazil’s agricultural policies and their global implications, calling attention to the urgent need for sustainable practices that balance economic growth with environmental conservation.


Analyzing Soy Farming and Deforestation in Mato Grosso: A Machine Learning Approach to Land Use and Landscape Change.
For this project, we are focusing on three key locations in Mato Grosso—Sorriso, Sapezal, and Campo Novo do Parecis—which are known for their high concentrations of soy farming. By analyzing satellite imagery and geospatial datasets, we will extract landscape tiles from these areas to study the dynamics of land use and deforestation. These locations, which are critical to the soy industry’s expansion, will serve as the basis for training a dataset for object detection. Using the YOLO X model integrated with Roboflow, we aim to detect and classify land cover changes, identify the extent of soy cultivation, and investigate the environmental impact of these agricultural practices. This workflow will allow us to investigate the patterns of land conversion in Mato Grosso, shedding light on the pressing issues related to deforestation, land rights, and agricultural expansion in the region.

“To systematically investigate the relationship between soy farming, deforestation, and geopolitical tensions, we employ a multi-layered approach using remote sensing, machine learning, and statistical modeling. Our workflow consists of four key stages: data collection, preprocessing, analytical modeling, and visualization.”
Mato Grosso’s economy is heavily dependent on this trade, but it also faces growing resistance from environmental groups, indigenous communities, and even segments of the Brazilian government. This has led to internal disputes over land use policies and foreign influence, with the state’s agribusiness sector pushing for deregulation while conservationists demand stronger protections.
The municipalities of Sapezal, Sorriso, and Campo Novo do Parecis in Mato Grosso, Brazil, are as follows:
- Sapezal: Approximately 31,499 inhabitants.
- Sorriso: Approximately 120,985 inhabitants.
- Campo Novo do Parecis: Approximately 50,033 inhabitants.
The project will focus on identifying key silos within the soy farming landscape to investigate the expansion and impact of agriculture. The primary silos to be analyzed are Silos, Silo-bags, and Trucks, which represent significant infrastructure components in soy production. The Silos silo will focus on large-scale storage facilities used to hold harvested soybeans, often indicating areas of intensive cultivation. The Silo-bags silo will examine temporary storage methods used in fields, often in regions with high levels of soy farming, providing insights into smaller-scale production and seasonal storage practices. Lastly, the Trucks silo will focus on transportation networks, analyzing the flow of soybeans from farms to processing plants and export points, which can highlight the economic and logistical dynamics of the soy industry. By investigating these three silos, the project aims to better understand the landscape’s transformation and the logistical operations driving deforestation and land-use changes in Mato Grosso.


This project will involve analyzing the landscape along the BR-163 highway, the main route connecting Sorriso, Mato Grosso, to the Amazon Rainforest, by extracting satellite tiles that capture key features of soy farming infrastructure. The tiles will be taken along the entire stretch of the highway, focusing on areas where intensive soy cultivation is occurring. The Silos, Silo-bags, and Trucks—key infrastructure components of the soy industry—will be identified within these tiles to understand the spatial relationship between transportation, storage, and agricultural expansion. By examining the tiles, the project aims to investigate how the growth of soy farming along the BR-163 highway is influencing land use and deforestation, particularly as it pushes towards the sensitive ecosystems of the Amazon. This analysis will provide insights into how infrastructure development, agricultural practices, and environmental degradation are interlinked along the path to the rainforest.


Deepness in QGIS
Once annotated, the dataset is exported to ONNX format, which is compatible with deep learning models. The ONNX model is then loaded into QGIS using the QGIS Deep Learning Plugin, which allows deep learning workflows directly within the software. Using ONNX Runtime in QGIS, the model is applied to Google Satellite Landsat images, where it detects and traces the annotated features. The deep learning model processes the imagery and overlays bounding boxes around the features, identifying the locations of Silos, Silo-bags, and Trucks. These detected features are then visualized on the map, providing insights into the distribution of soy farming infrastructure along the BR-163 highway. This workflow offers a streamlined way to apply machine learning for spatial analysis directly within QGIS.

ONNX Models in QGIS for Deep Learning-Based Detection of Soy Farming Infrastructure


The successful images highlight the deep learning model’s ability to accurately detect and trace Silos along the BR-163 highway in Mato Grosso. The bounding boxes clearly identify the locations of these storage facilities, showcasing the model’s effectiveness in mapping key agricultural infrastructure. This visualization provides valuable insights into the distribution of soy farming and its potential impact on land use and deforestation in the region.
New Workflow to Filter Out False Positives and Enhance Analysis
The updated workflow aims to improve silo detection and analysis by filtering out false positives and refining the identification process. By adjusting detection thresholds and implementing post-processing steps to classify features based on size, shape, and context, non-silo objects can be effectively excluded. For detecting traditional Silo-bags, the optimal zoom levels in QGIS will be explored to capture these smaller structures. Additionally, size filters will be applied to ensure only objects fitting the typical dimensions of silos are retained. Once the one-year analysis is perfected, multitemporal analysis will track changes in soy farming infrastructure, enabling the detection of trends over time. Finally, a new layer mapping export markets will be added to contextualize silo locations within the broader agricultural supply chain, providing insights into how export routes influence infrastructure development and their relationship with deforestation. This workflow enhances the accuracy and depth of the analysis, offering a comprehensive view of soy farming dynamics.
- Filter Out False Positives:
- Adjust detection threshold to reduce false positives.
- Classify detected features based on size, shape, and context.
- Use spatial analysis to verify proximity to typical agricultural features.
- Explore Traditional Bag Silos:
- Identify appropriate zoom levels in QGIS for detecting Silo-bags.
- Adjust the model to detect smaller structures with varying scales.
- Filter and Identify Silo Sizes:
- Apply size filtering to retain only objects with silo-like dimensions.
- Use spatial analysis tools to verify detected silos’ size and shape.
- Add Multitemporal Analysis:
- Integrate multi-year satellite imagery for temporal change detection.
- Track changes in silo infrastructure and its relation to deforestation.
- Add Export Market Layer:
- Map export routes and destinations for soy.
- Integrate export market data with silo locations for supply chain analysis.

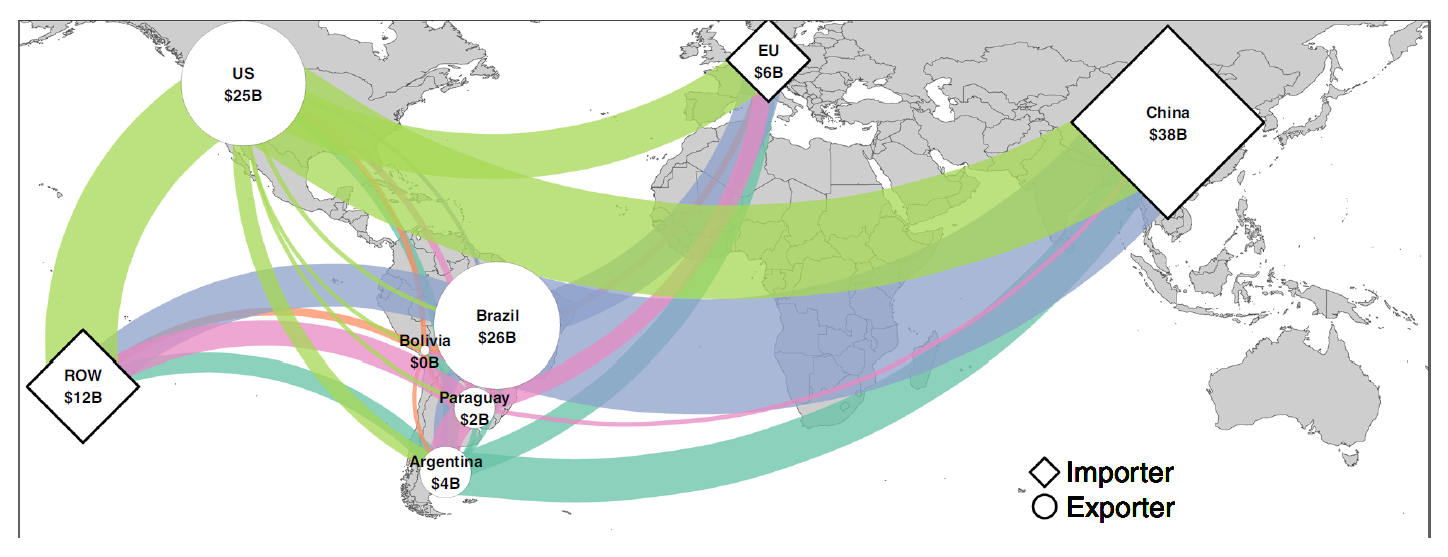
Geopolitical changes with China as a main Actor
The key question is whether Brazil can establish policies that balance economic imperatives with conservation by leveraging technological tools and international cooperation to drive sustainable outcomes. Given that Brazil’s agricultural exports and land-use patterns are evolving, multitemporal satellite analysis and a robust monitoring pipeline can help researchers uncover the material processes behind deforestation. The central issue is whether this type of analysis can effectively inform policy decisions that reconcile economic growth with environmental stewardship.
“The Amazon is not just an environmental battleground—it is a geopolitical chessboard where economic interests, environmental policies, and international relations intersect.”
“From afar, we observe. But now, we must act.”
