
Meanders on the Lower Mississippi River
In the battle between architecture and nature, nature tends to win. Therefore, it is important that we understand how rivers move over time so that we can know the best and the worst places to build.
Our project studies the Lower Mississippi River from Cairo, Illinois to New Orleans, Louisiana.
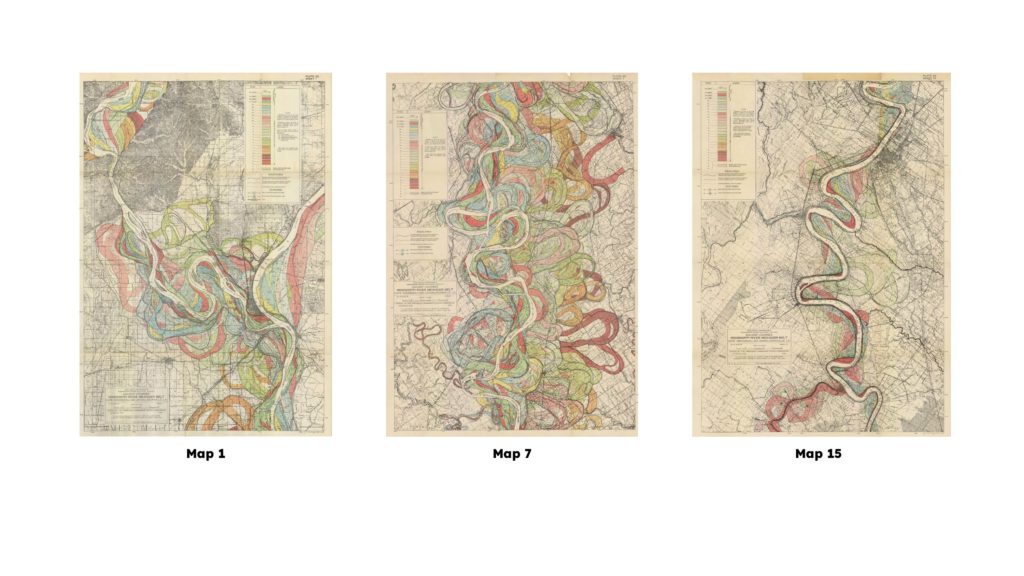
This section of the Mississippi was studied by Harold Fisk, a cartographer working for the U.S. Army Corp of Engineers in 1944. He produced 15 maps to show the river in 1944, 1820, 1765 and 27 other dates that are represented by various colors on his maps. While many believe these maps are works of art, they are also part of an engineering report from 1944 titled a ‘“Geological Investigation of the Alluvial Valley of the Lower Mississippi River.”
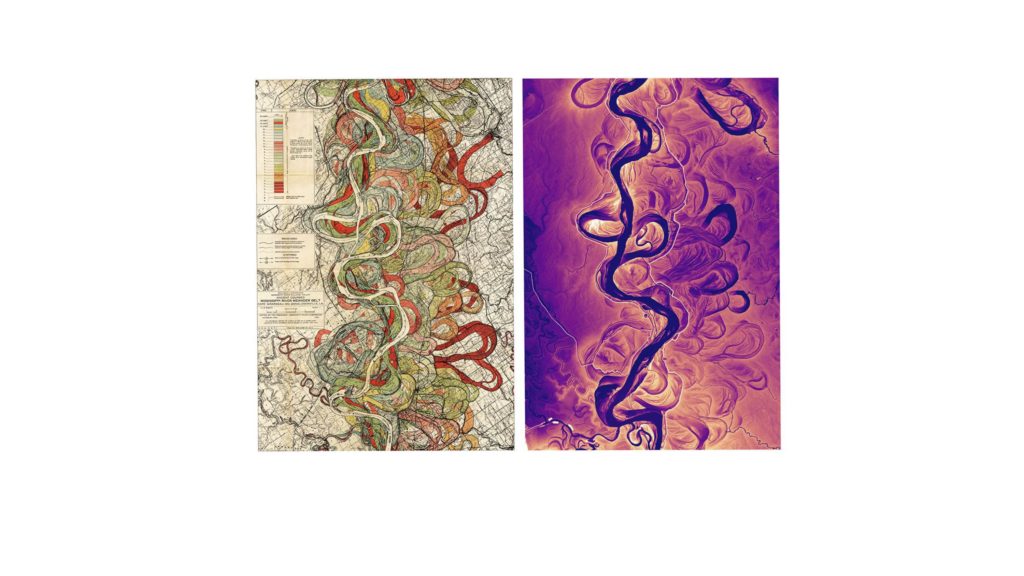
The maps have inspired many to showcase the latest technology and methods of their time. The image on the right by Dan Coe of Washington Geological Survey is part of a series covering the same section as Harold Fisk, but instead uses aerial lidar photography. These images were part of the December 2019 edition of the National Geographic Magazine.

Robert Hodgin created procedural models in HoudiniFX in 2020.

We hoped to add our contribution to studying this famous section of river by use machine learning to predict it’s future path by studying the geometry of the current path of the river and the path of the river from 1944.

This diagram from Richard Marston helped us learn how meanders can be described mathematically.

Our workflow mode was to trace the rivers, split the curves into a series of meanders, and extract features. Then the next part involved augmented the dataset and building a model. Lastly, this would be used to make a prediction.
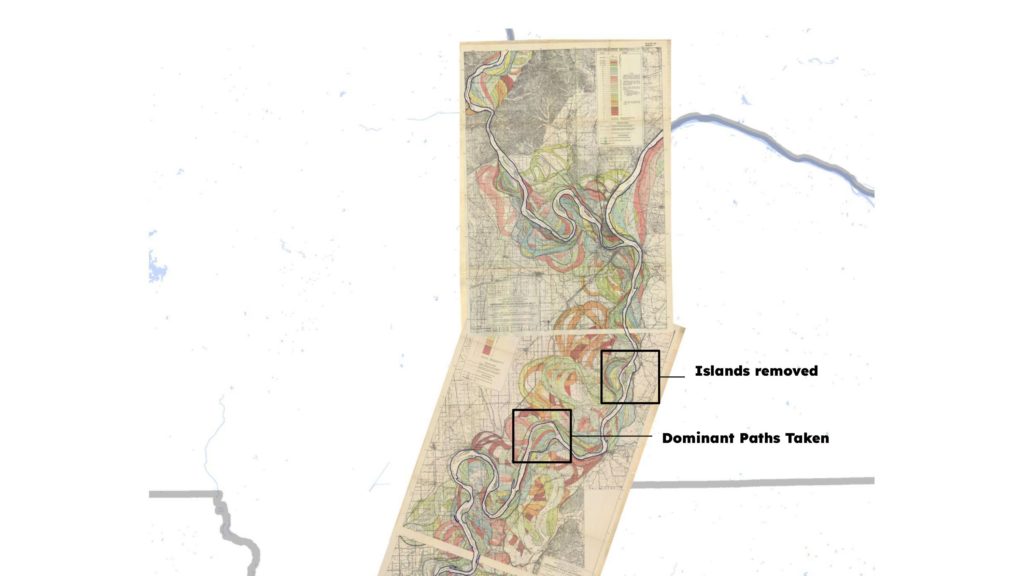
We needed both sides of the river traced to understand the width of the river. Islands were removed and dominant paths taken to create one single continuous curve for each side.
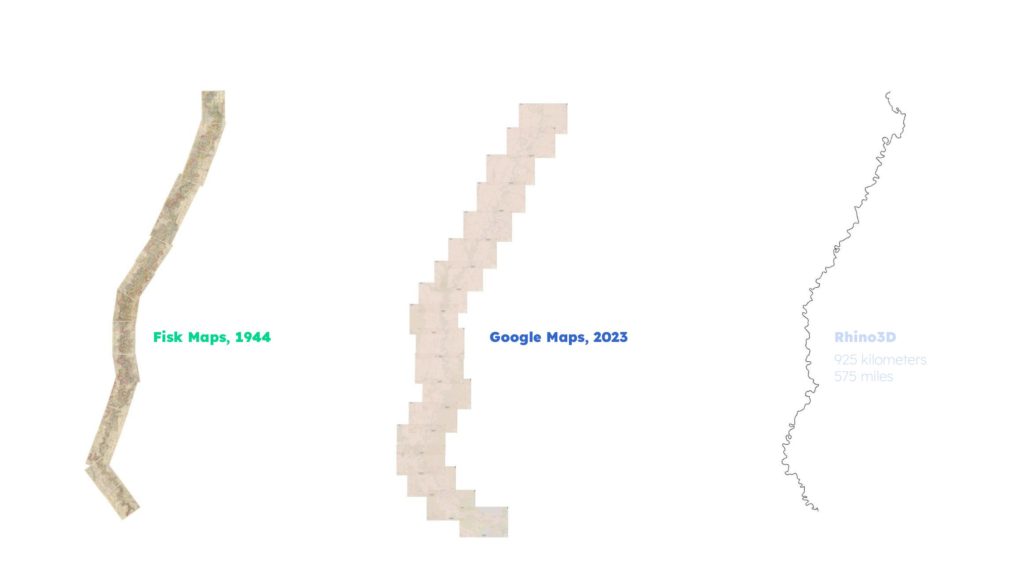
Our tracing process resulted in a continuous NURBS curve into Rhino3D for both the 1944 maps and the 2023 maps.
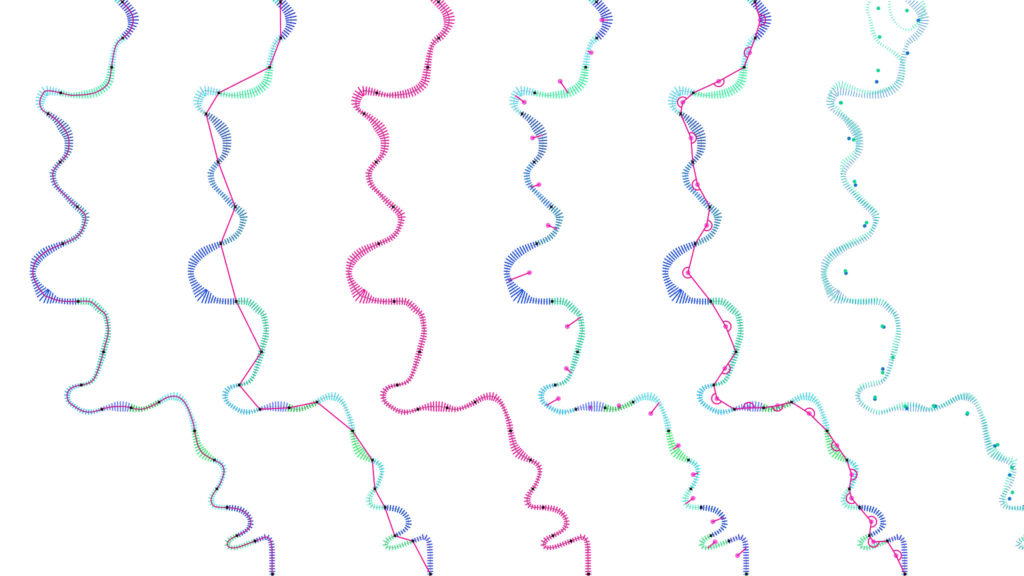
The features were extracted shown from left to right: meander length, start to end, average width, meander amplitude, angle, and correlation with the help of Grasshopper3D.

Features collected were meander length, distance from the start to the end of meander, the average width of the river, the amplitude of the meander, the angle of the meander, the distance from the center to the start of Meander and to the end of the meander.

This resulted in csv file of all of the features for 139 meanders for 1944 and 2023.

Meanders from 1944 in green and from 2023 in blue.
We filtered our data to remove outliers resulting in 119 meanders to work with.
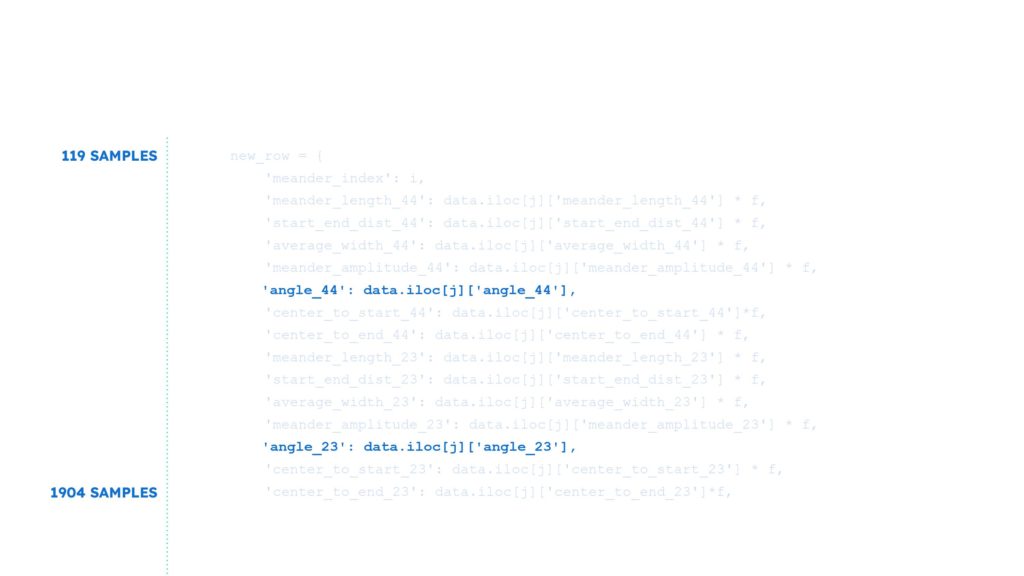
This was a small number of samples as the desirable amount is around fifty samples per feature. We had three choices to enlarge the dataset. We could firstly trace more rivers which we didn’t have time to do in this short project, we could tween the meanders between 1944 and 2023 and lastly as we know meanders are fractals we could scale the meanders. Going with the last option, we enlarged our dataset to 1904 samples.
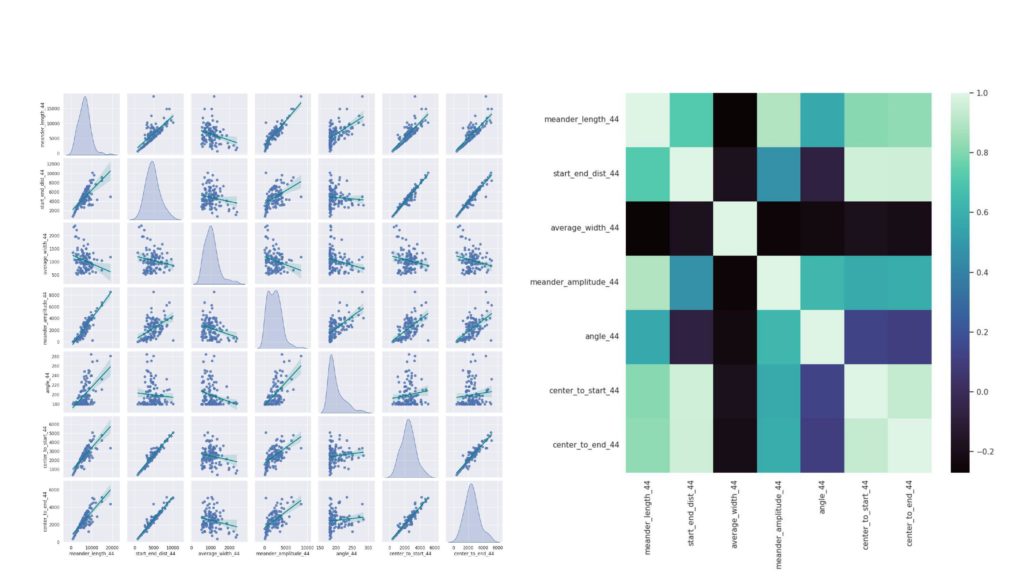
Pair plots and correlation matrix

Finding correlated data
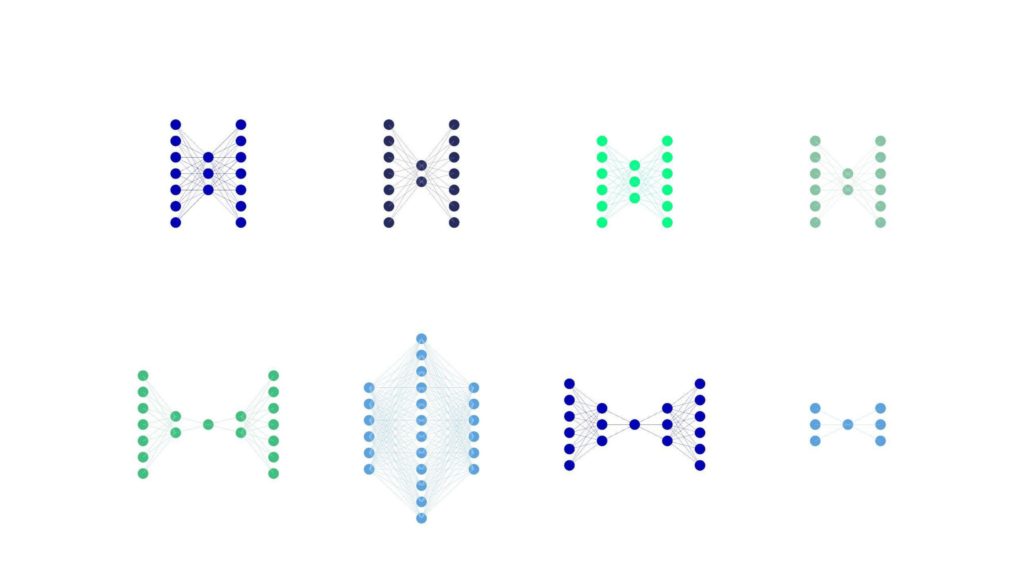
Using an Artificial Neural Network (ANN), we iteratively examined the accuracy of many model architectures and layers.

The most successful model had six inputs and 6 outputs with a hidden layer of 12 neurons. Accuracy remained quite low, but we think tracing a lot more rivers would lead to workflow to success.

The 2023 meander in dark blue and the 2102 meander in light blue with a thicker stroke.
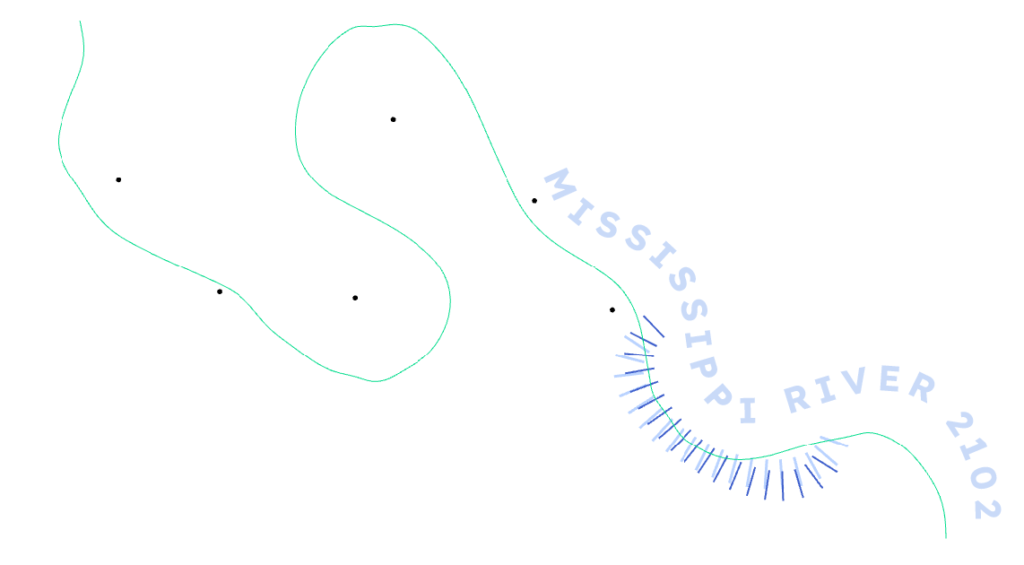
And so we can forecast the meander in 2102 orientating it on the original river path.
